
RockQuery
An Ontology-based Data Querying Tool
Jose Lozano, Joel Carbonera, Marcelo Pimenta and Mara Abel
Institute of Informatics, Federal University of Rio Grande do Sul, Porto Alegre, RS, Brazil
Keywords:
Ontology, Ontology View, Ontology Engineering, Human-computer Interaction, Interface, Interaction, Visual
Query Systems.
Abstract:
Nowadays many petroleum companies are adopting different knowledge-based systems in order to improve the
reservoir quality prediction. In the last years, these systems have been adopting ontologies for representing
the domain knowledge. However, there are still some challenges to overcome for allowing geologists with
different backgrounds to retrieve information without the help of an information technology expert. New
terminology can be added to the ontology, making the user interaction cumbersome, especially for the novice
users. In this paper, we propose an approach that combines ontology views with Human-Computer Interaction
(HCI) techniques, for improving the user interaction in computer applications, by reducing the overload of
information with which the user should handle for performing tasks. We propose RockQuery; a new Visual
Query System that applies our approach, and which is able to present to the user only the knowledge that
is relevant for supporting the required query formulation. In addition, the interaction design of RockQuery
includes data visualizations that help geologists to make sense of the retrieved data. In order to test our
approach, we evaluated the impact of using ontology views in the performance of the users for formulating
queries.
1 INTRODUCTION
In the last years, the adoption of ontologies by
knowledge-based systems has been increasing. These
systems evolve over time and, during this process, the
ontologies are extended by including new terminol-
ogy. The users perform queries in these knowledge-
based systems in order to retrieve information for sup-
porting decision-making processes. They have differ-
ent ways of formulating a query, but the process can
be summarized as follows. Firstly, the users organize
in their minds a set of concepts that are required to
formulate the query. Then, the users formulate the
query by combining concepts and instances of those
concepts. Finally, the users perform the query on the
information system. Sometimes, the performing of
this query process can be challenging, because the
users do not find in the application the required con-
cepts. This can happen because the interface presents
to the user a huge amount of concepts or relations.
This situation characterizes what the literature calls
information overload. According to (Ho and Tang,
2001; Keim et al., 2008; Karr-Wisniewski and Lu,
2010), information overload happens when an indi-
vidual is oversupplied with information, or when the
quantity of information exceeds the cognitive capa-
bility of an individual or, in other words, when an in-
dividual’s information processing capabilities are ex-
ceeded by the information processing requirements.
The same authors state that this problem affects not
only individual’s work performance, but also business
productivity on an organizational level.
Another reason that hinders the users to retrieve
the desired information is the interaction design ap-
plied in the visual query system (VQS). In some tools,
the interface is not well designed to support end-users
in the query process.
In this work, we claim that it is important to de-
velop computer applications that avoid the informa-
tion overload, by identifying only the knowledge that
is relevant for the task at hand, reducing the amount
of concepts or relations that are presented to the users.
We also claim that this can be taken as a principle
for guiding the interaction design of visual query sys-
tems.
In this paper, we propose an approach for im-
proving the user interaction in ontology-based visual
query systems. Our approach combines HCI notions
and methods with the notion of ontology view. In this
context, an ontology view is a smaller sub-set of a big-
25
Lozano J., Carbonera J., Pimenta M. and Abel M..
RockQuery - An Ontology-based Data Querying Tool.
DOI: 10.5220/0005379500250033
In Proceedings of the 17th International Conference on Enterprise Information Systems (ICEIS-2015), pages 25-33
ISBN: 978-989-758-098-7
Copyright
c
2015 SCITEPRESS (Science and Technology Publications, Lda.)
ger ontology, which is developed for meeting the re-
quirements of a specific task. The resulting approach
reduces the overload of the information, by present-
ing to the user only the information that is required
by the task at hand. This approach also follows the
Nielsen’s principle of memory recognition and recall
(Nielsen, 1993), which states that is preferable that
the interface present to the user the information that
she/he can recognize.
Besides that, in this paper we also present Rock-
Query; a new VQS for consulting petrographic data,
which applies our approach. Our system has three
main aspects: (1) the interface design, (2) the rep-
resentation of query results with data visualizations,
and (3) the ontology view graph used for formulat-
ing query. In order to evaluate our approach, we
analyzed the impact of using ontology views in the
performance of the users for formulating queries in
RockQuery.
In Section 2, we analyze four visual query sys-
tems. In Section 3, we briefly present the notion of
Well-founded Ontology Views, which is applied in our
work. Section 4 describes the RockQuery design and
presents the application of the tool in a case study.
Section 5 presents the results of the evaluation of
RockQuery. Finally, Section 6 presents our main con-
clusions.
2 RELATED WORKS
In this section, we describe four ontology-based vi-
sual query systems that were proposed in the litera-
ture. Our aim is to analyze the main features of visual
query systems and to evaluate if the state of the art
systems are able of presenting to the user only the in-
formation that is required by the user for a given task.
PetroQuery
r
(Castro et al., 2005) is a mature
commercial VQS that supports multidimensional,
user-defined queries over a petrographic database
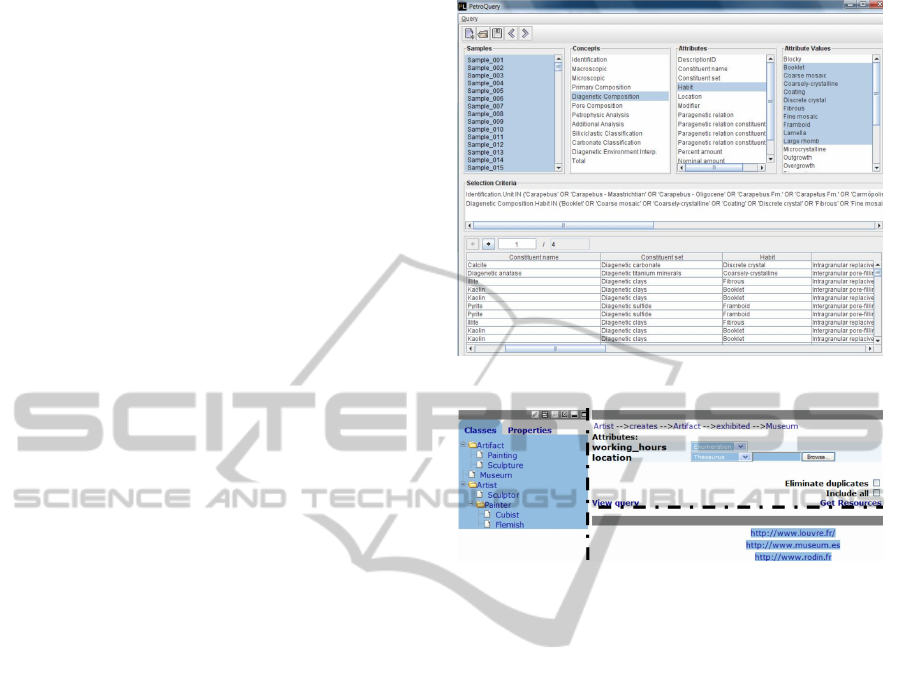
structured by ontologies. PetroQuery GUI consists of
three sections. In the first section, there are list boxes
for concept, attribute and value selection. In the sec-
ond section, the query is shown in a SQL like form in
a list box. The last section contains the results, which
are represented in a table (see Figure 1). The pro-
cess of query formulation starts by selecting one or
multiple samples. After, the user selects the concept,
attribute or value that she/he is looking for in the sam-
ple descriptions. Throughout the process of selecting
concepts, a textual query appears in the second sec-
tion. Each line is a SQL like query. The user can also
delete a line of the query.
At the same time, during query formulation, that
Figure 1: PetroQuery Interface (Castro et al., 2005).
Figure 2: GRQL Interface (Athanasis et al., 2004).
query line text is added to the list box and the result
appears in the table. In addition, the user can visualize
in a ternary plot the results in another window.
Graphical RQL (Athanasis et al., 2004) is a GUI
for browsing and filtering RDFs description bases.
The GRQL GUI consists of three basic interaction ar-
eas. The left area provides a tree-shaped display of
the subsumption hierarchies of both the classes and
properties defined in an RDF schema. The right up-
per area of the GRQL GUI allows the users to explore
progressively the individual RDF class and property
definitions and generate navigational and/or filtering
RQL queries. Finally, the right lower area presents
the constructed query/view results. A snapshot of the
GRQL GUI is illustrated in Figure 2. The process of
query formulation starts in the left area. The users se-
lect a node in the tree and can access their subclasses
and sub-properties by expanding the tree nodes. After
selecting the concept or property, its complete defini-
tion is shown in the right upper area and the user can
perform operations over the instances.
VisualSPEED (see Figure 3) is a visual query in-
terface that provides a visual query interface, and sup-
ports automatic query generation (de Alencar and Sal-
gado, 2013). The system is structured in two layers:
the user interaction layer and the management layer.
The user interaction layer consists of four modules (a)
ICEIS2015-17thInternationalConferenceonEnterpriseInformationSystems
26
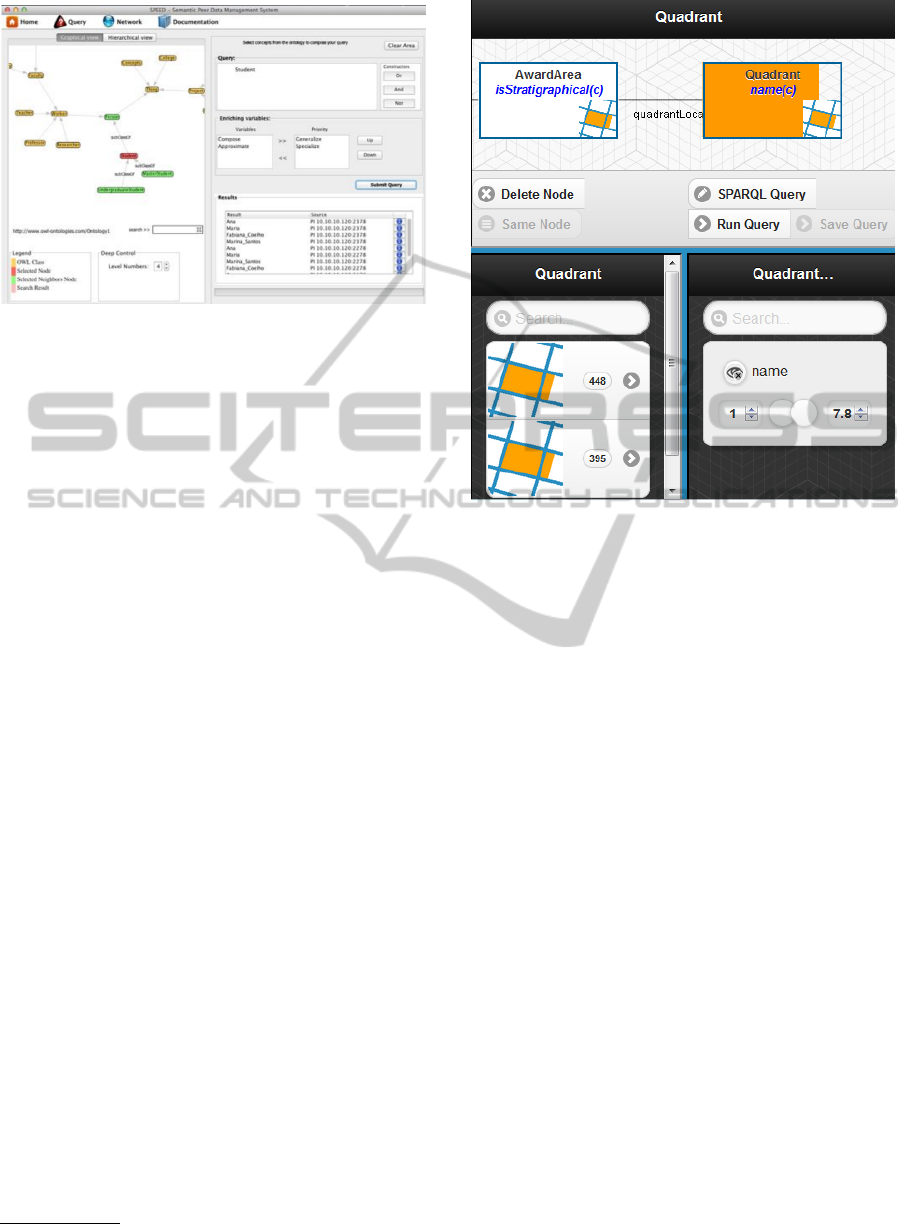
Figure 3: VisualSPEED Interface (de Alencar and Salgado,
2013).
View Ontology, which is responsible for ontology vi-
sualization; (b) Form Query, which is responsible for
formulating queries that are sent to the query module;
(c) View Results, which is responsible for organizing
and displaying the results of queries; and (d) View
network, which is responsible for displaying network
topology. The management layer is composed of two
modules that are responsible for the communication
between the user interaction and the SPEED’s core
layers.
The process of query formulation is done through
the selection of concepts in the graphical representa-
tion of the ontology. The selected concepts are shown
on query composition field, which is in the form of a
query module. In this area, logical constructors such
as OR, AND or NOT can be used to compose the
query. The query submitted by the user is interpreted
by the system and translated to a SPARQL query to be
executed in data. The users can customize the query
by selecting and prioritizing semantic relationships.
The enrichment of the query is shown in the bottom
right side of Figure 3. The system displays the results
organized in a table shown in the bottom right side
of the Figure 3 and presents the data in another win-
dow. This VQS combines a graph representation for
performing their queries.
OptiqueVQS (Soylu et al., 2013) is a visual query
system for the Optique Scalable End-user Access to
Big Data project
1
. It relies on ontology-base data ac-
cess (OBDA) framework (Kogalovsky, 2012), which
allows access relational data through ontologies. The
interface consists of three widgets, which can be
viewed as building blocks of a VQS with limited func-
tionality and complexity. The first widget (W1 - see
the bottom-left part of Figure 4) is a menu-based
widget for querying by navigation. It allows users to
1
http://www.optique-project.eu/
Figure 4: Optique Query Interface (Soylu et al., 2013).
navigate through the concepts by pursuing relation-
ships between them. The second widget (W2 - see the
bottom-right part of Figure 4) is a form-based wid-
get, which presents the attributes of a selected con-
cept for operations of selection and projection. The
third widget (W3 - see the top part of Figure 4) is
a diagram-based widget that provides an overview of
the constructed query and affordances for manipula-
tion.
The process of query formulation is described as
follows: a user first selects a kernel concept (the start-
ing concept) from W1, which initially lists all domain
concepts accompanied with icons, descriptions, and
the potential/approximate number of results. The se-
lected concept becomes the focus/pivot concept and it
appears on the graph as a variable-node, while in W2
is displayed its attributes, and in W1 is displayed all
concept-relationship pairs pertaining to this concept.
The user can select attributes to be included in the re-
sult list and can impose constraints on them. The user
should follow the same steps for including new con-
cepts in the query. She/he can jump to a specific part
of the query by selecting the corresponding variable-
node. Furthermore, the user can interact with the sys-
tem in textual form by using the SPARQL mode.
In Table 1, we present a comparison of the four
visual query systems described above, labeled as 1 for
PetroQuery, 2 for GRQL, 3 for VisualSPEED and 4
for OptiqueVQS, respectively. The comparison was
performed according to the following criteria:
RockQuery-AnOntology-basedDataQueryingTool
27

Result Visualization. Evaluates if the interface has a
section for data visualization. This includes dif-
ferent diagrams that help the user to understand
the data.
Query History. Evaluates if the interface has a sec-
tion for query history. It is common in search in-
terface to have a query history because it helps
users to reuse a previous query.
Ontology Visualization. Evaluates if the interface
has a section for the ontology visualization. An
ontology visualization will help in the exploration
and navigation of concepts to formulate the query.
Text Filter. Evaluates if the interface has text filters.
Text filters are important in search interface. It is
the widget where the user informs a keyword for
searching it within a list of terms.
Query Visualizer. Evaluates if the interface has a
section to visualize the query formulation.
Knowledge Adaptation. Evaluates if the system al-
lows presenting in the interface only the amount
of information that is necessary for the task at
hand. This feature especially importante for our
work.
Codification. Evaluates if the interface has a section
where the user enters his query using any syntax
of a query language.
The results show that no VQS contains a section
for data visualization in a unique interface. Petro-
Query has the query history feature that other VQSs
do not have. VisualSPEED is the VQS that offers a
panel for ontology visualization. Its visualization use
icons in the representation of concepts. Optique uses
filters for searching concepts and attributes. Optique
and VisualSPEED provide the capacity of codifying
the query in SPARQL. VisualSPEED, Graphical RQL
and Optique consult over semantic web data stored in
a RDF or OWL database. PetroQuey consults over re-
lational data. No one VQS tries to adapt the informa-
tion shown in the interface to the user requirements.
That is, if the ontology has a huge amount of terms,
the interface will list all of them. We assume that it
would be preferable to avoid the information overload
by presenting to the user only the knowledge that the
user recognizes as relevant to the task at hand.
3 WELL-FOUNDED ONTOLOGY
VIEWS
In (Lozano et al., 2014), the authors propose the no-
tion of well-founded ontology view (WFOV) and a set
Table 1: Comparison of four Visual Query Systems.
Criteria [1] [2] [3] [4]
Result
visualization
No No No No
Query
history
Yes No No No
Ontology
visualization
No Yes No No
Text
Filters
No No Yes Yes
Query
visualizer
Yes Yes Yes Yes
Codification No Yes No Yes
Knowledge
adaptation
No No No No
of algorithms that can extract a WFOV from a base
ontology. In this context, ontology views are sub-
sets of an ontology that are extracted according to
the user requirements and that can overlap other on-
tology views. On the other hand, according to the
authors, WFOV are ontology views that preserve im-
portant ontological meta-properties (such as identity,
existential dependency, etc). The ontological meta-
properties adopted in this work are provided by a
foundational ontology called UFO (Unified Founda-
tional Ontology) (Guizzardi, 2005), which is a theo-
retically well-founded domain independent system of
categories and their ties that can be used to construct
models of specific domains, such as (Carbonera et al.,
2015; Carbonera et al., 2013; Carbonera et al., 2011;
Ferrandis et al., 2013; Gonc¸alves et al., 2007).
The algorithms proposed by (Lozano et al., 2014)
take as input a set of target concepts, which are se-
lected by the user, and extracts the minimal ontol-
ogy view that does not violate the philosophical and
cognitive constraints that should be followed by on-
tologies and that are captured by the meta-properties.
This approach was proposed for allowing a consistent
reduction of an ontology, in order to provide to the
users only the fragments of the ontology that are rele-
vant to the task at hand.
4 RockQuery DESIGN
RockQuery interaction design is based on the applica-
tion of well-founded ontology views (WFOVs) in the
query formulation process. The adoption of WFOV
helps users to focus in the specific part of the whole
ontology in that they are interested in.
The interface of RockQuery was designed consid-
ering the following three main components:
The Exploration Panel. it is located on the left side
of the interface. It provides several alternatives for
ICEIS2015-17thInternationalConferenceonEnterpriseInformationSystems
28
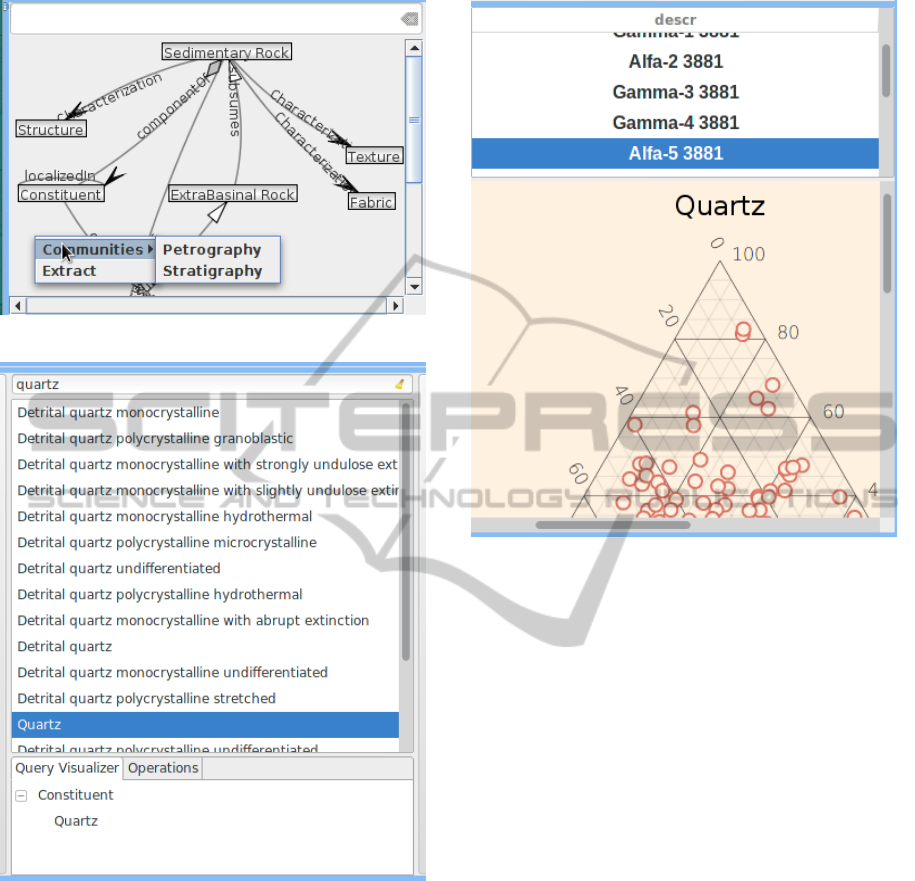
Figure 5: Exploration Panel.
Figure 6: Processing Panel.
the user to analyze the ontology. It can be viewed
in Figure 5.
The Processing Panel. it provides the selection of
the desired instances. It is presented in Figure 6.
The Analysis Panel. it lets the user visualize the re-
sults using different kinds of graphs. It can be
viewed in Figure 7.
The following subsections provide a more detailed
description of each component.
4.1 Exploration Panel
The exploration panel (see Figure 5) consists of three
Figure 7: Analysis Panel.
widgets. The first one is a text box where the user
can enter a term that she/he is searching. While the
user writes the term, an autocomplete function sug-
gests possible related terms. Below this widget, it
is shown the ontology visualization module, which is
described below, and a Recent Queries widget, which
contains the last queries performed by the user.
The ontology visualization panel, on its turn,
presents the ontology in a graph diagram, which sup-
ports zooming and panning. Moreover, a text box al-
lows user to enter terms that she/he is looking for in
the ontology, for the query formulation.
The main feature of the exploration panel is the
application of WFOV in the ontology visualization
panel. The WFOVs are applied both statically and
dynamically.
In RockQuery, during the registration of users in
the system, they are assigned to the specific fields of
Geology (such as Stratigraphy, Sedimentology, etc)
that can be considered as their communities of in-
terest. When the user logs in, the system extracts
a WFOV that includes the set of concepts and rela-
tions that are typical to the community to which the
user belongs. This WFOV is generated from a set of
key terms previously selected by the ontology engi-
neer and that are configured in the system database as
representative terms of some specific geological com-
munity. Thus, in the first experience of the user with
the system, she/he will interact with a WFOV that bet-
RockQuery-AnOntology-basedDataQueryingTool
29

ter fits to her/his profile. In this case, the WFOV are
used in a static way. It is important to notice that the
VQS also allows the user to switch the ontology vi-
sualization for presenting the whole ontology or the
views of other communities.
On the other hand, the WFOV can be dynamically
generated from terms provided by the user in her/his
queries or interaction with the ontology visualization.
Specifically, when the user enters a term in the text
box or selects nodes of the ontology, the system gen-
erates a WFOV from the base-ontology, considering
the selected terms. At the end of this process, the re-
sulting WFOV is presented to the user. This resulting
WFOV can help the user in identifying additional rel-
evant concepts for the query formulation. The gen-
eration of WFOV is performed using the algorithms
proposed by (Lozano et al., 2014).
Notice that all of the operations that can be per-
formed over the ontology can also be performed over
the WFOV. The adoption of WFOV allows the VQS
to comply with the Nielsen’s Principle of Recognition
rather than recall. According to this principle, it is
preferable to present in the interface only the knowl-
edge that is required by the user for a given task.
4.2 Processing Panel
The processing panel (see Figure 6) consists of two
sections, a text box and a list box that displays the
instances of the selected concept. The user can se-
lect multiple instances and, during the selection pro-
cess, the query visualizer section adds the selected in-
stances to the tree box. The user can delete instances
in the tree box, updating the tabular data shown in the
analysis panel.
4.3 Analysis Panel
The analysis panel (see Figure 7) consists of two dis-
plays. One is the tabular display, and the other is
the data graph. During the sessions of interview with
users and of prototype testing, we identified the neces-
sity of having an analysis panel integrated in the same
query interface. This feature is crucial in the analysis
that is carried out by the user. Currently, RockQuery
provides ternary plot and scatter plot. In the future,
other data visualizations will be included in order to
help geologist to visualize the spatial data.
4.4 Application of RockQuery in a Case
Study
The application of RockQuery is illustrated through
a scenario of exploring and consulting the follow-
ing query: retrieve sample descriptions that include
blocky dolomite. This scenario shows the interactions
and features of RockQuery, and highlights how the
ontology and a data visualization support sensemak-
ing of petroleum data.
The first screen that is presented to the user is the
login dialog (Figure 8 (a)). Following, the interface
displays the well founded ontology view (in the form
of a graph of concepts and relations) corresponding
to the user’s community generated by the key terms
of the community of which the user belongs. This on-
tology view is extracted from the base ontology, us-
ing the approach proposed by (Lozano et al., 2014).
Furthermore, when the user is navigating in the ontol-
ogy visualization widget, she/he can activate a popup
menu for switching the visualization to the whole on-
tology or to WFOVs of other communities. Notice
that these WFOVs are statically generated from terms
selected by the ontology engineer as representatives
of their respective communities. Besides that, the
user can dynamically generate others WFOV during
the interaction with the system. Thus, WFOVs can be
refined, since new WFOVs can be generated from a
given WFOV, when the user selects additional terms
in it.
In this interface, the user can analyze and navi-
gate through the ontology graph for formulating the
query. When the user selects a node of the ontol-
ogy graph, the system lists all the instances of the
selected concept. If the user clicks twice on the in-
stance (item of the listbox), the instance is added to
the query visualizer. The user can remove a concept
or an instance from the query visualizer by selecting
it and pressing the delete key. In the interface, there
are two buttons that allow hiding the panels. This in-
creases the space available for navigating or for vi-
sualizating data. When the user does not find a con-
cept, she/he can enters a term in the search concept
box (Figure 8 (b)). The autocomplete tool suggests
concepts, according to the information provided by
the user. When the user presses enter, the algorithm
proposed by (Lozano et al., 2014) extracts a well-
founded ontology view from the ontology, taking as
input the term provided by the user. Then, the ontol-
ogy visualization displays the resulting well-founded
ontology view to the user (Figure 8 (c)). The result-
ing view can be used by the user for identifying other
concepts and relations that can be useful for the query.
When the user selects a node, the color of the se-
lected node is changed and a list of instances of that
concept appears in the processing panel (Figure 8 (d)).
If the concept has a huge volume of instances, the
user can enter a term in the text box of the process-
ing panel for filtering the data. In each iteration, the
ICEIS2015-17thInternationalConferenceonEnterpriseInformationSystems
30

treeviewer also adds the term in the query visualizer
section. When the user selects one of the items of
the listbox of the processing panel, the visualization
is presented (Figure 8 (e)). The query formulation is
an iterative process of selecting a concept and its re-
spective instance. This involves the use of the explo-
ration and processing panel. The feature of text filters
in both panels helps in finding the desired term. At
the end of the process, the user can save its query.
Following this workflow, the user can iteratively
construct its query, refine it and visualize the result-
ing data. The user’s landscape of the areas related to
sensemaking is shown in Figure 8. Typically, tabu-
lar data is used to show the query results, while the
analysis, on the other hand, is performed in another
window. One of the RockQuery’s main difference is
that in a single interface, the user can visualize the
tabular data and analyze its visualization.
5 EVALUATION OF OUR
APPROACH
In this work, we evaluated the impact of using well-
founded ontology views in the performance of the
users for formulating queries. In order to carry out
this evaluation, we compared the times taken by the
users for formulating a set of queries. We considered
4 users, which were divided in two groups. For the
group 1, the RockQuery system used well-founded
ontology views for presenting the ontology to the
users. For the group 2, the RockQuery presented the
whole ontology for users during the query formulation
process. Considering the lack of availability of users
that have a geologic background and due to their time
constraints, we considered a time limit of 5 minutes
for formulating each query.
In our evaluation, we considered 4 users. The user
1 (U1), 2 (U2), 3 (U3) are master’s students in Geol-
ogy; U1 is specialized in carbonatic rocks; U2 and U3
are specialized in siliciclastic rocks. The user 4 (U4)
is expert in Stratigraphy. The users have previous ex-
perience with a VQS. U1 and U3 are 22 years old and
they can be considered as frequent expert users. U2
is 26 years old and is also a non-frequent user. He
does not use VQS often, but he has experience in the
domain. U4 is 43 years old and can be considered a
non-frequent normal user, since she is not an expert
in the domain of Diagenesis. In summary, they are all
petroleum geologists, with different ages, levels of ex-
perience and specializations. Most of them have basic
notions in Computer Science. Table 2 summarizes the
user characterization described above.
In our evaluation procedure, users had to use the
Figure 8: Interaction. a) RockQuery’s interface, initial
user’s landscape. b-e) Firstly, the user enters a term in the
search concept box. Then, user finds the concept and selects
it; the color of the selected node is changed in the visualiza-
tion and the list of instances of that concept appears in the
processing panel. At the same time, the tabular data with a
respective a visualization appears in the analysis panel.
Table 2: Users Characterization.
Age Expert Specialization Sex
U1 22 Yes Geologist Male
U2 26 No Geologist Male
U3 22 Yes Geologist Female
U4 43 No Stratigraphy Female
RockQuery for performing some queries. The follow-
ing queries were used in the test:
P1. Select the thin sections of Campos basin.
P2. Select the thin sections with the constituents
quartz, zeolite and sillimanite, which are localized
in the framework or in burrow pore.
P3. Select the thin sections that contain diagenetic
constituents with blocky habit.
RockQuery-AnOntology-basedDataQueryingTool
31

For formulating these queries, the user had to se-
lect a different number of concepts with its instances.
For instance, in query P1 the user is asked to select
one concept and one instance. In order to do that,
the user should use the text box for filtering instances,
because the concept basin has a huge volume of in-
stances. In the query P2, the user need to select one
concept (constituent) related with another (pore). In
the query P3, it is tested if the user is able to select
one attribute (blocky habit) of a concept (constituent).
Results are presented in Table 3. U1 and U4 be-
long to the group 2. U2 and U3 belong to the group 1.
At the beginning, both users U1 and U4 were lost in
the huge amount of concepts that were presented. As
a result the time limit of 5 minutes was reached. Then
U1 understood the way of interact with the ontology
graph and was able of performing the other queries.
U4 was able of performing the query P1; however, in
the remaining queries the time limit was reached. U2
performed all the queries in less time than the other
users, regardless the fact that he is a non-frequent user
of a VQS. U3 also performed the queries in a reason-
able time.
The resuls demonstrated that, in average, the
adoption of ontology view reduces the time of per-
forming long queries such as P2, which involves more
than one concept. This suggests that the adoption of
ontology views have a positive impact, by reducing
the information overload and increasing the produc-
tivity.
Table 3: The times (in seconds) taken by the users for per-
forming a query with ontology views (group 1) and without
it (group 2). In this table, (>) means that the time limit of 5
minutes was reached.
Query
Group 1 Group 2
U2 U3 U1 U4
P1 14:13 30:01 > 30:08
P2 74:12 110:88 299:00 >
P3 18:36 17:41 72:84 >
According to the results of the evaluation process,
when the system applies ontology views, the users
find the required concepts and perform the query in
less time than when the system presents the whole
ontology. This suggests that RockQuery reduces the
overload of information, allowing the user to focus on
what she/he needs for performing the query. This re-
sults in a time reduction for performing the query.
6 CONCLUSIONS
In this paper, we propose an approach that com-
bines HCI concepts and methods with ontology views
for improving the interaction of users with ontology-
based visual query systems, by avoiding the informa-
tion overload. In our approach, ontology views are
applied for identifying only the knowledge that is rel-
evant for the user in a given task. We apply this ap-
proach for developing RockQuery, a visual query sys-
tem for consulting petrographic data. In this system,
our approach helps the user to learn by exploration
of the ontology graph. The validation demonstrated
that the application of ontology view in RockQuery
implies a reduction of time in performing queries.
ACKNOWLEDGEMENTS
We gratefully thank Brazilian Research Council,
CNPq, PRH PB-17 program (supported by Petro-
bras), and Endeeper Co, for the financial support to
this work.
REFERENCES
Athanasis, N., Christophides, V., and Kotzinos, D. (2004).
Generating on the fly queries for the semantic web:
The ics-forth graphical rql interface (grql). In The Se-
mantic Web ISWC 2004, pages 486–501.
Carbonera, J. L., Abel, M., and Scherer, C. M. (2015). Vi-
sual interpretation of events in petroleum exploration:
An approach supported by well-founded ontologies.
Expert Systems with Applications, 42(5):2749–2763.
Carbonera, J. L., Abel, M., Scherer, C. M., and Bernardes,
A. K. (2011). Reasoning over visual knowledge. In
ONTOBRAS-MOST, pages 49–60. Citeseer.
Carbonera, J. L., Abel, M., Scherer, C. M., and Bernardes,
A. K. (2013). Visual interpretation of events in
petroleum geology. In Tools with Artificial Intelli-
gence (ICTAI), 2013 IEEE 25th International Confer-
ence on, pages 189–194. IEEE.
Castro, E., Mastella, L., Abel, M., and DeRos, L. (2005).
Petroquery: a tool for consultation and navigation
over ontology. Regional School of Database, Brazil.
de Alencar, A. L. and Salgado, A. C. (2013). A visual
query interface for ontology-based peer data manage-
ment systems. Brazilian Simposium of Information
Systems.
Ferrandis, A. M. M., L
´
opez, O. P., and Guizzardi, G.
(2013). Applying the principles of an ontology-based
approach to a conceptual schema of human genome.
In Conceptual Modeling, pages 471–478. Springer.
Gonc¸alves, B., Guizzardi, G., and Pereira Filho, J. G.
(2007). An electrocardiogram (ecg) domain ontology.
In Workshop on Ontologies and Metamodels for Soft-
ware and Data Engineering, 2nd, Jo
˜
ao Pessoa, Brazil,
pages 68–81.
ICEIS2015-17thInternationalConferenceonEnterpriseInformationSystems
32

Guizzardi, G. (2005). Ontological Foundations for Struc-
tural Conceptual Models. PhD thesis, University of
Twente, The Netherlands.
Ho, J. and Tang, R. (2001). Towards an optimal reso-
lution to information overload: an infomediary ap-
proach. In Proceedings of the 2001 International ACM
SIGGROUP Conference on Supporting Group Work,
pages 91–96. ACM.
Karr-Wisniewski, P. and Lu, Y. (2010). When more is too
much: Operationalizing technology overload and ex-
ploring its impact on knowledge worker productivity.
Computers in Human Behavior, 26(5):1061–1072.
Keim, D., Andrienko, G., Fekete, J.-D., G
¨
org, C., Kohlham-
mer, J., and Melanc¸on, G. (2008). Visual analytics:
Definition, process, and challenges. Springer.
Kogalovsky, M. (2012). Ontology-based data access
systems. Programming and Computer Software,
38(4):167–182.
Lozano, J., Carbonera, J. C., Abel, M., and Pimenta, M.
(2014). Ontology view extraction: an approach based
on ontological meta-properties. In Proceedings on IC-
TAI.
Nielsen, J. (1993). Usability Engineering. Interactive tech-
nologies. Morgan Kaufmann.
Soylu, A., Giese, M., Jimenez-Ruiz, E., Kharlamov, E.,
Zheleznyakov, D., and Horrocks, I. (2013). Op-
tiquevqs towards an ontology-based visual query sys-
tem for big data. In Proceedings International Con-
ference on Management of Emergent Digital EcoSys-
tems.
RockQuery-AnOntology-basedDataQueryingTool
33
