
Metrics to Support It Service Maturity Models
A Case Study
Bianca Trinkenreich
and Gleison Santos
Department of Computing, Universidade Federal do Estado do Rio de Janeiro (Unirio), Rio de Janeiro, Brazil
Keywords: Measurement, Key Performance Indicator, IT Service Quality, Maturity Models, Case Study.
Abstract: Background: Maturity models for IT service require proper identification of critical business process and
definition of relevant metrics to support decision-making, but there is no clear direction about what should
be those critical business processes and metrics. Aims: This is part of a research in progress concerning the
identification of adequate metrics to be used by organizations deploying IT service maturity models. We
have conducted a systematic mapping study to answer: (i) What metrics are being suggested for IT service
quality improvement projects? and (ii) How do they relate to IT service maturity models processes? In this
paper, we aim to answer new research questions: (iii) What kind of relationship exist between processes that
appear in derived metrics that include more than one process? (iv) Which of literature suggested metrics are
being used by organizations? Method: We have conducted a case study in industry. Results: From
relationship found between mapping study metrics, we had analysed those ones used by organization that
had available data, but we could not evidence a correlation between them, even being related. However, as a
result of this analysis, we had confirmed the need to evaluate IT services through multiple metrics or define
metrics in a way that the same metric be able to present different aspects about IT services management, in
order to provide a comprehensive approach about the organization scenario.
1 INTRODUCTION
IT service management is a set of specialized
organizational capabilities for providing value to
customers through services. Its practice has been
growing by adopting an IT management service-
oriented approach to support applications,
infrastructure and processes (TSO, 2011). Guidance
on how to develop and improve IT service maturity
practices is a key factor to improve service
performance and customer satisfaction (Forrester et
al., 2010). CMMI-SVC (Forrester et al., 2010) and
MR-MPS-SV (Softex, 2012a) models had been
created to attend this need. These models require
appropriate metrics to be identified in order to
monitor various processes executed for service
delivering to customers. Thus, selection of sub-
processes to be measured must be aligned with
organizational goals in order to measurements
results are able to deliver relevant information for
decision making and business support. However,
there is no clear direction or strict suggestion about
which business processes and metrics should be
considered.
We previously executed a systematic mapping
study to identify papers presenting metrics that could
be used to assess IT service quality within the
context of IT service maturity models (Trinkenreich
et al., 2015). Although some papers suggested the
applicability of some of these metrics to IT industry
we were not able to see any details about how they
had been used, neither any analysis about how
metrics that involve more than one maturity model
process area (instead of isolated ones) impact IT
services quality.
Therefore, this article aims to investigate the
applicability of such metrics in a real context.
Moreover, we aim to understand the relationship
between the metrics related to more than one IT
service process by verifying in industry how the
metrics suggested in literature are being used. To
accomplish that, we present a case study in a mining
global large company
This paper is structured as follows: literature
review on IT service maturity models and metrics
(section 2), case study (section 3) and our
conclusions (section 4).
395
Trinkenreich B. and Santos G..
Metrics to Support It Service Maturity Models - A Case Study.
DOI: 10.5220/0005398003950403
In Proceedings of the 17th International Conference on Enterprise Information Systems (ICEIS-2015), pages 395-403
ISBN: 978-989-758-097-0
Copyright
c
2015 SCITEPRESS (Science and Technology Publications, Lda.)

2 IT SERVICE MATURITY
MODELS AND METRICS
Through essential elements of effective processes
and an evolutionary path for improvement, maturity
models provide guidelines on how to design
processes, as an application of principles to meet
endless process improvement cycle (Forrester et al.,
2010).
CMMI-SVC (Forrester et al., 2010) is a maturity
model based on CMMI concepts and practices, and
other standards and service models such as ITIL
(TSO, 2011), ISO/IEC 20000 (ISO/IEC, 2011),
COBIT (Information Systems Audit et al., 2012),
and ITSCMM (Niessink et al., 2005). CMMI-SVC
model has been created for service providers and
covers necessary steps to create, deliver and manage
services. Of the 24 process areas of CMMI-SVC,
only 7 are CMMI-SVC specific: Service Delivery
(SD), Capacity & Availability Management (CAM),
Incident Resolution & Prevention (IRP), Service
Continuity (SCON), Service System Development
(SSD), Service System Transition (SST) and
Strategic Service Management (STSM).
MPS.BR Program (Santos et al., 2009) is an
initiative funded by Brazilian government that aims
to make it possible for micro, small and medium-
sized Brazilian companies to invest in process
improvement and software quality. Since 2004,
more than 600 companies have already been
evaluated by the reference model for software
process improvement, MR-MPS-SW (Softex,
2012b) (Kalinowski et al., 2014). In 2012, reference
model for IT services improvement MR-MPS-SV
(Softex, 2012a) was created to provide a maturity
model more suitable for micro, small and medium-
sized Brazilian companies, but also compatible with
the internationally accepted quality standards
(including ISO/IEC 20000) and taking advantage of
existing expertise in already available standards and
maturity models. MR-MPS-SV (Softex, 2012a) has
24 processes, of which 12 are specific and based on
ISO/IEC 20000 quality of services standard: Service
Delivery (ETS), Incident Management (GIN),
Service Level Management (GNS), Problem
Management (GPL), Change Management (GMU),
Service System Development (DSS), Budget and
Accounting Services (OCS), Capacity Management
(GCA), Service Continuity and Availability (GCD),
Release Management (GLI), Information Security
Management (GSI) and Service Reports (RLS).
Quality assessments are not just service outputs,
they also involve service delivery process evaluation
(Parasuraman et al., 1985). Measurement plays a key
role in process quality improvement initiatives.
Through process and products data collection and
analysis, measurements can quantitatively
demonstrate their quality and decision making
support. Being able to control and predict processes
future behavior allows the supplier to increase
probability of achieving expected IT service quality.
Initial levels of both presented maturity models
use measurement in a traditional way: metrics are
generally collected and analyzed comparing planned
and executed and allowing corrective actions to be
taken in future executions. At highest maturity
models levels (CMMI-SVC levels 4/5, MR-MPS-SV
levels A/B), aiming to meet quantitative
management, measurement is associated to
statistical methods and other quantitative techniques
(Forrester et al., 2010) (Softex, 2012a).
In general, effective service measurements are
planned based on a few vital and meaningful
indicators that are quantitative, economical and
proper to support desired results. With many
measures, an organization can lose focus on
improving results because it may become too intent
on measurement. Thus, we must define what metrics
and indicators are suitable to support services quality
monitoring and customer satisfaction objectives
(
TSO, 2011). The identification of such metrics is not
an easy task.
Other authors had also studied this matter. For
example, Lepmets et al. (Lepmets et al., 2011)
present a framework of quality metrics for IT
service, by conducting studies in industry, derived
from ITIL, ISO/IEC 20000 and SERVQUAL. This
framework is later extended through a systematic
review (Lepmets et al., 2012) and (Lepmets et al.,
2013), but no relationship between IT service quality
metrics to services maturity models process areas are
proposed.
3 CASE STUDY
A case study method is an exploratory research
technique used to highlight and explore aspects,
which may guide providing directions for the
question. This methodology is relevant for
information system when researcher can study the
information system in a natural environment,
answering ‘‘how’’ and ‘‘why’’ questions and when
there had been no much previously conducted
formal research. As only one company is being
evaluated in this case study, but many process areas
(multiple units of analysis), this paper represents an
embedded single-case design case study (Recker
ICEIS2015-17thInternationalConferenceonEnterpriseInformationSystems
396
2013).
3.1 Case Study Planning
This case study objective is part of a major research
about validating results of mapping study previous
work in industry, in order to identify and better
understand metrics found in literature.
Our research questions had been originally
defined in a previous work (Trinkenreich et al.,
2015): (i) What metrics are being suggested for IT
service quality improvement projects? (ii) How do
they relate to IT service maturity models processes?
Those questions had been answered in literature by
results of systematic mapping. From the content of
all 16 selected papers, we were able to identify 133
metrics, 80 were about specific IT service maturity
models’ processes. Some found metrics are related
to more than one process area. More details and
discussion can be found in (Trinkenreich et al.,
2015), some metrics related to the case study are
listed in the following subsections.
Research questions that we aim to answer
through this case study are: (iii) What kind of
relationship exist between processes that appear in
derived metrics that include more than one process,
(iv) Which of literature suggested metrics are being
used by organizations?
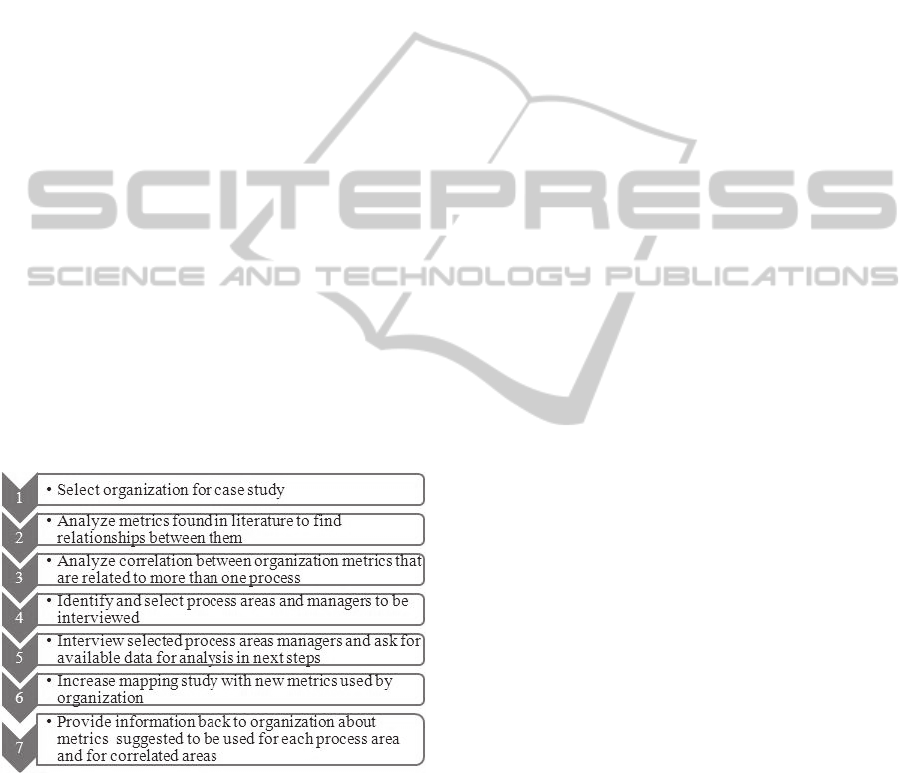
In order to execute case study, we have followed
a set of steps depicted in Figure 1.
Figure 1: Case study stages.
3.2 Case Study Execution
As a first step, we identified an organization to
perform the case study: Organization A is a large
global organization headquartered in Brazil. It
operates in over 30 countries and has offices,
operations, exploration and joint ventures across five
continents. The case study was performed on its IT
services application and infrastructure department.
The IT Services Department provide IT services
for all other departments of the organization
following ITIL library practices [TSO, 2011], but it
is not certified by any software or services maturity
model. Main subareas of IT Services Department are
Infrastructure, Hosting, Applications, Security,
Networking and End User Computing. All subareas
spend lots of effort to perform its services
measurement in order to attend performance
indicators, which had been created from strategic
organizational goals. Performance indicators are
derived in measurable goals that employees of IT
Services Department need to annually reach, and the
monitoring of related actions in course is performed
monthly. Performance indicators are created relating
to different subareas, in order to motivate the work
within and between teams and improve service
quality as a whole. Thus, team members not only
care about their areas processes, but also support
other areas. In addition to project goals and cost
savings, there are also goals related to compliance
incidents and availability of applications considered
critical to business.
The researcher that conducted the study case
works in Hosting subarea of IT Services Department
of Organization A. She is focused on improving
quality of services and, for that, conducts reviews of
capacity, availability, implemented changes, and
opened incidents with outsourcing support teams. IT
Services Department also includes an ITIL Office
subarea, with Service Delivery, Incidents, Problems,
Changes and Service Continuity teams, cross serving
all other subareas already cited here.
Second step was analyzing metrics found in
literature to find relationships between them. During
the mapping study execution, we found many
metrics related to more than one process area, like:
“Incident numbers can grow because of a Data
Center unavailability”, “Unavailability can decrease
because team had found root cause for a recurrent
issue”, “Incident numbers can increase because an
executed change that had failed”. Although we did
not conduct any further investigation at the moment,
we have included in scope of this case study a cross
metrics evaluation and a metric correlation analysis.
In order to answer research question (iii), we
have analyzed all metrics to find out what kind of
relationship can exist between them, checking what
happens to a second metric (if it increases or
decreases) when a first metric value increases. Then,
we could find other process areas about which there
is not a large amount of metrics in literature, but
relates to many other process areas’ metrics (for
MetricstoSupportItServiceMaturityModels-ACaseStudy
397

example Service Continuity and Change
Management). Table 1 shows the metrics with more
influence to others. The third column depicts what
happens to the second metric when the first metric
increases.
Third and fourth steps had been conducted in
parallel. To allow us answering research question
(iv), we had identified areas and respective
managers to be interviewed. Most of identified
metrics in literature were about Service Delivery,
Incidents, Problems, Changes and Continuity.
We have interviewed managers of ITIL Office to
analyze how each of those areas of Organization A
interact with others, as explained in each following
paragraphs and also resumed in Figure 2.
Incident and Service Delivery managers are the
same manager, who is responsible of making sure
that Service Desk (first support level for all IT
Service Department subareas) receives users
requests and process according defined flow,
provides solution using support scripts or, when is
not possible to solve the issue or attend the request,
opening Incident tickets for next levels support.
Problem manager is responsible for tracking all
problems record lifecycle, including problem record
opening, categorization, root cause identification and
closing. It does not include root cause solution
implementation, as it is scope of Change
management, and this is how Problem and Changes
relate with each other.
Change manager is responsible for keeping
configuration database up to date and tracking all
changes in steady state applications, network and
infrastructure. An unsuccessful change can cause
issue in the environment and then users can call
Service Desk and Incidents can be opened. This way
is another relation that can exist between Change
and Incident areas.
Service Continuity manager is responsible for
controlling by opening crisis rooms to return
availability of high critical applications. This team
controls not all applications because high cost
involved. A crisis room is opened in this company
when there is an unavailability of a high impact
application. When a crisis room is opened, all
technical teams connect to a conference room and
get there working together until the issue is solved
and application is back again. This process had been
created to minimize impact to applications
considered critical to business and as faster it can
solve the issue, fewer incidents are opened by users.
This is how Service Continuity and Incident areas
relate with each other. Also, every time a crisis room
is closed, it generated a new problem record to be
opened and this is how Service Continuity and
Problem areas relate with each other.
Managers of the five ITIL Office teams selected
for case study have more than 10 years working at
Organization A, are committed to provide and
improve quality of services to users. They had
highlighted that impacts caused by processes
intersections are unknown and still need to be
measured and controlled, in order to verify if, how
and where can processes be improved. Incident
manager had informed that he can observe some
applications that are running in production for quite
a long time (years, for example), with a high amount
of incidents continuously being opened by users
reporting errors, and also with lots of changes in
Table 1: IT service metrics with more relationships found to other metrics.
First metric Second metric Impact
Service availability
Amount of incidents that caused business impact because of performance
issues; MTBSI – mean time between system incidents; MTBF – mean
time between system failures; Business impact caused by IT service
outages; Number of service interruptions per month, per application, per
configuration item; Duration of service interruptions per month, per
application, per configuration item; Amount of services outages caused by
capacity and availability issues
Decreases
Service availability Number of avoided incidents per day Increases
Percentage of change requests
not tested because of due date
Percentage of successful change requests; Service availability; Number of
avoided incidents per day; MTBSI – mean time between system incidents
Decreases
Percentage of successful
change requests
Mean time between versions; Amount of IT services versions Increases
Percentage of successful
change requests
Amount of incidents caused by change requests; Amount of changes that
had caused incidents and problems; Duration of service interruptions per
month, per application, per configuration item; Service availability
Decreases
Percentage of change requests
not tested because of due date
Amount of incidents caused by change requests; Amount of changes that
had caused incidents and problems; Amount of change requests after a
transition to production (considering a certain period)
Increases
ICEIS2015-17thInternationalConferenceonEnterpriseInformationSystems
398
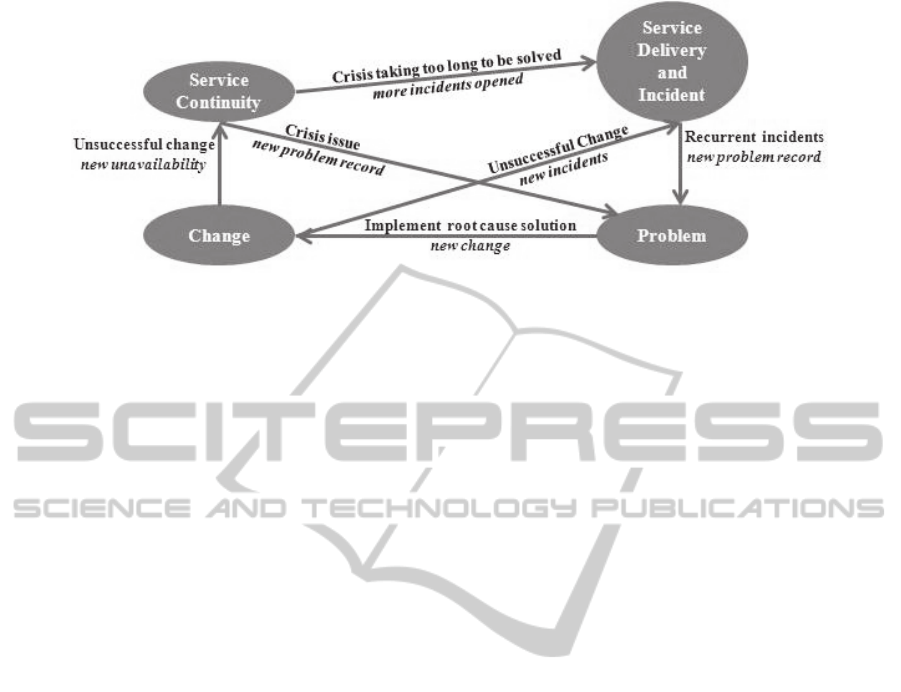
Figure 2: Interrelations between areas selected for case study from Organization A.
code being executed on it. He and the Change
manager are interested in understanding if there is
any cause-effect between Incidents and Changes for
each of those applications, and how can they
measure that. They aim to find if this is happening
because Changes are being executed to release new
functionalities and are causing Incident increase, if
Changes are being executed to fix bugs and are
introducing new errors, if there is any standard of
Incidents variation being related to changes
execution, or not. If there is any kind of standard,
after how much time (one hour, one day, two days, a
week) after implementing a Change that Incidents
start to grow.
Managers had been interested in being
interviewed as they need to always keep improving
measurements and it had showed a good interaction
between academy and industry on this subject.
In order to aggregate information for research
question (iii), we have taken two process areas
metrics that we could find relationship and company
had available data to analyze if a correlation test
could be used to find correlation between them.
Organization A does not document whether each
Incident is caused by a Change. Both Incident and
Change managers said this is a big challenge to
understand how Changes impact Incidents and how
Incidents impact Changes, Therefore, we have
collected data about amount of executed Changes
(deploy of new code solution) and opened Incidents
for 1 year for 9 web applications that are hosted in
the same Microsoft Sharepoint infrastructure.
Aiming to apply descriptive statistical methods,
we have defined a null hypothesis stating that there
is no correlation between executed Changes and
opened Incidents. Like that we are saying that
executed changes do not increase or decrease
amount of opened incidents.
As we aim to reject null hypothesis showing that
it can be a relation between Changes and Incidents
for Microsoft Sharepoint applications. First we
suppose that Changes can impact Incidents, what
means that the execution of Changes deploying new
code solution (either for new functionalities or to fix
reported errors) can cause trouble applications and it
can make users to dial to support and open Incidents.
The objective of that is to propose a way to help
Organization A on finding root cause for having a
large amount of Incidents opened by users for
applications that are hosted on this platform and so
improve service quality. In order to do that, we had
compared values from changes in one period to
incidents in next period, because we suppose that a
Change happens first, and after some time, the
impact occurs and then Incident happens.
So, in order to analyze correlation, we had first
aggregated amounts of Changes and Incidents that
had been occurred for those Microsoft Sharepoint
applications per month (Table 2). In order to select
proper correlation test, we had to first find if
distribution data was normal. As we had 12
observations (months), Shapiro-Wilk test was
applied to confirm that distribution data was normal
(p-values > 0,05) for both Changes (p-value = 0,432)
and Incidents (p-value = 0,793) and so we were able
to use Pearson correlation test to compare incidents
and changes. We had observed that data are not
strongly correlated and we cannot reject null
hypothesis (Pearson r = -0,1200, p = 0,71).
Then we had aggregated amounts of Changes
and Incidents per week, instead of month, in order to
get more granular data (Table 3). As the amount of
observations was larger now, with 53 weeks, we had
applied Kolmogorov-Smirnov test to confirm that
distribution data was still normal (p-values > 0,05)
for both Changes (p-value = 0,261) and Incidents (p-
value = 0,614) and so again we could use Pearson
correlation test to compare incidents and changes.
Again, we had observed again that data are not
strongly correlated and we cannot reject null
hypothesis (Pearson r = -0,078, p = 0,57).
MetricstoSupportItServiceMaturityModels-ACaseStudy
399

Distribution data for Changes was not normal (p-
value < 0,05) distribution data for Incidents was
normal (p-value > 0,05), but very close to this limit.
We have selected Spearman correlation test, because
it can also be applied to distribution data that is not
normal. Once more, we had also observed that data
are not strongly correlated and we still cannot reject
null hypothesis (Spearman = -0,0741).
We could not find correlation between Changes
and Incidents when considering total applications,
but managers had informed that they still can notice
errors and cases of unavailability after some changes
that need to be further investigated.
Fifth, still related to answer research question
(iv), we have interviewed managers of five IT
service process areas (Incident, Problem, Service
Delivery, Change and Service Continuity), asking
what metrics do they use today and if they wish to
get some other results by measurement that is not
being done yet.
Incident manager had informed that taken
measurements are “First Call Resolution”, “Incident
Resolution on Time”, “Incidents - Backlog per
Vendor and Support Group, per Status, per Aging
and per Priority” and “Incidents Closed on Target,
Total Closed and % on Target per Vendor and
Support Group”.
Service delivery manager had explained that in
order to count to the SLA result, the incident should
be in the Closed status. All measurements start when
incident is assigned to a Support Group. There are
two sets of SLA: TTO (Time To Own, the same as
response time) and TTR (Time To Resolve). Some
vendors don´t have contract for TTO, but even like
that the company measures them either. For TTO, it
stops the calculation when incident status goes to In
Progress or Resolved. If an incident status is directly
changed from Assigned to Pending, the clock does
not stop. TTO is calculated only one time per
incident and per vendor. If the incident is
reassigned/reopened to the same service target, it
does not start measuring again. For TTR, it stops the
clock only in Resolved status. The clock pauses in
Pending status, independent of the reason used for
being on this status. For service targets where the
clock runs only in business days and in a limited
time, both TTO and TTR calculate only in the
defined working hours.
Problem manager had informed that taken
measurements are “Amount of problems with
missed root cause due date”, “Amount of problems
that had inconclusive root cause”, “Amount of open
problems for high impact applications” and “MTBP
- Mean Time Between Problems”.
Service Continuity manager had informed that
taken measurements are “Application Availability”,
“Application Performance”, “Application User
Experience” (which is a derived metric 35% *
System Performance + 65% * System Availability),
“TTE - Time to Escalate an Incident to Crisis”,
“Amount Time in Crisis” and “MTBC - Mean Time
Between Crisis”. “Application Availability” is
automatically collected by a monitoring platform
with machines installed in each location of the
company, simulating an user access to application.
“Amount Time in Crisis” and “MTBC - Mean Time
Between Crisis” are calculated using crisis reports,
that have start and end information.
Change manager informed that uses those
measures: “Rate of denied x approved changes”,
“Rate of successful x unsuccessful executed
changes”, “Mean Time Between Corrective
Changes”, “Amount of Emergency changes”.
Sixth, we were able to answer research question
Table 2: Amount of opened incidents reporting applications errors and executed code changes per month.
Months Ago
2013
Sep
2013
Oct
2013
Nov
2013
Dec
2013
Jan
2014
Feb
2014
Mar
2014
Apr
2014
May
2014
Jun
2014
Jul
2014
Aug
2014
Changes 9 8 9 3 9 6 7 13 10 7 8 9 -
Incidents - 189 171 143 160 162 149 110 136 90 100 101 127
Table 3: Amount of opened incidents reporting applications errors and executed code changes per week.
Weeks 1 2 3 4 5 6 7 8 9 10 11 12 13 14 15 16 17 18 19
Changes 4 4 6 6 5 3 1 4 2 1 0 2 0 1 2 6 3 0 1
Incidents 62 48 37 45 41 44 30 27 45 27 32 41 39 68 59 24 9 10 26
Weeks 20 21 22 23 24 25 26 27 28 29 30 31 32 33 34 35 36 37 38
Changes 2 2 0 1 2 2 3 4 5 3 3 1 1 8 5 2 4 1 4
Incidents 46 46 34 24 44 49 33 10 33 42 21 18 28 52 30 9 25 24 19
Weeks 39 40 41 42 43 44 45 46 47 48 49 50 51 21 53 - - - -
Changes 0 6 5 5 8 9 8 3 5 2 5 7 4 3 5 - - - -
Incidents 21 30 20 24 22 26 24 19 23 17 16 21 34 50 2 - - - -
ICEIS2015-17thInternationalConferenceonEnterpriseInformationSystems
400

(iv) in the context of this case study. We had
increased the mapping study metrics list with new
metrics informed by this company and marked those
ones that were returned by literature and are really
used. Organization A uses 19 metrics for IT
services, as we can see in Table 4. First column lists
the metric found in the case study, the second
column indicates whether it was also found in the
mapping study results, while last two columns
indicate CMMI-SVC and MPS-SV related
processes. Most of them (68%) had been found in
literature and only one metric used by Organization
A correlates different process areas (“TTE - Time to
Escalate an Incident to Crisis” which is about
Incident and Service Continuity areas).
Finally, as the seventh step, we had returned to
interviewed managers with suggestion of new
metrics they could use for each process area and for
intersections between areas (obtained by systematic
mapping and categorization by process areas that we
had previously done (Trinkenreich et al., 2015)), in
Table 4: Metrics used by Case Study organization.
Metric used in Industry
Litera
ture?
CMMI
-SVC
MPS-
SV
First Call Resolution Yes IRP GIN
Incident Resolution on Time Yes IRP GIN
Incidents - Backlog per Vendor
and Support Group
Yes
IRP GIN
Incidents - Backlog per Status, per
Aging and per Priority
Yes
IRP GIN
Total and % Incidents Closed on
Target per Vendor and Support
Group
Yes
IRP GIN
Amount of problems with missed
root cause due date
Yes
IRP GPL
Amount of problems that had
inconclusive root cause
Yes
IRP GPL
Amount of open problems for high
impact applications
Yes
IRP GPL
MTBP - Mean Time Between
Problems
No
IRP GPL
Application Availability Yes GCD SCON
Application Performance No GCD SCON
Application User Experience No GCD SCON
TTE - Time to Escalate an Incident
to Crisis
Yes
GCD/
GIN
SCON
/GIN
Amount Time in Crisis No GCD SCON
MTBC - Mean Time Between
Crisis
No
GCD SCON
Rate of denied x approved changes Yes CM GMU
Rate of successful x unsuccessful
executed changes
Yes
CM GMU
MTBCC - Mean Time Between
Corrective Changes
No
CM GMU
Amount of Emergency changes Yes CM GMU
order to help them on selection of new metrics to
improve management and control of IT services
Department quality and attend business goals.
Interviewed managers had analyzed the list of
metrics we have retrieved from literature through
systematic mapping and reported interesting on start
using some of them. We had also suggested
managers to start using metrics to correlate more
than one process area. Metrics that we had found in
literature to attend process area intersections
(already discussed in Figure 2) were “Amount of
incidents caused by changes” and ´
Rate of problem
increase comparing to incidents”.
Besides those suggestions retrieved from
literature, there are intersections that we had not
found correlated metrics in literature. For those, we
have discussed and agreed, based on analysis of goal
question metrics, about some new metrics creation
together with interviewed managers: “Amount of
problems that had root cause related to failed
changes”, “Rate of crisis occurred with root cause X
root cause unknown”, “Amount of incidents for
issues during crisis” and “Amount of crisis caused
by changes”. Table 5 presents all metrics that
Organization A managers had reported that plan to
start using as a result of this case study.
Incident manager had informed that he needs to
adjust the process of tickets fulfillment by Service
Desk in order to get information and generate data
for further measurements. For example, to measure
“Amount of incidents caused by issues about growth
rate”, a root cause analysis needs to be done and
filled in the incident record in order to get incidents
caused by growth rate. Today, technical teams solve
the incident without imputing data about root cause.
Another example that needs information to be
carefully filled in incidents is for metric used in
Correlation test “Amount of changes that had caused
incidents”. If root cause (in this case, the change
record number) is not filled for each incident, it is
not possible to get a proper list of changes that had
caused incidents to be opened after executed.
Therefore, besides this lesson learned about the
importance of designing processes focused on data
generation and collection for measurements, we
could get other lessons from this case study either.
Measurement process area of service maturity
models can be used by organizations which main
business is not IT, in order to help them on meeting
performance indicators. Also we have seen that
metrics that correlate more than one process area can
support finding impacts that one can cause in other
which could not be seen with metrics for only single
areas, and with this information, organizations can
MetricstoSupportItServiceMaturityModels-ACaseStudy
401

work on process improvements and prepare
themselves to mitigate risks about those impacts.
Another interesting point that authors had realized is
that performance indicators that correlate more than
one area can encourage people between different
teams to work together. For example, “TTE - Time
to Escalate an Incident to Crisis”. For this number to
decrease, both Incident and Service Continuity
teams must work together in a process of teamwork.
4 FINAL CONSIDERATIONS
This paper had presented a case study that aimed to
identify adequate metrics to be used by
organizations deploying IT service maturity models,
whether there as correlation between metrics that are
related to more than one process, and how are IT
service metrics being used in a real organization.
Mapping study had returned several metrics
relating more than one process area, showing some
kind of influence between them. Changes and new
releases that cause incidents are examples of
correlation and intrinsic cause-effect relationships
between Change, Release and Incident areas.
Increase and decrease analysis is a first step to study
cause-effect between metrics, and Pearson and
Spearman correlation tests can be used for a deeper
investigation to understand how long after an event
one metric can affect another. We have
demonstrated an example about Changes and
Incidents. A Change can influence Incidents after
hours, days or other periods. Also, we had found that
is necessary to have granular and detailed data in
order to select proper grouping for correlation tests.
If an organization can realize the importance of
measurements to control and improve the quality of
its services, it needs to design its processes thinking
about how processes will generate data to be
collected for measurements, always doing cost
balancing and being aligned with business needs.
Even not having IT as its main business, an
organization that measures provided IT services and
has documented performance indicators to meet,
avoid having the IT Services Department being
undervalued by internal or external clients, and also
justifies investments on it. Maturity models practices
and goals can help as evolutionary way to
implement Measurement, even if the organization is
not interested on being certified on them.
Selecting metrics to control quality of IT service
is not easy. Metrics need to be useful to justify
measurement costs, need to be aligned with business
goals, and can permeate different areas with
different processes and people. This can seem more
difficult to manage, but results can show increase of
teamwork and deeper understanding of relationships
between different process areas, that can find and
remove possible bottlenecks that would not be
known with only the use of single areas metrics.
As future work, we plan to extend case study for
other organizations, detail how to collect and
analyse IT service metrics, investigate correlations
between areas to have a deeper understanding about
how one process impact another, and provide a
method to create cross related metrics.
ACKNOWLEDGEMENTS
Authors would like to thank the financial support
granted by FAPERJ (project E-26/110.438/2014).
REFERENCES
Forrester, E., Buteau, B., Shrum, S., 2010. CMMI For
Services, Guidelines for Superior Service. CMMI-
SVC Version 1.3, - 2nd Edition. SEI. Addison-Wesley
Professional.
Information Systems Audit, et al., 2012. COBIT Five: A
Business Framework for the Governance and
Management of Enterprise IT. USA.
ISO/IEC, 2011. ISO/IEC 20.000-1: Information
Technology – Service Management – Part 1: Service
management system requirements. International
Standard Organization/International Electrotechnical
Commission, Switzerland.
Kalinowski, M.,Weber, K. C., Franco, N., Barroso, E.,
Duarte, V., Zanetti, D., Santos, G., 2014. Results of 10
Years of Software Process Improvement in Brazil
Based on the MPS-SW Model. 9th Int. Conf. on the
Quality in Information and Communications
Technology (QUATIC), Guimarães, Portugal, 2014.
Lepmets, M., Cater-Steel, A., Gacenga, F., Ras, E., 2012.
“Extending the IT Service Quality Measurement
Framework through a Systematic Literature Review”,
SRII Global Conference.
Lepmets, M., Mesquida, A., Cater-Steel, A., Mas, A., Ras,
E., 2013. “The Evaluation of the IT Service Quality
Measurement Framework in Industry“, Global Journal
of Flexible Systems Management - Volume 15.
Lepmets, M., Ras, E., Renault, A., 2011. “A Quality
Measurement Framework for IT Services”, SRII
Global Conference.
Niessink, F., Clerc, V., Tijdink, T., Vliet, H., 2005 - The
IT Service Capability Maturity Model - IT Service
CMM, version 1.0RC1.
Parasuraman, A. Zeithaml, L. Berry, 1985. .A conceptual
model of service quality and its implications for future
research. Journal of Marketing, vol. 49, pp. 41-50.
ICEIS2015-17thInternationalConferenceonEnterpriseInformationSystems
402

Recker, J., 2013. “Scientific Research in Information
Systems - A Beginner’s Guide”. Springer, ISBN 978-
3-642-30048-6.
Santos, G. Weber, K. C. Rocha, A., 2009. Software
Process Improvement in Brazil: Evolving the MPS
Model and Consolidating the MPS.BR Program.
XXXV Conferência Latinoamericana de Informática –
CLEI 2009, Pelotas, Brasil.
Softex, 2012a. MPS.BR – Guia Geral MPS de Serviços (in
Portuguese and Spanish). Available at www.softex.br.
Softex, 2012b. MPS.BR – Guia Geral MPS de Software
(in Portuguese and Spanish). Available at
www.softex.br.
Trinkenreich, B., Santos, G., Barcellos, M., 2015 “Metrics
to Support IT Service Maturity Models – A Systematic
Mapping Study”, 17th International Conference on
Enterprise Information Systems (ICEIS), Barcelona,
Spain.
TSO (The Stationery Office), 2011. An Introductory
Overview of ITIL. available http://www.tsoshop.co.uk.
Wohlin, C., Runeson, P., Höst, M., Regnell, B., Wesslén,
2012. Experimentation in Software Engineering,
Springer, ISBN: 978-3642290435.
MetricstoSupportItServiceMaturityModels-ACaseStudy
403
