
3D Seismic Waveform Classification Study based on High-level
Semantic Feature
Xiaohan Du
1
, Feng Qian
2
and Xiangqin Ou
2
1
School of Information and Communication Engineering, Beijing University of Posts and Telecommunications,
100876 Beijing, China
2
School of Information and Communication Engineering, University of Electronic Science and Technology of China,
610000 Chengdu, China
67557822@qq.com
Keywords: Seismic, Waveform Classification, High-level Semantic Extraction, LDA.
Abstract: With the improvement of Natural energy exploration technologies, the Seismic interpretation member need
to deal with more and more information and parameters. How to better use seismic characteristic parameter
to detect hydrocarbon becomes increasingly complex. In this article, we deeply studied the seismic
waveform classification, and propose a seismic waveform classification method based combine various
characters. After reducing the dimensions of seismic wave, we classify it using the high-level semantic
feature extraction technique in pattern recognition. Experiments proved that, the classification result
improved in continuity and details, and reduced the redundancy of seismic signal, increased performance of
classification.
1 INTRODUCTION
With social improvement, natural energy exploration
becomes more and more important. But the general
oil and gas reservoir has been exhausted almost. The
need of exploration to unconventional hydrocarbon
and seismic become more and more important. So
the seismic waveform classification gets a fast
development and become an important part of the
impact energy exploration.
In the seismic exploration, the purpose of the
seismic data interpretation is to extract more
information from the seismic data so we can explain
the underground structure and describe the stratum
and lithological character. The most effective method
is extract and analysis seismic character and the
waveform classification. But because of the complex
of the formation environment the wave classification
for 3D seismic signal is quite difficult.
There are some realize solutions for seismic
signal wave classification. During the initial stage of
seismic facies analysis, Mathieu and Rice first
proposed the discriminant factor method to explain
the variety of geological lithology, and opened the
application of the waveform classification. (Mathieu
and Rice. 1969).
In 1988, Dumay and Fournier
combined this method and principal component
analysis (PCA) and applied in seismic data
classification, received certain analysis effect.
(Dumay and Fournier 1988) Then in 1991, Yang and
Huang used hybrid neural network for detection of
the seismic signal pattern. (Yang and Huang, 1991).
Brain P. West et proposed interactive seismic facies
analysis method used texture and neural network in
3D seismic image in 2002. They processed some
practical seismic data and generated an elaborate 3D
seismic facies, provided effective analysis data for
seismic interpreters. (West and May. 2002). Saggaf
M et proposed competitive neural network seismic
facies recognition methods for seismic reflection
point in 2003. (Saggaf et al., 2003).Then
self-organizing map (SOM, Kohonen, 2001) become
the most important tools in unsupervised
classification of seismic facies.
With the continuous development of pattern
recognition, statistical model is implied in the
seismic signal classification. In 2009, Ivan Dimitri
test and compared the common unsupervised
classification methods in seismic analysis. He
divided the classification method into four types:
partition model, probability model, hierarchy model
and soft competitive model. In probability model the
main method is use expectation maximization (EM)
algorithm to estimate Gaussian distribution
29
Du X., Qian F. and Ou X..
3D Seismic Waveform Classification Study based on High-level Semantic Feature.
DOI: 10.5220/0005402600290033
In Proceedings of the 1st International Conference on Geographical Information Systems Theory, Applications and Management (GISTAM-2015), pages
29-33
ISBN: 978-989-758-099-4
Copyright
c
2015 SCITEPRESS (Science and Technology Publications, Lda.)

parameters (Iván, 2009a; 2009b). In 2013, Atish Roy
introduced unsupervised classification based on
statistic model, and generated topology mapping
GTM for application in 3D seismic facies analysis.
This method offsets SOM lack of proper
convergence criterion and parameter selection rules.
(Atish Roy. 2013).
In sum, there are two types’ methods in seismic
signal classification, one is the unsupervised
classification, and the other is supervised
classification:
1) Unsupervised classification such as SOM needs
good initialization conditions.
2) Supervised classification such as SVM need very
good labeled sample and used a lot of memory.
Above mentioned technology have been applied in
seismic data analysis, but there also exist many
defects. The main defect is that algorithm is too
complicate, time consuming and requires very large
memory. Also need very good initialization
conditions. These defects influence the practical
application of these methods.
In the image pattern recognition system, feature
extraction based on high-level semantic use different
types of feature for semantic clustering. Every
semantic cluster contains various underlying
characters such as color, shape etc. Finally form the
top-down image semantic hierarchy clustering
structure. This greatly reduced the complexity of the
algorithm, saved the system resources. Inspired by
this, we proposed high-level feature extraction on
seismic waveform classification. First, we extract
seismic amplitude character, then use the bag of
words model reduce the data dimension. In details,
we consider every seismic data as a document, and
put its character as words, reduce its dimension by
extract its theme, thus extract the feature of seismic
image. Experimental results show that applied the
bag of words to seismic pattern recognition can
obtain good experiment result.
2 PRINCIPLE OF HIGH-LEVEL
SEMANTIC EXTRACTION
For a specific goal, in addition to containing
low-level visual knowledge such as color, shape and
texture, also contain semantic knowledge for human
visual perception. In seismic image processing, this
semantic knowledge is what we called class model.
And how extract this knowledge is an important
issue. According to the current study, the extraction
of image semantic feature generally learns from the
model structure of the text semantic analysis. First,
on the granularity of semantic expression, bag of
words (Li and Perona, 2005) model is a more
common method. This algorithm first define
semantic of different image tiles, describe it as visual
words, then use these visual words to express
different ontology of image, and realize the semantic
study. Secondly, about the extraction of semantic, the
typical models are probabilistic latent semantic
analysis (PLSA) and latent Dirichlet allocation
(LDA). (Blei et al., 2003). According to these
models, there are some research results successfully
used in automatic image annotation and retrieval.
Taken together, the extraction of semantic is mainly
base on machine learning, data mining and relevance
feedback.
2.1 Topic Model on BOW
Bag of words initially originated in text processing.
For a text, suppose we can ignore its word order,
grammar and syntax, only consider it as a word set,
or a word group. And each word is independent, not
depend on the other word. So we can select a word
in anywhere and not influenced by the previous
sentence.
For 3d seismic data waveform, we can consider it
consists of some classification model, and every
class model consists of some waveform character.
That is we think each waveform character in 3d
seismic data volume select a class model with certain
probability. So if we want generate a 3d seismic data
volume, the probability for each waveform character
in it is
p
|
|
|
(1)
So if given a series of 3d seismic data volume,
though training data volume-character, we can study
each feature’s probability in every class model and
each class model’s probability in every 3d seismic
data volume.
When it is implemented, we adopt the Latent
Dirichlet Allocation (LDA) to realize the generation
model of the 3d seismic data volume.
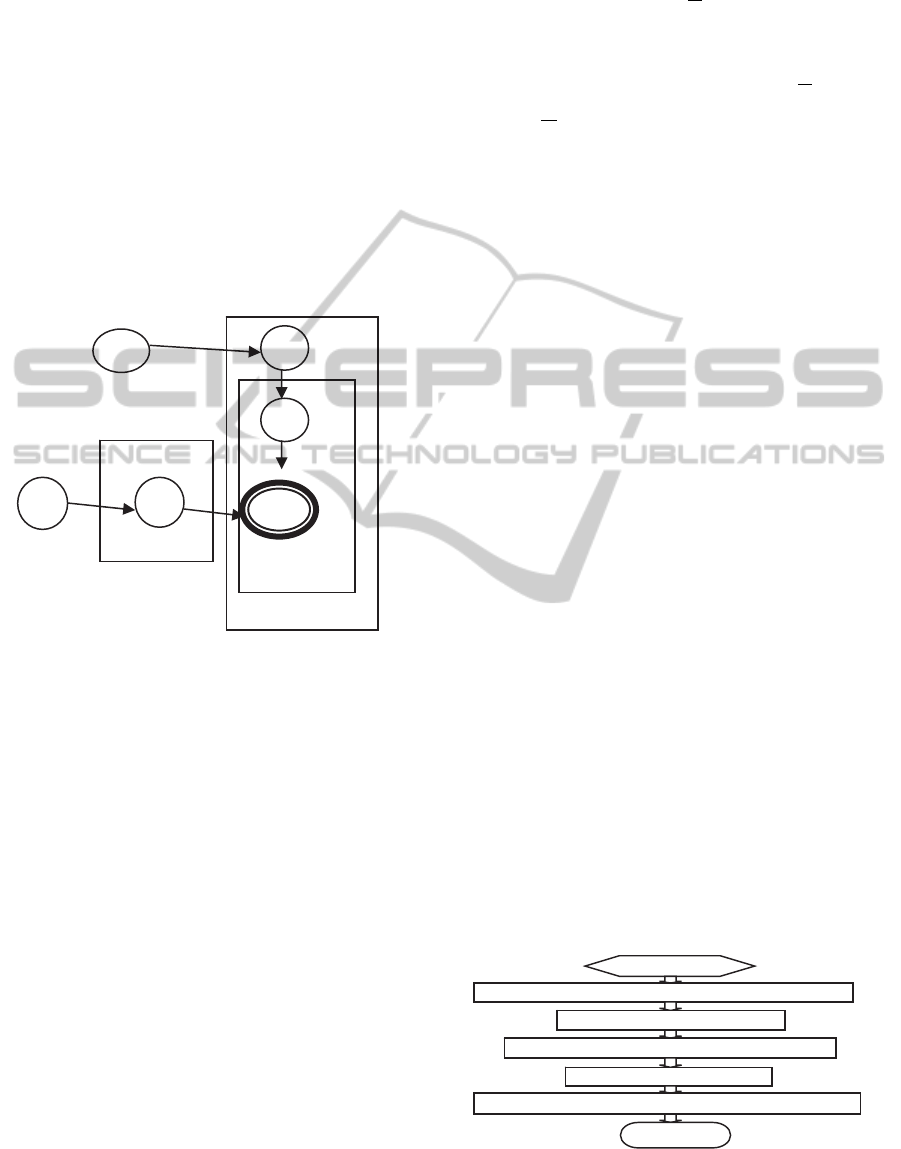
We can use graph model to describe the topic
model. As shown in figure 1.
LDA first proposed by Blei and David M. etc. in
2003. (Blei et al., 2003). At present in the text
mining including text theme identify, text
classification and text similarity computing have
been widely applied. It is a topic model, and the
GISTAM2015-1stInternationalConferenceonGeographicalInformationSystemsTheory,ApplicationsandManagement
30
theme of each document can be given in the form of
probability distribution. At the same time it is an
unsupervised learning algorithm, does not require
manual annotation of the training set in the training
step, and only need the text set and its topics number
K. In addition, another advantage of LDA is that for
each topic, we can find some words to describe it.
LDA is a typical bag of words model, when
applied in 3d seismic data waveform classification,
we consider each 3d seismic data as a set of
waveform character set, and there is no order in the
features. One 3d seismic data volume contains many
channel data. We consider every channel data as a
class model, and every wave feature in data volume
were generated by one of the class model.
Figure 1: LDA topic model.
So, we can understand the generation model in
figure 2, suppose we have M seismic image, K
channel seismic wave are involved, the feature
distribution of each channel waveform is a
multinomial distribution sample from a prior
distribution who’s parameter is β. For each seismic
image, we first sample a value from a Poisson
distribution as the length of the image features, then
sample a multinomial distribution from a prior
distribution whose parameter is α as the probability
of each waveform feature. For the n character of a
seismic image, we can first sample a class model
from the multinomial distribution of its waveform,
and then sample a character from the multinomial
distribution of this class model.
When give a 3d seismic data, ω
,
is the known
variables that can be seen, α
and β
is the prior
parameters given according to the experience, and
the other variable z
,
, θ
and φ
is unknown
and hidden, and also need we study and estimate
according to the observed variables. On the basis of
the graph model of LDA, we can write out the joint
distribution of all variables:
pw
,z
θ
Φ
pw
,
φ
,
pz
,
θ
∙p
θ
α
∙p
Φ
β
(2)
In which, Φ
φ
While the probability distribution of W is
p
W
|
α,β
p
θ
|
α
p
w
|
θ,φ
d
θ
(3)
3 TECHNICAL SOLUTION
In the oil and gas exploration field, we have to
facing the problem of complex surface and complex
geological structure. In these areas, seismic
wave-field is complex, geological structure change
dramatically. This made it difficult to identify weak
signal and clear the noises and improve the signal to
noise ratio of seismic data. In older oilfields, the old
petroleum reservoirs that easy to find is on the
decrease. Instead, the hidden and special reservoirs
that mainly lithological strata common technology
hard to find is arise. It is difficult to make any
breakthrough if we use the conventional exploration
method. In order to further describe the old
petroleum and find new. It needs the more accurate
exploration technology. The seismic signal analysis
methods and techniques is an important way. In this
text, we use the LDA topic model based on the
subject distribution. Use the EM algorithm to
optimize the parameters and clustering. Without a
single intervention, we realized 3d seismic signal
classification.
It is relatively complex processes that classify
waveform based on 3d data, and existing waveform
classification method is greatly varied. But the basic
steps is introduced in figure 2, among this the main
steps are data preprocessing, feature extraction and
select, and classifying label.
Figure 2: The basic flow of waveform classification
method.
Start
In
p
ut seismic ima
g
e and la
y
er data
Data
p
re
p
rocessin
g
Feature extraction and select
Classif
y
in
g
label
Create classification phase diagram
En
d
k∈
1,
K
α
m∈
1,M
θ
n∈
1,N
z
,
w
,
β
φ
3DSeismicWaveformClassificationStudybasedonHigh-levelSemanticFeature
31

This article focuses on how to realize the
classification label and generate the classification
phase diagram.
For the initial seismic data, first, we first do 10
orders Chebyshev polynomial fitting for each
seismic data. Then we get 10 multinomial factors c1,
c2 ……c10. We use these ten factors to represent
one seismic data. So we can get a 3D data volume
with polynomial factor. Suppose the whole 3D
seismic data generated from K class models, one
seismic data generated from certain model of these,
and these class models obey the multinomial
distribution of parameter θ. Each class model
corresponds to a multinomial distribution of V
seismic data. If we useφlabel this distribution, LDA
defines following generation process:
For each seismic data, select a class model from
the theme distribution.
Choose a character from above-mentioned topics.
Repeat above process until traverse all features of
the seismic wave.
That is to say, for each feature of any seismic wave
D, we select a topic Z from the multinomial
distribution corresponds to that wave, then choose a
character W from the multinomial distribution φ
corresponds to the topic Z, repeat this process N
times, generates the seismic wave D.
The system framework is shown in figure 3.
The study details: regard each seismic wave as a
text, utilize Chebyshev polynomial fitting, we can
get 50 multinomial factors. This factor is the
characters that we will study. So the 50 characters in
each channel can be seen as 50 words, if one text
denotes one channel seismic data, then one word
indicate one character, so we can use the
classification model for text to the classification in
seismic data.
4 EXPERIMENTAL RESULT
As shown in figure 4 is the f3 post-stack
seismic signal in the Dutch North Sea oil. The data
collected in 1987 and released to researchers. F3
data is the commonly used sample data in
seismological fields, and can be downloaded original
data. The purpose of collect this data is to find the oil
and gas between Jurassic strata and Cretaceous laver.
The researchers finally sure find oil and gas storage
in this field.
We estimate parameters of F3 post-stack
seismic signal named MSF4D using a
semi-supervised EM algorithms. (Note: Because the
subsurface structures most layered overlay, layer can
be simply understand as 2d slice along a stratum.
Figure 5 is a MSF4D layer; its size is 593*943).
Take 33 sampling points who’s range is [-8,
+24] mms to study. That is we take out a 3d stratum
that have 593*943 samples and each sample have 33
sampling points.
Figure 3: System framework of 3D seismic data
classification.
Yes
Calculate each channel data’s
probability
Update θand Φ according to
expectation maximum
Iteration
termination
condition
N
o
LDA terminal model
Classification representation
Yes
Original 3D
seismic data
Extract two
la
y
ers data
Extract time
interval window
Cubic spline
interpolation
3d seismic data
Chebyshev polynomial
fitting
Design the terminating
condition
Initialize LDA parameter
θand Φ
N
o
GISTAM2015-1stInternationalConferenceonGeographicalInformationSystemsTheory,ApplicationsandManagement
32
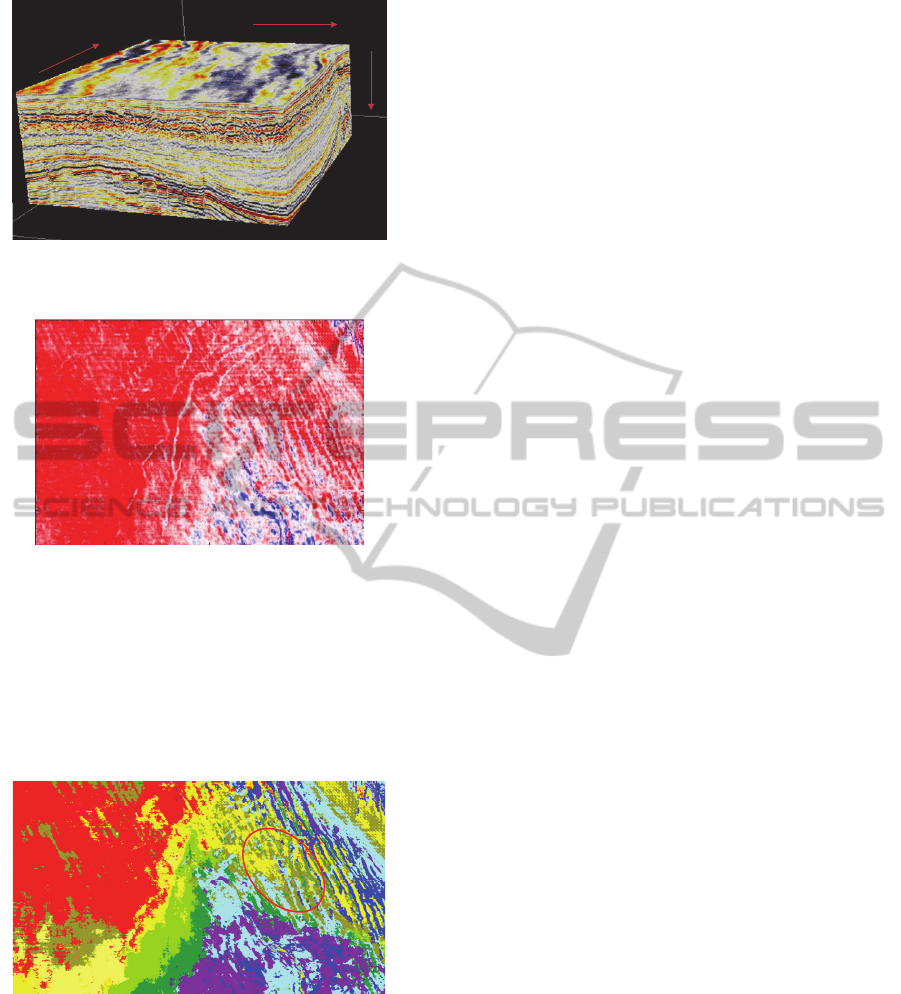
Figure 4: The Overview of Post-Stack Seismic Signal in
Dutch North Sea Oil.
Figure 5: The MSF4D layer figure of seismic signal.
Experiments show, when we use bag of words
model to reduce character’s dimension. We get a
satisfactory classification results. As shown in figure
6, the result natural and continuous and blocking,
and also digging the local detailed stratigraphic
information. So the effect of the algorithm is
obvious.
Figure 6: Classification result.
5 CONCLUSIONS
This method can get classification result in short
time. Computer memory that needed is small. The
classification result continuous and natural into
pieces, and have dig the local detailed stratigraphic
information. So the effect of the algorithm is
obvious.
REFERENCES
Fei-Fei Li; Perona,P (2005)."A Bayesian Hierarchical
Model for Learning Natural Scene Categories". 2005
IEEE Computer Society Conference on Computer
Vision and Pattern Recognition.
Thomas Hofmann (1999)."Probabilistic Latent Semantic
Analysis". Uncertainty in Artificial Intelligence.
Blei, D. M. et al. 2003." Latent Dirichlet Allocation".
Journal of Machine Learning Research. 3, 4-5,
993-1022.
Gregor Heinrich."Parameter estimation for text analysis"
Technical Note vsonix GmbH + University of
Leipzig, Germany.
Jan.2003. Latent Dirichlet allocation. Journal of Machine
Learning Research, 3:993-1022, http://www.cs.berkeley.
edu/-blei/papers/blei03a.ps.gz.
M. Steyvers & T. Griffiths. (2007).Latent Semantic
Analysis: A Road to Meaning, chap. Probabilistic
topic models. Laurence Erlbaum.
Y. Teh, M. Jordan, M. Beal & D.Blei. (2006). Hierarchical
Dirichlet processes. Journal of the American
Statistical Association.
M. Abramowitz and l. A. Stegun, eds. (1972) Handbook of
Mathematical Functions with Formulas, Graphs, and
Mathematical Tables, Chapter 22. New York: Dover.
P. G. Mathieu and G. W. Rice. (1969). Multivariate
analysis used in the detection of stratigraphic
anomalies from seismic data [J]. Geophysics, 34,
507–515.
J. Dumay and F. Fournier. (1988). Multivariate statistical
analyses applied to seismic facies recognition [J].
Geophysics, 53, 1151–1159.
F. M. Yang and K. Y. Huang, (1991). Multi-layer
perception for the detection of seismic anomalies[C].
61stAnnual International Meeting, SEG, Expanded
Abstracts, 309–312.
B. West, S. May, et al. (2002). Interactive seismic facies
classification using textural and neural networks [J].
The Leading Edge, 21, 1042–1049.
M. Saggaf, M. Toksöz, and M. Marhoon. (2003). Seismic
facies classification and identification by competitive
neural networks [J]. Geophysics, 68(6), 1984–1999.
D. M. Iván, B. Jean-Jules and Bruce S. Hart. (2009). A
visual data-mining methodology for seismic-facies
analysis: Part1-Testing and comparison with other
unsupervised clustering methods [J]. Geophysics,
74(1): 1-11.
D. M. Iván, B. Jean-Jules and Bruce S. Hart. (2009). A
visual data-mining methodology for seismic-facies
analysis: Part2-Application to 3D seismic data [J].
Geophysics, 74(1): 13-23.
Atish Roy, (2013). Latent Space Classification of Seismic
Facies[D], Oklahoma : University of Oklahoma.
inline
c
r
o
s
s
l
i
n
e
t
i
m
e
3DSeismicWaveformClassificationStudybasedonHigh-levelSemanticFeature
33
