
Identifying Users with Atypical Preferences to Anticipate Inaccurate
Recommendations
Benjamin Gras, Armelle Brun and Anne Boyer
Universit
´
e de Lorraine, LORIA - Campus Scientifique, 54506 Vandœuvre l
`
es Nancy, France
Keywords:
Atypical Preferences, Atypical Users, Recommender Systems, Collaborative Filtering, Accuracy of Recom-
mendations.
Abstract:
The social approach in recommender systems relies on the hypothesis that users’ preferences are coherent
between users. To recommend a user some items, it uses the preferences of other users, who have preferences
similar to those of this user. Although this approach has shown to produce on average high quality recom-
mendations, which makes it the most commonly used approach, some users are not satisfied. Being able to
anticipate if a recommender will provide a given user with inaccurate recommendations, would be a major
advantage. Nevertheless, little attention has been paid in the literature to studying this particular point. In this
work, we assume that a part of the users who are not satisfied do not respect the assumption made by the so-
cial approach of recommendation: their preferences are not coherent with those of others; they have atypical
preferences. We propose measures to identify these users, upstream of the recommendation process, based
on their profile only (their preferences). The experiments conducted on a state of the art corpus show that
these measures allow to identify reliably a subset of users with atypical preferences, who will get inaccurate
recommendations.
1 INTRODUCTION
The continuous increase of the amount of data avail-
able on the Internet makes the task of accessing tar-
geted information more and more complex for users.
This is the reason why many services now offer
to assist users during their search, by selecting for
them the most relevant information or data. Several
types of such services are proposed, among which
recommender systems (RS) (Goldberg et al., 1992).
Through a recommendation process, a RS aims to
guide users towards resources relevant for them. A
resource can be a book, a movie, a web page, etc.
To make such a recommendation possible, the system
uses the knowledge it has collected about the active
user, (the user the system aims to provide with rec-
ommendations).
RS have been studied for more than twenty years
(Goldberg et al., 1992). The two most common ap-
proaches are content-based filtering (Bobadilla et al.,
2013) and collaborative filtering (CF) (Resnick et al.,
1994; Su and Khoshgoftaar, 2009). Content-based fil-
tering exploits the content of the resources (as well as
index, keywords, title, type of the resource, etc.) to
select those that match the active user’s preferences.
Conversely, CF (also referred to as social filtering)
does not require the exploitation of the content of the
resources. It relies on the assumption that users’ pref-
erences are consistent among users, which allows to
infer the active user’s preferences from those of other
users. In both approaches, users’ preferences are gen-
erally represented by ratings on resources. As CF is
the most popular approach, it will be the focus of this
work.
Providing users with high quality recommenda-
tions is of the highest importance. In the context
of e-commerce it increases customer retention, in e-
learning it improves learners’ learning process, etc.
The quality of the recommendations provided by CF
is on average considered as acceptable (Castagnos
et al., 2013). However, some users do not receive
accurate recommendations, which results in serious
consequences: unsatisfied users, user attrition, failure
among learners, etc.
We think it is essential that a recommender can
anticipate, upstream of the recommandation process,
which users it will provide with inaccurate recom-
mendations. Once these users are identified, the sys-
tem can decide to not provide them with recommen-
dations, or use another approach. The literature has
381
Gras B., Brun A. and Boyer A..
Identifying Users with Atypical Preferences to Anticipate Inaccurate Recommendations.
DOI: 10.5220/0005412703810389
In Proceedings of the 11th International Conference on Web Information Systems and Technologies (WEBIST-2015), pages 381-389
ISBN: 978-989-758-106-9
Copyright
c
2015 SCITEPRESS (Science and Technology Publications, Lda.)

shown that one reason why some users are not sat-
isfied is the small number of preferences the system
collected about them. This problem is referred to as
the cold start problem (Schein et al., 2001). How-
ever, some users with a significant number of prefer-
ences still get inaccurate recommendations. Inaccu-
rate recommendations can also be explained by the
quality of the preferences collected about these users
(Grcar et al., 2005) or by the inconsistency of users
when expressing their preferences (Ekstrand, 2014).
Recent works have noticed that some users tend to
rate resources differently than others (Del Prete and
Capra, 2010). Remind that collaborative filtering as-
sumes that preferences (ratings) are consistent be-
tween users. As these users do not match this re-
quirement (their preferences are different from those
of others), this may explain why some of them get in-
accurate recommendations. We will refer their pref-
erences to as atypical preferences.
The work conducted in this paper is in line with
these latter works. We aim at identifying reliably
users with atypical preferences (ratings) and who will
receive inaccurate recommendations. From now on,
we will refer these users to as atypical users. Their
identification will be performed prior to any recom-
mendation computation. To reach these goals, we
propose several measures that reflect the atypicity of
preferences of a user.
Section 2 presents a short overview of recom-
mender systems and the way atypical users are identi-
fied and managed in social recommendation. Section
3 introduces three measures we propose to identify
atypical users. Then, in Section 4 the experiments we
conducted to evaluate those measures are presented.
Finally, we conclude and discuss our work in the last
section.
2 RELATED WORKS
2.1 Social Recommender Systems
Social recommendation, also denoted by collabora-
tive filtering (CF), relies on the knowledge of users’
preferences (generally some ratings) on some re-
sources to provide a user, referred to as the active
user, with some personalized recommendations. One
way to perform such recommendations is by infer-
ring the active user’s unknown preferences, then rec-
ommending the most relevant resources for him/her.
When ratings are not available, they can be inferred
from the traces of activity left by the users (Orm
´
andi
et al., 2010).
There are two main approaches in social rec-
ommendation: the memory-based approach and the
model-based approach (Adomavicius and Tuzhilin,
2005). The memory-based approach exploits di-
rectly users’ preferences, without pre-processing. The
most commonly used technique, the KNN (K Nearest
Neighbors), computes the similarities of preferences
between the active user and each other user, then se-
lects the K nearest users to the active user. This ap-
proach is simple to implement, provides high qual-
ity recommendations and takes into account each new
preference dynamically in the recommendation pro-
cess. However, it does not scale, due to the compu-
tation cost of the similarities. The model-based ap-
proach learns, as its name suggests, a model that de-
scribes the data (preferences), i.e. the relationship be-
tween users and resources. This model is used to es-
timate unknown preferences and to provide the active
user with recommendations. This approach does not
suffer so much from the scalability problem. How-
ever, it does not easily allow dynamic changes in the
model, especially if it has to be updated each time
a new preference is provided by a user. The model-
based matrix factorization technique has emerged few
years ago and is now the most commonly used tech-
nique, due to the quality of recommendations it pro-
vides. The matrix of users’ preferences is factor-
ized into two sub-matrices, one representing users,
the other representing the resources, both in a com-
mon sub-space where dimensions correspond to la-
tent features. There are several techniques of matrix
factorization, including the singular value decomposi-
tion (Billsus and Pazzani, 1998) and alternating least
squares (Hu et al., 2008).
2.2 Identifying Atypical Users in
Recommender Systems
In the literature, several terms are used to make ref-
erence to atypical users. They are deviant users, ab-
normal users, grey sheeps, etc. (Del Prete and Capra,
2010; Ghazanfar and Prugel-Bennett, 2011). Most of
the techniques used to perform their identification are
issued from data analysis. The abnormality measure
(Del Prete and Capra, 2010; Haydar et al., 2012) is
the most commonly used one. It has actually several
names: abnormality, deviance coefficient, deviance,
etc. but they all reflect the same phenomenon, namely
the tendency of a user to rate differently from others.
This measure uses the difference between the ratings
assigned by a user on some resources and the average
rating on these resources. It is defined by equation (1).
Abnormality(u) =
∑
r∈R
u
|
n
u,r
− n
r
|
k
R
u
k
(1)
WEBIST2015-11thInternationalConferenceonWebInformationSystemsandTechnologies
382

where n
u,r
represents the rating that user u assigned
to resource r, n
r
is the average rating of r, R
u
is the
set of resources rated by u and ||R
u
|| is their num-
ber. Users with a high abnormality are considered as
atypical users. The main advantage of this measure
is its low complexity. However, although this mea-
sure is the reference measure in the literature to iden-
tify users with atypical preferences, from our point of
view it suffers from several limitations. First, the re-
sources about which users’ preferences are not unani-
mous (the ratings between users is very different) will
unfairly increase the abnormality of the users who rate
these resources. Second, this measure does not take
into account the individual behavior of each user. For
example, a user more strict than the average user may
be labelled as abnormal, while he/she has similar pref-
erences to others, he/she only differs in his/her way
of rating resources. This measure will thus probably
identify some users as atypical, whereas they will get
accurate recommendations.
Some studies identify atypical users with the aim
to explain the fluctuations of performance of RS (Bel-
log
´
ın et al., 2011; Haydar et al., 2012; Griffith et al.,
2012; Ekstrand and Riedl, 2012), by studying users’
characteristics (number of ratings, number of neigh-
bors, etc.). For example, a link between the small
number of ratings of a user and a high recommen-
dation error may be identified (cold start problem).
In (Haydar et al., 2012), the authors form clusters
of users, based on their preferences and aim at in-
terpreting the clusters. Among the set of clusters, a
cluster made up of atypical users is identified: users
with a high recommendation error (RMSE) and who
have a high abnormality (equation (1)) as well. How-
ever, we are convinced that in the general case, clus-
tering fails to build a cluster of users with atypical and
who will get inaccurate recommendations. Indeed, an
atypical user, in the sense of the social recommen-
dation, has preferences that are not close to those of
other users. Thus, if a user belongs to a cluster, it
means that his/her preferences are similar to those of
users in the same cluster. So, he/she is not an atypical
user. The work presented in (Ghazanfar and Prugel-
Bennett, 2011) also relies on clustering of users, and
is in line with our convinction: it proposes to con-
sider users who are far from the center of their cluster
as atypical users.
(Bellog
´
ın et al., 2011) defines a clarity indicator,
that represents how much a user is non-ambiguous in
his/her ratings. This indicator is based on the entropy
measure: a user is considered as ambiguous (small
value of clarity) if his/her ratings are not stable across
resources. Authors show that there is a link between
the ambiguity of the ratings of a user and the quality
of recommendations he/she gets. Users with a small
clarity value are considered as noise and are discarded
from the system; they do not receive any recommen-
dations. We believe that this approach quickly reaches
its limits. Indeed, various ratings (preferences) of a
user can be explained by several factors such as the
evolution of his/her preferences through time, his/her
varying preferences across domains, etc. Therefore, a
social approach may anyway provide this user with
high quality recommendations. Notice that, at the
opposite of previous approaches, the clarity indicator
does not reflect the coherence of a user’s preferences
with respect to other users, it reflects the coherence
he/she has with him/herself. It can thus be exploited
in an approach other than the social one. Clarity can
also be linked the magic barrier concept (Herlocker
et al., 2004) and to recent works about user inconsis-
tency and natural variability (Bellog
´
ın et al., 2014),
which aim at estimating an upper bound on the rating
prediction accuracy.
The impact of users identified as atypical on the
overall quality of recommendations has been studied.
The comparison of the results presented is difficult
as atypical users are not selected on the basis of the
same criteria. However, they do all conclude that re-
moving atypical users in the learning phase of the rec-
ommender improves the overall quality of the recom-
mendations.
Notice that the identification of atypical users may
be associated with the identification of outliers. Ac-
cording to (Hawkins, 1980), an outlier is “an obser-
vation that deviates so much from other observations
as to arouse suspicion that is was generated by a dif-
ferent mechanism”. In the context of recommender
systems, an outlier is a user whose preferences appear
to have been generated by a different preference ex-
pression mechanism. Criterion based, statistical ap-
proaches and clustering are also widely used in the
field of outliers detection (Aggarwal, 2013).
2.3 Managing Atypical Users in
Recommender Systems
Once atypical users have been identified, one ques-
tion that can be addressed is related to their manage-
ment. In the context of recommender systems, new
recommendation approaches dedicated to these spe-
cific profiles are developed, to provide them with bet-
ter recommendations. In (Del Prete and Capra, 2010),
which refer atypical users to as deviant users, the au-
thors divide users into two subsets: deviant and non-
deviant users, using the abnormality measure (equa-
tion (1)). These two sets are considered independently
when training recommendation models (two models
IdentifyingUserswithAtypicalPreferencestoAnticipateInaccurateRecommendations
383

are formed), as well as during the recommendation
process. Only deviant users are taken into account
when the active user is identified as deviant. Con-
versely, only non-deviant users are considered when
the active user is non-deviant. This approach has
shown to improve the quality of recommendations re-
lated to non-deviant users. However, it has no impact
on the quality of the recommendations provided to de-
viant users. This confirms our intuitions that atypical
users do not share preferences with any of the users.
In addition, we find this result not surprising as the
recommendation approach has not been adapted to
these specific users.
We previously reported how (Ghazanfar and
Prugel-Bennett, 2011) identify atypical users through
clustering. To address these atypical users, they use a
specific cluster based CF algorithm (model approach)
to better reflect the preferences of these users and to
offer them better recommendations. Authors assume
that these users have only partial agreement with the
rest of the community (i.e. CF will fail on these users)
and propose to rely on content of resources to gener-
ate recommendations.
J. Bobadilla (Bobadilla et al., 2012) has proposed
a more general solution to take into account the speci-
ficities of atypical users, through a new similarity
measure. This new measure is based on the singu-
larity of ratings. A rating on a resource is considered
as singular if it does not correspond to the majority
rating on this resource. Authors assume that atypi-
cal users tend to assign singular ratings to resources.
When computing the similarity between two users,
the more a rating is singular, the greater its impor-
tance. The similarity between users is then used as in
a classical KNN-based recommendation approach. It
has shown to provide high quality preferences to users
with specific preferences.
3 NEW IDENTIFICATION
MEASURES OF ATYPICAL
USERS
We propose in this section new measures for identify-
ing atypical users, i.e. users with preferences that dif-
fer from those of the population of users and who will
receive low quality recommendations. These identifi-
cation measures are designed to be used prior to the
recommendation process, so they rely on the users’
profiles (preferences on resources) only.
3.1 CorrKMax
The first measure we propose is dedicated to
the neighborhood-based recommendation approach,
namely the KNN technique. We are convinced that
the KNN approach, which exploits the K most simi-
lar users to the active user, fails in the case of active
users who do not have enough highly similar users.
We thus define CorrKMax to highlight the link be-
tween the similarity of the most similar users of a
user and the quality of the recommendations he/she
gets. CorrKMax(u) (equation (2)) represents the av-
erage similarity between the active user u and his/her
K most similar users.
CorrKMax(u) =
∑
n∈Neigh(u)
Pearson(u, n)
||Neigh(u)||
(2)
where Pearson(u, n) is the Pearson correlation be-
tween the preferences of users u and n. Neigh(u)
represents the k most similar users to u, in the limit
their correlation with u is positive. We believe that the
users associated with a low value of CorrKMax(u) re-
ceive inaccurate recommendations.
The two following measures are an extension of
the Abnormality measure from the state of the art,
which has shown good atypical user identification ca-
pabilities (see section 2.2). To overcome the limi-
tations that we have mentioned and presented in the
previous section, we propose a first improvement.
3.2 AbnormalityCR
The AbnormalityCR (Abnormality with Controversy
on Resources) measure assumes that the meaning of
the discrepancy between a rating on a resource and the
average rating of this resource differs according to the
resource. Indeed, a large discrepancy on a controver-
sial resource has not the same meaning as a large dis-
crepancy on a consensual resource. The abnormality
measure of the state of the art considers these differ-
ences as equal, which has the effect of increasing the
abnormality of users who express their preferences
on controversial resources. We therefore propose to
reduce the impact of the ratings on controversial re-
sources, by weighting them with the degree of con-
troversy of the resources they refer to.
This degree of controversy of a resource is based
on the standard deviation of the ratings on this re-
source. The AbnormalityCR of a user u is computed
as shown in equation (3).
Abnormality
CR
(u) =
∑
r∈R
u
((n
u,r
− n
r
) ∗ contr(r))
2
k
R
u
k
(3)
WEBIST2015-11thInternationalConferenceonWebInformationSystemsandTechnologies
384

where contr(r) represents the controversy associated
with resource r. It is based on the normalized standard
deviation of ratings on r and is computed according to
equation (4).
contr(r) = 1 −
σ
r
− σ
min
σ
max
− σ
min
(4)
where σ
r
is the standard deviation of the ratings as-
sociated with the resource r. σ
min
and σ
max
are re-
spectively the smallest and the largest possible stan-
dard deviation values, among resources. The compu-
tation complexity of AbnormalityCR is comparable to
that of the abnormality of the state of the art. It can
therefore be computed frequently and thus take into
account new preferences.
3.3 AbnormalityCRU
The AbnormalityCRU (Abnormality with Contro-
versy on Resources and Users) measure is a sec-
ond improvement of Abnormality. It starts from
the observation that neither Abnormality(u) nor
AbnormalityCR(u) reflect the general behavior of the
user u. Thus, a user who is strict in his/her way to
rate resources may be considered as atypical, even if
his/her preferences are actually not. In addition, this
user will probably receive high quality recommenda-
tions. To avoid this bias, we propose to center the rat-
ings of each user around his/her average rating. This
way to reflect the user’s behavior is also that used in
the Pearson correlation coefficient. Furthermore, the
average rating of a resource is computed on the cen-
tered ratings. The abnormality of a user u, denoted by
AbnormalityCRU (u), is computed using equation (5).
Abnormality
CRU
(u) =
∑
r∈R
u
[(
|
n
u,r
− n
u
− n
C
r
|
) ∗ contr
C
(r)]
2
k
R
u
k
(5)
where n
C
r
represents the average centered rating of
resource r, contr
C
(r) represents the controversy asso-
ciated with resource r, computed from the standard
deviation of the ratings on u, centered with respect
to users. The computation of AbnormalityCRU (u) is
more complex than AbnormalityCR(u), but should al-
low a more accurate identification of atypical users.
Note that these last two measures are indepen-
dent of the recommendation approach used, whether
it is KNN or matrix factorization, contrary to the
CorrKMax measure.
4 EXPERIMENTS
The experiments we conduct in this section are in-
tended to assess the quality of the atypical users iden-
tification measures we propose, in comparison with
the measures from the state of the art. The assess-
ment is based on the quality of the recommendations
provided to users identified as atypical.
4.1 Dataset & System Settings
Experiments are conducted on the MovieLens100K
dataset from the state of the art. MovieLens100K is
made up of 100, 000 ratings from 943 users on 1, 682
movies (resources). The ratings range from 1 to 5, on
integer values. We divide the dataset into two sub-sets
made up of 80% (for learning) and 20% (for test) of
the ratings of each user.
As presented in the beginning of this paper, we
aim at identifying users who will be provided with in-
accurate recommendations, due to their atypical pref-
erences. The literature emphasizes that users about
who the system has collected few preferences get in-
accurate recommendations (cold start problem). To
not bias our evaluation, we decide to discard these
users from the dataset. We consider that a user who
has less than 20 ratings in the training set is associated
to cold start (Schickel-Zuber and Faltings, 2006). The
set of users is then reduced to 821 users.
The accuracy of recommendations is evaluated
through standard measures, which compute the dis-
crepancy between the rating provided by a user on
a resource and the rating estimated by the recom-
mender. These measures are the Mean Absolute Er-
ror (MAE) and the Root Mean Square Error (RMSE).
The lower MAE and RMSE, the higher the accuracy
of recommendations provided to users. In this work,
we will specifically exploit per-user MAE (MAE(u))
and RMSE (RMSE(u)), computed by equations (6)
and (7).
MAE(u) =
∑
r∈R
u
|n
u,r
− n
∗
u,r
|
||R
u
||
(6)
RMSE(u) =
s
∑
r∈R
u
(n
u,r
− n
∗
u,r
)
2
||R
u
||
(7)
where n
∗
u,r
is the estimated rating of user u on
resource r.
To compute the per user errors, we implement
two different techniques of CF: a User-Based rec-
ommender and a Matrix Factorization technique for
recommendation. In this way, we want to show the
genericity of our measures. We set up the most used
IdentifyingUserswithAtypicalPreferencestoAnticipateInaccurateRecommendations
385
settings in the state of the art for each of these two
approaches.
The User-Based recommender define the similarity
of two users as the Pearson correlation coefficient of
their two ratings vectors. The rating estimation for a
user is based on the ratings of his k nearest neighbors,
using a weighted average of their ratings. We fix k =
20 for this dataset.
The matrix factorization technique is a model based
approach decomposing the User-Item rates matrix
into two sub matrices, one representing users and the
other representing items. Each user or item is repre-
sented by n latent features. We use the ALS factor-
ization technique to compute this decomposition with
5 latent features. We use then this model to calculate
rate estimations.
We then focus on the correlation between errors cal-
culated with those approaches and our identification
measures.
4.2 Correlations Between Identification
Measures and Recommendation
Error
In this section, we evaluate the quality of the atypical
users identification measures, through their correla-
tion with the recommendation error (per-user MAE
and per-user RMSE) of the KNN technique (with
K = 20). Four measures are studied: Abnormality
from the state of the art and the three measures we
propose: AbnormalityCR and AbnormalityCRU and
CorrKMax (with K = 20 also). Based on these cor-
relations, we can determine which measures are good
indicators of the quality of recommendations that will
be proposed to users. The correlations are presented
in Table 1.
Table 1: Correlations between identification measures and
MAE/ RMSE of a KNN approach.
MAE RMSE
Abnormality 0.441 0.453
Abnormality
CR
0.503 0.504
Abnormality
CRU
0.538 0.546
CorrKMax -0.17 -0.22
The Abnormality measure from the state of the
art has a correlation of 0.441 and 0.453 with MAE
and RMSE respectively. These correlations are sig-
nificant and confirm the existence of a link between
the Abnormality of a user and the accuracy of the rec-
ommendation he/she gets: the higher the Abnormality
of a user, the lower the accuracy of the recommenda-
tions he/she receives. At the opposite, the lower the
Abnormality, the higher the accuracy. Recall that a
user with a high Abnormality value is considered as
atypical.
When using AbnormalityCR, the correlation with
RMSE reaches 0.504, which corresponds to an im-
provement of 11% of the correlation. We can
deduce that integrating the controversy associated
with the resources in the computation of the Ab-
normality improves the estimation of the accuracy
of the recommendations provided to users. With
AbnormalityCRU , the correlation is equal to 0.546,
which corresponds to a further improvement of 8%
(20% with respect to Abnormality). So, taking into
account users’ rating peculiarities (users’ profile) fur-
ther improves the anticipation of the accuracy of rec-
ommendations.
The low correlation between CorrKMax and
RMSE (-0.22) indicates that, contrary to our intu-
ition, the quality of a user’s neighborhood is not cor-
related with the quality of the recommendations pro-
vided to him/her, with a KNN recommendation tech-
nique. This result is surprising as the KNN technique
assumes that the more a user is correlated with the
active user, the more he/she is reliable, and thus the
more important he/she is in the computation of rec-
ommendations for the active user.
We also notice here that all identification mea-
sures are more correlated with the RMSE than with
the MAE. We therefore choose to use the RMSE as
the error measure in the following experiments.
4.3 Recommendation Error for
Atypical Users
A correlation is used to evaluate the relationship be-
tween two variables on a set of observations. How-
ever, there may be a relationship within only a subset
of the observations of these variables. In that case,
the correlation may not allow to identify this relation-
ship. In particular, in this paper we aim at identifying
a link between atypical users and the RMSE. There-
fore, in the following experiments, we will no more
focus on the correlation between identification mea-
sures and RMSE, but on the distribution of the errors
observed on users identified as atypical. The users
with an extreme value of the identification measure
are considered as atypical (the highest ones for the
abnormality measures).
To study the distribution of these errors, we ex-
tract the minimum, the maximum, the quartiles and
the median of the errors (RMSE), and depict them
with box plots. The four identification measures:
Abnormality, AbnormalityCR, AbnormalityCRU and
CorrKMax are studied.
To evaluate precisely these four measures, we
WEBIST2015-11thInternationalConferenceonWebInformationSystemsandTechnologies
386
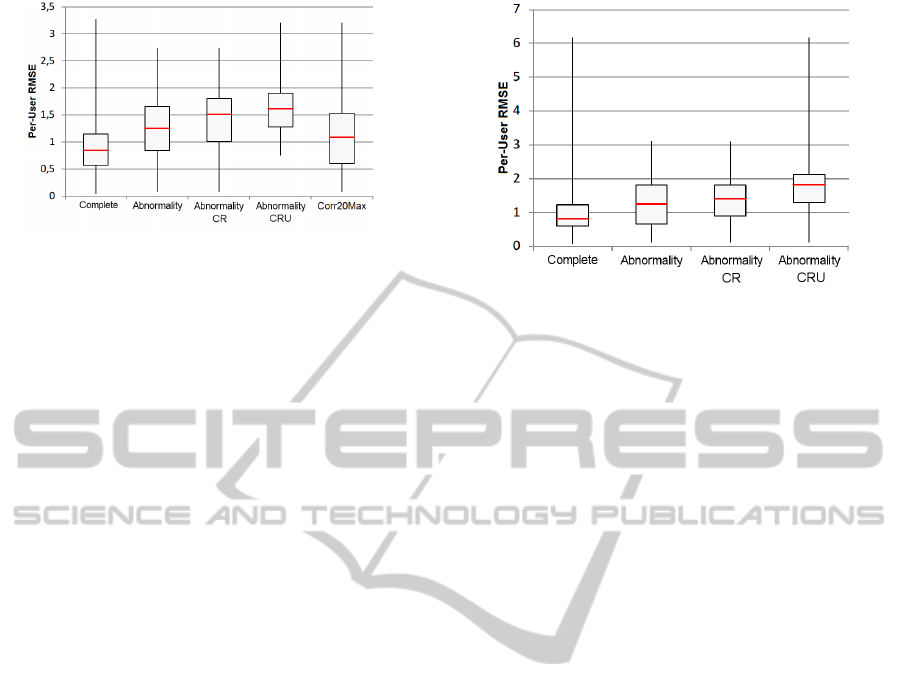
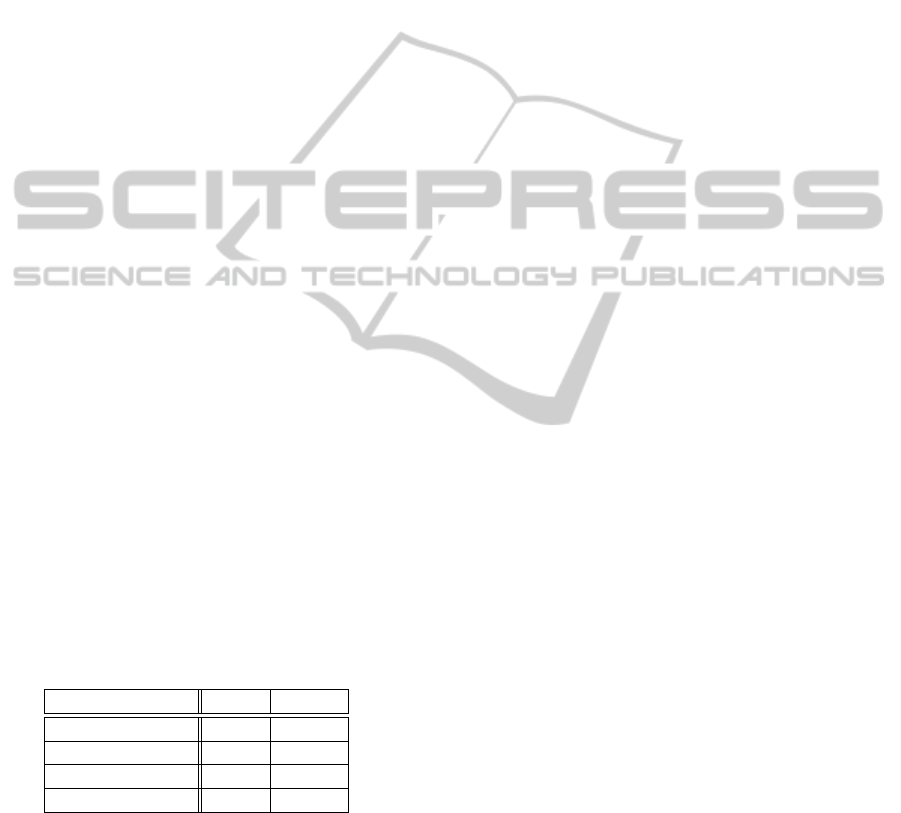
Figure 1: Distribution of RMSE of atypical users with the
KNN technique.
compare their box plots with the one of the com-
plete set of users (denoted by Complete in Figures
1 and 2). The higher the errors, the more accurate
the measure. As the identification measures do not
all have comparable values, we did not use a prede-
fined atypicity threshold value. We chose to consider
a predetermined percentage of atypical users, which
we fixed experimentally at 6% of the complete set of
users. This corresponds to about 50 users among the
821 users. We compare these measures in the frame-
work of the two main recommendation techniques:
the KNN technique, and the matrix factorization tech-
nique.
4.3.1 Errors Associated with Atypical Users in
the KNN Technique
The distribution of the errors obtained with the KNN
technique, according to the identification measure, are
presented in Figure 1.
The median error on the complete set of users
(Complete) is 0.82. The median error associated with
Abnormality is 1.26. This represents an increase in
the error by over 50%. Furthermore, the median value
of Abnormality is equivalent to the third quartile of
the Complete set: 50% of users identified as atyp-
ical users with Abnormality are part of the 25% of
users with the highest RMSE in the Complete set.
However, 25% of the users considered as atypical
have a RMSE lower than the median RMSE of the
complete set of users. This means that, although
Abnormality from the state of the art allows to iden-
tify users who will receive inaccurate recommenda-
tions, it appears to select a significant number of users
who will receive accurate recommendations (false de-
tection). Abnormality is thus not precise enough. Re-
call that users identified as atypical may either not
receive any recommendations at all, or may get rec-
ommendations from another approach, which may be
less accurate. The precision of the measure used is
thus of the highest importance. The limits that we
presented in the previous section are confirmed: the
Figure 2: Distribution of RMSE of atypical users with the
matrix factorization technique.
discrepancy between a rating and the average rating
on a resource is not sufficient to reliably predict inac-
curate recommendations.
Both measures AbnormalityCR and
AbnormalityCRU are of higher quality than
Abnormality. AbnormalityCRU appears to be
the best one. With AbnormalityCRU, all the users
identified as atypical users have a RMSE higher
than the median RMSE of the complete set of
users. In addition, over 75% of these users have
a RMSE higher than 1.25, i.e. 75% of the users
with the highest AbnormalityCRU are among the
25% of the complete set of users who will receive
inaccurate recommendations. The precision of the
AbnormalityCRU measure is thus high.
However, once more CorrKMax (K = 20) is not
precise, the users identified as atypical tend to receive
high quality recommendations (50% of them). The
low similarity of a user’s nearest neighbors is thus not
a reliable information to predict the quality of recom-
mendations this user will receive.
We can conclude that, when the AbnormalityCRU
measure identifies a user as an atypical user, he/she
will actually receive inaccurate recommendations
with the KNN recommendation technique.
4.3.2 Errors Associated with Atypical Users in
the Matrix Factorization Technique
In this section, we seek to assess whether the identifi-
cation measures studied are generic, i.e. if they can
also be used with a matrix factorization technique.
The errors associated with CorrKMax are not stud-
ied here, as CorrKMax is dedicated to the KNN tech-
nique. Figure 2 presents the distributions of the errors
of the three Abnormality measures with a matrix fac-
torizaton approach.
The ranking of the measures obtained on the KNN
technique is confirmed here: both AbnormalityCR
IdentifyingUserswithAtypicalPreferencestoAnticipateInaccurateRecommendations
387

and AbnormalityCRU improve Abnormality;
AbnormalityCRU remains the most accurate measure
for identifying atypical users. Moreover, we can
observe that the quality of AbnormalityCRU is
similar to the one observed with the KNN technique:
75% of users identified as atypical receive recom-
mendations of quality equivalent to the worse 25% of
recommendations from the complete set of users.
In conclusion, we can say that the
AbnormalityCRU measure, which we propose,
is the most accurate measure: when it identifies a
user as atypical, he/she most likely will receive low
quality recommendations. Moreover, this measure
is independent of the recommendation technique:
it is efficient in both KNN and matrix factorization
techniques. This may be linked with the conclusion
made in (Ekstrand, 2014), which has shown that
different recommendation approaches (collaborative
user-user, collaborative item-item, content, etc.) tend
to fail on the same users.
However, although the high accuracy of
AbnormalityCRU , some users (from the com-
plete set) with a high RMSE are identified by none
of the Abnormality measures: it concerns 50% of the
users who have a RMSE greater than 2. This means
that further work has to be conducted to identify the
characteristics of these users.
5 CONCLUSION AND
PERSPECTIVES
Social recommender systems is the context of this
work. Our objective was to identify users who will
receive inaccurate recommendations, upstream of the
recommendation process, i.e. based only on the char-
acteristics of their preferences. We hypothesized that
users with preferences that differ from those of other
users will receive inaccurate recommendations. We
have referred these users to as atypical users. To val-
idate this hypothesis, we proposed several measures
for identifying atypical users, based on the similarity
of users’ preferences with other users, on the average
discrepancy of the ratings they provide in comparison
with the average rating of other users, on the consen-
sus of ratings on resources, or on users rating profile.
We have shown, on a state of the art dataset, that the
measure that uses all these criteria is the most accurate
one and allows to reliably anticipate that a user will
get inaccurate recommendations, with either a KNN
or a matrix factorisation technique.
In a further work, we will focus on the proposition
of a new recommendation approach, to provide atyp-
ical users with high quality recommendations. In par-
allel, it will be interesting to investigate the reasons
why some users do get inaccurate recommendations
and are not identified by any of the measures studied,
as mentionned in the previous section. Specifically, a
user may be atypical on a subset of items, which is
not considered by the measures studied here.
REFERENCES
Adomavicius, G. and Tuzhilin, A. (2005). Toward the next
generation of recommender systems: A survey of the
state-of-the-art. IEEE transactions on knowledge and
data engineering, 17(6):734–749.
Aggarwal, C. (2013). An introduction to outlier analysis. In
Outlier Analysis, pages 1–40. Springer New York.
Bellog
´
ın, A., Castells, P., and Cantador, I. (2011). Predict-
ing the performance of recommender systems: An in-
formation theoretic approach. In Proc. of the Third
Int. Conf. on Advances in Information Retrieval The-
ory, ICTIR’11, pages 27–39. Springer.
Bellog
´
ın, A., Said, A., and de Vries, A. (2014). The magic
barrier of recommender systems no magic, just rat-
ings. In Proc. of the 22nd Conf. on User Modelling,
Adaptation and Personalization (UMAP).
Billsus, D. and Pazzani, M. J. (1998). Learning collabora-
tive information filters. In Proc. of the Fifteenth Int.
Conf. on Machine Learning, ICML ’98, pages 46–54,
San Francisco, CA, USA. Morgan Kaufmann Publish-
ers Inc.
Bobadilla, J., Ortega, F., and Hernando, A. (2012). A col-
laborative filtering similarity measure based on singu-
larities. Inf. Process. Manage., 48(2):204–217.
Bobadilla, J., Ortega, F., Hernando, A., and Guti
´
errez, A.
(2013). Recommender systems survey. Know.-Based
Syst., 46:109–132.
Castagnos, S., Brun, A., and Boyer, A. (2013). When di-
versity is needed... but not expected! In IMMM 2013,
The Third Int. Conf. on Advances in Information Min-
ing and Management.
Del Prete, L. and Capra, L. (2010). differs: A mobile rec-
ommender service. In Proc. of the 2010 Eleventh Int.
Conf. on Mobile Data Management, MDM ’10, pages
21–26, Washington, USA. IEEE Computer Society.
Ekstrand, M. (2014). Towards Recommender Engineering.
Tools and Exp. for Identifying Recommender Differ-
ences. PhD thesis, Faculty of the University of Min-
nesota.
Ekstrand, M. and Riedl, J. (2012). When recommenders
fail: predicting recommender failure for algorithm se-
lection and combination. In Proc. of the sixth ACM
conf. on recommender systems, pages 233–236. ACM.
Ghazanfar, M. and Prugel-Bennett, A. (2011). ”fulfilling the
needs of gray-sheep users in recommender systems, a
clustering solution”. In 2011 Int. Conf. on Informa-
tion Systems and Computational Intelligence. Event
Dates: 18-20, January.
WEBIST2015-11thInternationalConferenceonWebInformationSystemsandTechnologies
388

Goldberg, D., Nichols, D., Oki, B., and Terry, D. (1992).
Using collaborative filtering to weave an information
tapestry. Communications of the ACM, 35(12):61–70.
Grcar, M., Mladenic, D., and Grobelnik, M. (2005). Data
quality issues in collaborative filtering. In Proc. of
ESWC-2005 Workshop on End User Aspects of the Se-
mantic Web.
Griffith, J., O’Riordan, C., and Sorensen, H. (2012). Inves-
tigations into user rating information and predictive
accuracy in a collaborative filtering domain. In Proc.
of the 27th Annual ACM Symposium on Applied Com-
puting, SAC ’12, pages 937–942, New York. ACM.
Hawkins, D. M. (1980). Identification of outliers, vol-
ume 11. Springer.
Haydar, C., Roussanaly, A., and Boyer, A. (2012). Clus-
tering users to explain recommender systems’ perfor-
mance fluctuation. In Foundations of Intelligent Sys-
tems, volume 7661 of Lecture Notes in Computer Sci-
ence, pages 357–366. Springer.
Herlocker, J., Konstan, J., Terveen, L., and Riedl, J. (2004).
Evaluating collaborative filtering recommender sys-
tems. ACM Transactions on Information Systems.
Hu, Y., Koren, Y., and Volinsky, C. (2008). Collabora-
tive filtering for implicit feedback datasets. In Proc.
of the 2008 Eighth IEEE Int. Conf.e on Data Mining,
ICDM ’08, pages 263–272, Washington, DC, USA.
IEEE Computer Society.
Orm
´
andi, R., Hegeds, I., Csernai, K., and Jelasity, M.
(2010). Towards inferring ratings from user behav-
ior in bittorrent communities. In Proc. of the 2010
19th IEEE Int. Workshops on Enabling Technologies:
Infrastructures for Collaborative Enterprises (WET-
ICE), pages 217–222.
Resnick, P., Iacovou, N., Suchak, M., Bergstrom, P., and
Riedl, J. (1994). Grouplens: An open architecture
for collaborative filtering of netnews. In Proc. of the
1994 ACM Conf. on Computer Supported Cooperative
Work, CSCW’94, pages 175–186, New York. ACM.
Schein, A. I., Popescul, A., Ungar, L. H., and Pennock, D.
(2001). Generative models for cold-start recommen-
dations. In Proc. of the 2001 SIGIR workshop on rec-
ommender systems.
Schickel-Zuber, V. and Faltings, B. (2006). Overcoming in-
complete user models in recommendation systems via
an ontology. In Proc. of the 7th Int. Conf. on Knowl-
edge Discovery on the Web, WebKDD’05, pages 39–
57, Berlin. Springer.
Su, X. and Khoshgoftaar, T. M. (2009). A survey of col-
laborative filtering techniques. Adv. in Artif. Intell.,
2009:4:2–4:2.
IdentifyingUserswithAtypicalPreferencestoAnticipateInaccurateRecommendations
389
