
Social Media Analytics in Customer Service: A Literature Overview
An Overview of Literature and Metrics Regarding Social Media Analysis in
Customer Service
Volker Stich, Roman Emonts-Holley and Roman Senderek
Institute for Industrial Management, RWTH Aachen University, Campus-Bouleveard 55, 52074 Aachen, Germany
Keywords: Social Media Analytics, Web Analytics, Key Figures, Social Media, Social Networks, Metrics, KPI, Key
Performance Indicators, Balanced Scorecard.
Abstract: The main problem with social media analytics is not the abundance of measurable metrics but the lack of a
coherent structure or overview that describes and organizes metrics in order to make them useful for the
customer service of organizations. Thus, this paper aims to organize and categorize key performance
indicators (KPI) for social media on the one hand and provide a literature overview about social media in
customer service on the other hand. The KPI are grouped into six categories customer experience, customer
interaction, customer activation, customer satisfaction, reach and finance and the literature is evaluated by
three criteria. The three criteria are: social metrics, multidimensional variables and evaluation of financial
benefit. Our evaluation identifies a research gap in the social media applied in customer service. The first
results concerning the researched KPI show that a large amount of metrics is available, but only a few of
them are actually currently applied by companies to evaluate their customer service.
1 INTRODUCTION
Nowadays, companies are trying to use social media
to reach their customers more effectively. On the
one hand the application of social media can be
cheap and easy to implement (every company is able
to use most social media cannels (facebook, twitter,
etc.) for free. On the other hand it is difficult to
evaluate and analyze the actual effects of this effort,
i.e. estimating the impact of a specific measure is not
trivial. In this paper we will consolidate and connect
different already existing approaches of analyzing
and clustering data related to the application of
social media in the customer service. We will
evaluate which key figures are useful for customer
service and therefore should be used to estimate the
value of a company’s social media activity. We want
to emphasize that we will conduct a literature
overview and start to categorize the useful key
figures regarding social media in the customer
service. A balanced scorecard will not be the result
of this paper because that would go beyond the
restrictions of this paper. This paper aims to set the
theoretical framework for future research in social
media analytics for customer service
The paper is structured as follows: First, we will
shortly discuss whether a similar overview of the
existing approaches has already been given before.
If so, what makes our paper different? Chapter two
explains the applied method of research and presents
the results. The third chapter discusses and reviews
these results critically. In the critical review of our
research we conclude that it is near impossible to
gather every available variable. The final chapter
summarizes the paper and indicates further research
prospectives. For further research we recommend
developing a method based on the research of this
paper. This method should include the theoretical
framework for a comprehensive balanced scorecard
regarding customer service for social media.
Comparison to Related Work
There are already several literature overviews which
social media metrics or KPI exist and how they can
be used for specific industries (tourism, libraries,
etc.) (Leung et al., 2013, Michaelidou et al., 2011) or
certain social media channels (Eysenbach, 2011,
Haustein et al., 2014). In addition to that some paper
group metrics and KPI, but lack an application focus
(Peters et al., 2013, Michaelidou et al., 2011).
But so far, none of these papers provide a summary
of measurable key figures for the use of social media
335
Stich V., Emonts-Holley R. and Senderek R..
Social Media Analytics in Customer Service: A Literature Overview - An Overview of Literature and Metrics Regarding Social Media Analysis in
Customer Service.
DOI: 10.5220/0005413003350344
In Proceedings of the 11th International Conference on Web Information Systems and Technologies (WEBIST-2015), pages 335-344
ISBN: 978-989-758-106-9
Copyright
c
2015 SCITEPRESS (Science and Technology Publications, Lda.)
in the customer service sector. Therefore, metrics to
measure social media impact in customer service
will be summarized and analyzed in this paper for
the first time.
2 RESEARCH IDEAS AND
RESULTS
In order to gather as many existing studies on the
topic of social media impact as possible, the
following research method was applied:
1. Find articles or books related to the
following key words (in English and
German) as well as combinations of them:
a. social media
b. social network
c. analysis
d. metrics
e. key figures
f. key performance indicators (KPI)
g. return of investment (ROI)
h. compass
i. radar
j. balanced scorecard
k. influence
l. controlling
This research was done with the help of different
online databases, mainly Google Scholar,
EBSCOHOST and Web of Science. Our initial
database search identified 323 titles from which we
selected 111 for abstract review, after removing
evidently irrelevant titles. By reviewing abstracts,
we selected 182 articles for full-text review. 24 of
those went into Table 1 where we put them through
the following steps:
2. Import all files into a database. Read and
skim every file (study, essay, review),
extract and note its general idea and
purpose
3. Categorize the literature by topics or
described metrics. Following this step, the
used literature was divided into these three
research approaches:
Social Media: This research approach contains
literature that deals with the use of social media in
general.
Customer Service: Sources that specifically deal
with customer service are categorized in this
approach.
Balanced Scorecard: This category contains papers
and studies that consider a wide array of variables
and target dimensions. These contributions are
mainly focused on measurement of key figures of
different types.
After this categorization, all sources were rated,
which lead to step four:
4. Rate the sources by the following three
criteria:
Social Metrics: This criterion describes if and how
detailed the studies and essays cover social metrics,
i.e. if there is a scientific approach to define and
measure key figures related to social media.
Multidimensional Variables: This criterion checks
if the article uses one or multidimensional objectives
to evaluate the social media metric
(multidimensional variables are combined metrics).
Evaluation of Financial Benefit: This is one of the
most interesting and important criterion for
organizations:
We evaluate whether the article deals
with impact of social media regarding financial
aspects.
To understand the key words used in the literature
we found, and how a balanced scorecard works, we
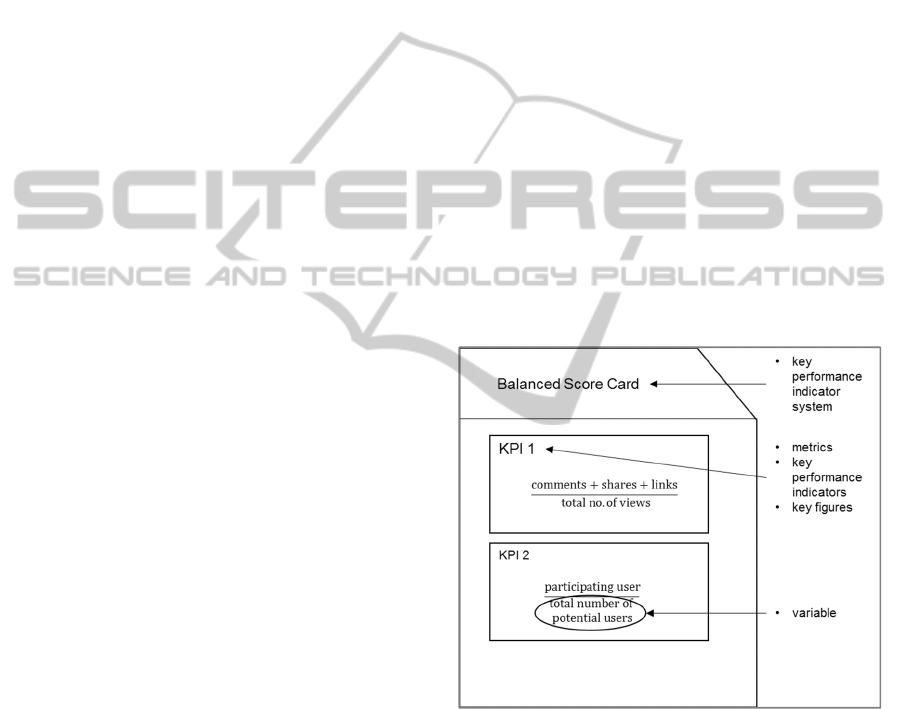
visualized it (Figure 1).
Figure 1: Difference between BSC KPI and variables.
Figure 1 depicts the difference between key words
used synonymously in literature. A balanced
scorecard (BSC) or key performance indicator
system is a tool companies can use to evaluate
performance of different types. For that to work
there are different KPI (key performance indicators)
also called metrics or key figures which inherit
different variables. The KPI present numerical
values which are incorporated in the BSC. For the
calculation KPI are weighted depending on their
impact.
WEBIST2015-11thInternationalConferenceonWebInformationSystemsandTechnologies
336

In the following paragraphs we will discuss the ten
most cited sources, which can be found in Table 1.
Bock, who holds the position of Head of Social
Media Marketing and Service Internet at Telekom
Germany GmbH, significantly supported the
construction of the social media based customer
service portal Telekom helps. His paper explains the
use and implementation of this specific social media
customer service in great detail. However, the
approach has a strong reference to the specific
application at Telekom Germany GmbH and
therefore is only partially transferable to other
companies. For the implementation of the described
social media strategy, Bock proposes a SWOT
analysis and various key performance indicators
(KPI), but does not describe a coherent social media
monitoring system. On a financial level B
OCK does
consider the costs, but fails to take the financial
value of the social media measures into account
(Bock, 2012).
Another important source is the work published by
Weinberg (Weinberg et al., 2012). She looks at the
contribution of social media from a marketing-
oriented point of view and gives an overview of
adequate strategies for different social media
channels. Approaches to social media monitoring are
discussed in this paper, but they are not transferred
into business-relevant metrics. A number of tools for
social media analysis, even some free of charge, are
explained. The need for a multi-dimensional target
system is recognized and discussed for the potential
development of a social media ROI. (Weinberg et
al., 2012).
One of the most promising approaches that can be
attributed to both strategy development in the field
of social media and the definition of a social media
ROI is provided by Blanchard (Blanchard, 2011).
His work presents a social media program with
different approaches to the assessment of social
media value and is based on a very detailed
structure. Subsequently he tries to convert this
program into actual quantifiable metrics. Blanchard
argues that a social media ROI can be determined on
the basis of the financial impact (Blanchard, 2011).
In order to achieve this, social media costs are set in
relation to changes in sales and profits, opportunity
costs and changes in the social media monitoring
indicators such as the number of Twitter followers.
Although this is by far the most comprehensive
approach, some questions remain unanswered,
because Blanchard’s approach is based on linear and
independent causal relationships, i.e. the calculation
is still based on a number of assumptions
(Blanchard, 2011).
A very good overview of the previously established
measurement approaches and their calculations can
be found in the works of Owyang and Lovett
(Owyang and Lovett, 2010). However, the authors
describe a more general approach to the problem
without adding a superordinate theme to the metrics
they describe (Owyang and Lovett, 2010).
A different but also very comprehensive
consideration of possible social media metrics
provides Sterne in his post (Sterne, 2010). He
explains his definitions and calculations by pointing
out that every company should define its own
personalized KPI. But he does not develop a multi-
dimensional target system or determines a financial
contribution to the value, which weakens the overall
use of the paper. Nevertheless S
TERNE does point
out the complexity of the effects of social media use,
and explains that these cannot be quantified in his
opinion (Sterne, 2010).
In her book, Kelly first describes the development of
the social media monitoring for various marketing-
oriented perspectives. She describes figures for
customer service, in particular customer loyalty.
While she discusses the calculation of ROI for sales-
related social media, insights about customer service
related financial measurements are lacking (Kelly,
2012).
A paper that focuses on the financial value of a fan
or follower was published by Sponder (Sponder,
2011). His calculation provides a low accuracy and
can only be considered as a rough estimate. To
control the use of social media, Sponder describes
various scorecard approaches that only focus on the
practical usage, but neglects the repercussions on
other business sectors.
In his study of call centers Jaiswal concludes that it
is mainly operational KPIs that are measured in call
centers, whereas evaluation of service quality is
often neglected (Jaiswal, 2008).
Furthermore, Feinberg questions efficiency metrics,
as these have little impact on customer satisfaction
(Feinberg et al., 2000). Accordingly, he recommends
measuring the quality of service from a customer
point of view.
Kim and Kim (Kim and Kim, 2008) uses company
performance, customer, process and infrastructure in
their BSC. Profitability and value of an organization
are considered in the company’s performance. The
customer perspective considers customer loyalty,
customer satisfaction and customer value. The
procedural level considers all activities associated
with the acquisition of new customers, customer
retention and expansion of existing business
relationships. The infrastructure perspective is
SocialMediaAnalyticsinCustomerService:ALiteratureOverview-AnOverviewofLiteratureandMetricsRegarding
SocialMediaAnalysisinCustomerService
337
divided into four subcategories: IT, human capital,
strategic direction and corporate culture (Kim and
Kim, 2008).
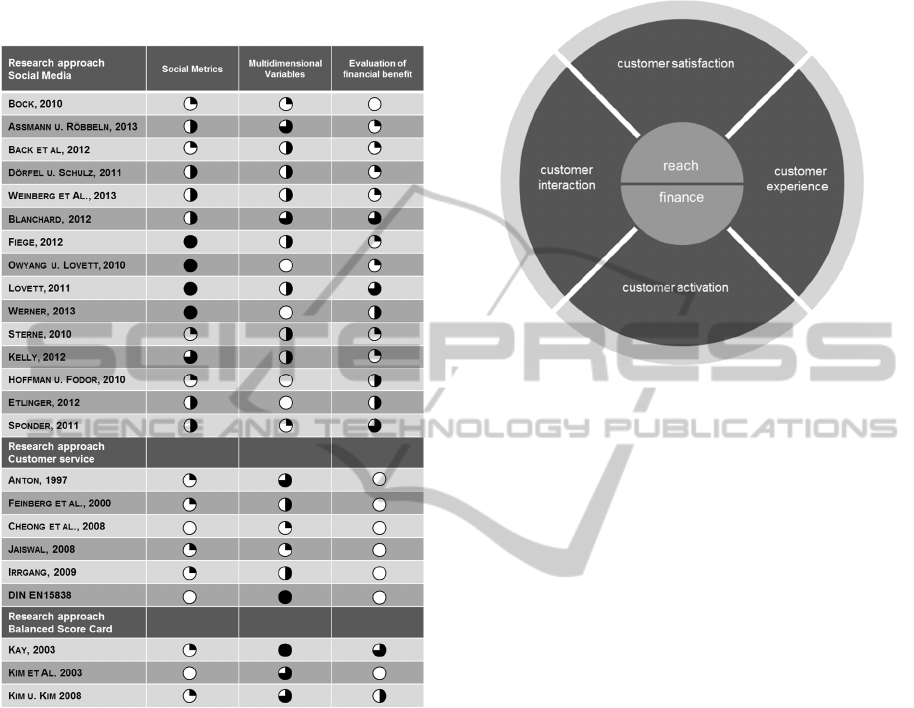
Table 1: Literature overview.
The overview in table 1 shows that none of the
examined papers considers all three aspects of social
media metrics and impact equally. We researched
further and checked each article for the specific key
figure and compared them individually to each
other.
We specifically looked at sources that contained a
conclusive number of metrics relevant to social
media and summarized the metrics and key figures
in the Tables of the following chapter. To gain a
better understanding of the number of metrics it was
necessary to categorize the key figures in different
groups, which will be explained in the respective
paragraph.
We subdivided the social media metrics for
customer service into a total of six categories:
I. Customer experience
II. Customer interaction
III. Customer satisfaction
IV. Customer activation
V. Reach
VI. Finance
Figure 2: categories for social media metrics.
Though customer experience is rarely considered as
a separate construct in the marketing literature and is
often included in the measurements for satisfaction
(Parasuraman et al., 1985, Parasuraman et al., 2001,
Verhoef et al., 2009), we believe that customer
experience needs to be accounted for evaluating the
success of applying social media in the customer
service. This can be underlined by the contributions
of Holbrook and Hirschman (Holbrook and
Hirschman, 1982) and Berry et Al. (Berry et al.,
2002).
The second category customer interaction focuses on
the level customers engage themselves in the
communication process. Here the included
measurements shed light on the engagement
customers’ exhibit by communicating concerning a
topic via social media. Our construct is thereby
related to the customers’ engagement value by
Kumar et Al. (Kumar et al., 2010).
Closely related but focused on the activity level of
customers in taking on responsibilities for the
company we set up customer activation as a
measurement for the success of the social media use
in customer service. An actual benefit of the social
media application can only be reached if customers
actively participate and create contents themselves.
Thus we follow here the reasoning by Kellog et Al.
who even before the emergence of social media
already argued that customer participation is central
to the service success (Kellogg et al., 1997). Newer
literature like Kärkkäinen stresses the importance of
considering the level of interaction as a measure for
WEBIST2015-11thInternationalConferenceonWebInformationSystemsandTechnologies
338

the success of the so called “social Customer
learning” (Kärkkäinen et al., 2012).
Finally we consider the classic concept customer
satisfaction according to the service dominant logic
(Parasuraman et al., 1985, Anderson et al., 1997). It
has been proven that customer satisfactions
positively affects customer loyalty and thus
repurchase rates (Flint et al., 2011). We consider the
concept of customer satisfaction as the overall
evaluation based on the total purchase and
consumption experiences with a service over time
(Fornell et al., 1996).
Adding up the four aforementioned dimensions
customer experience, customer interaction, customer
activation and customer satisfaction we can describe
the customer perspective fully. However we need in
future to evaluate our concepts and to determine
whether these concepts are sufficiently disjoint and
not correlated.
Furthermore we consider finance related metrics as
an important factor to determine the success of the
social media use. Since these metrics are however
difficult to measure and many repercussions of
social media cannot be detected by financial
measures we accept that it could give us only limited
insights. Going back to the discussion whether there
is an ROI for social media (Etlinger et al., 2012,
Kelly, 2012, Spillecke, 2013) we argue that it can
give us only limited insights and needs to be
combined with the aforementioned customer
perspective,
Finally we see reach as an important indicator for
the success of social media application in the
customer service. As long as a social media
supported customer service does not achieve a
sufficient reach, no positive impact on the customer
service performance can be expected. However
reach does not translate immediately in service
transactions (Hanna et al., 2011, Kietzmann et al.,
2011). Thus reach must be combined with our other
dimensions.
2.1 Customer Experience
The first category customer experience contains the
following metrics (Table 2):
84% of companies believe that the extraction of
information on customers, their needs and
expectations as well as their perception of products
is the most valuable result of social media used in
customer service (Etlinger et al., 2012). That is why
we chose four metrics which deal specifically with
customer sentiment of a subject, idea or product.
Customer and user perception can be measured by
semantic analysis tools, which examine the customer
comments on its positive or negative word content.
Up to this day, special cases such as irony or
rhetorical questions are not yet able to be
recognized, which is why future improvements are
necessary (Sterne, 2010, Lovett, 2011).
From the customer service’s perspective, measuring
success in terms of customer satisfaction is of
particular importance. The perception of service
quality by the customer is also crucial for its future
behavior: A customer who is satisfied with the
customer service is most likely willing to pay a
higher price for a product or service. It is also very
likely that a satisfied customer recommends the
company and its customer service to other potential
new customers, which is crucial for a company’s
public image.
2.2 Customer Interaction
The second category customer interaction contains
seven metrics (Table 3):
Customer interaction is a very important metric for
social media because the classic Shannon-Weaver-
Communication-Model (Kuhlmann and Sauter,
2008) is replaced with Many-to-Many
Communication in a social media context (Neeb and
Wörnle, 2011). Communication is the key word on
which we evaluated the metrics we used in this
category. All the metrics deal with communication
between company and user or user and user. The
interaction between customers and company
contains highly valuable information on how
customers see a brand, what they think about the
company, the product and the company’s services. If
a customer approves of these company qualities, it is
likely that he forms a stronger brand loyalty, because
he will be able to identify himself with the values of
the company and is therefore likely to keep on using
this specific company’s products and services.
2.3 Customer Activation
The use of social media exchanges between different
customers in the form of so-called digital word of
mouth is becoming more and more important
(Altobelli and Schwarzenberger, 2013, Bock, 2012,
Esch et al., 2012). This is because a customer’s
recommendations and experiences can be read by a
large number of people worldwide, who always need
to be thought of as potential future customers. High
customer activation therefore provides
organizations with the chance to let customers
participate in the performance process and to
SocialMediaAnalyticsinCustomerService:ALiteratureOverview-AnOverviewofLiteratureandMetricsRegarding
SocialMediaAnalysisinCustomerService
339

outsource tasks (also called externalization) (Bruhn
and Meffert, 2012) The outsourcing of tasks means
that a customer can, for example, provide so-called
customers help customers services (Dimitrova et al.,
2011) and therefore becomes part of the customer
services tasks. The measurement of customer
activation can shed light on opportunities of such
externalization. The metrics of this category can be
found in Table 4.
2.4 Customer Satisfaction
The third category customer satisfaction contains
the four measurable metrics which can be found in
Table 5.
Customer satisfaction is a key determinant of
customer loyalty, which in turn can affect the
companies’ economic success and the ROI (Bruhn
and Meffert, 2012). This category focuses on
customer service requests. The four metrics we
chose deal with effectiveness, efficiency rating and
utilization of customer service. Specifically, the
resolution of customer requests is examined
individually by the KPI Issue Resolution Rate,
Resolution Time and Social Service Level in this
category. These three metrics should give an
excellent overview of the customer service itself.
An increase in the benefit for the customer in terms
of customer satisfaction will lead to an increase in
the value of the company. A
NDERSON even measures
this metric specifically: An increase in customer
satisfaction by one percentage increases the return
on investment (ROI) by 2.31 percentage points. A
reduction of one percentage though causes a
decrease of the ROI by 5.08 percentage points
(Anderson and Mittal, 2000). This means: an
increase of any of the variables mentioned in this
category implies a certain increase for the ROI of
that company.
2.5 Finance
In addition to strengthening the relationship between
customers and businesses, generating more sales is
always a fundamental goal of social media use in the
field of external corporate communications (Etlinger
et al., 2012). The financial metrics (Table 6) provide
information about the company’s profitability. The
costs for social media marketing tools are easy to
calculate, but revenues generated by social media
are rarely precisely quantifiable. A broad social
media appearance often contributes indirectly to a
company´s turnover, for example by strengthening
the company’s positive public image.
2.6 Reach
The category reach provides information on how
many users can potentially be reached with social
media and a specific social media channel as well as
the speed with which a digital contribution is spread
by social media users. For this category we chose
five metrics (Table 7).
By choosing these KPI we try to get an overall
estimation about how many customers and potential
customers are reached at the current moment and
about how many customers potentially can be
reached. Furthermore the KPI and variables interact
and influence each other. The KPI Reach can also be
found in the KPI Velocity but in a different
circumstance. For Velocity the Reach needs to be
already calculated because it is a variable for the
calculation of Velocity.
To use social media channels more efficiently and to
investigate which channel is the optimal one for the
aimed purpose, it is essential to be able to determine
key figures such as the Share of Voice, Unique
Contributors, Reach, Velocity and Virality, as shown
in table 5 (Lovett, 2011).
Table 2: Customer experience.
Metric Description Formula
Sentiment
Type
Absolute number of positive, neutral or negative statements about a subject (Product, Brand etc.)
(Weinberg et al., 2012, Fiege, 2012, Sterne, 2010 77ff.).
numbero
f
positive
neutral, negative
references
Sentiment
Ratio
The ratio of positive (or neutral / negative) comments compared to the total number of statements
on the matter. This metric defines the overall opinion of users on a topic (Lovett, 2011, Owyang
and Li, 2011, Sponder, 2011, Kelly, 2012, Dörfel and Schulz, 2011).
posit.
neutr. , negat.
references
allreferences
Topic
Trends
Percentage of how often a specific subject is mentioned in a relevant segment. This metric allows
for an early identification of trends (Owyang and Lovett, 2010, Lovett, 2011, Greve, 2011).
numbero
f
references
o
f
thesubject
allreferences in the
relevantsegment
Idea Impact
Acceptance / enthusiasm of the interacting user for an issue or an idea (Owyang and Lovett, 2010,
Lovett, 2011, Greve, 2011).
numbero
f
positive
references
numbero
f
allreferenc
WEBIST2015-11thInternationalConferenceonWebInformationSystemsandTechnologies
340

Table 3: Customer interaction.
Metric Description Formula
Conversation
Buzz
Measure of the reactions (answers, likes, tweets, etc.) published on an issue (Fiege,
2012).
numbero
f
reactions to a
topic
Conversation
Volume
Scope of user interests in the dialogue at all (Fiege, 2012).
numbero
f
posts in
involvedsocialmedia
Engagement
Estimate of the degree and extent of a person's interest in a topic. (Lovett, 2011, Werner,
2013)
user × time × comments
×sharedcontent
Audience
Engagement
Proportion of visitors who actively participate in a marketing campaign by commenting,
sharing or forwarding.(Owyang and Lovett, 2010, Lovett, 2011, Greve, 2011, Dörfel and
Schulz, 2011)
comments
shares links
totalno. o
f
views
Conversation
Reach
Scope of the dialogue: ratio of participating users to the total number of potential users
(Owyang and Lovett, 2010, Fiege, 2012) (Dörfel and Schulz, 2011).
participatinguser
totalnumbero
f
potentialusers
Interaction
Rate
Percentage of users who access content and interact with it.(Lovett, 2011)
views
activit
y
Conversion
Rate
Specifies how many prospective buyers become buyers. (Lovett, 2011, Peterson, 2004)
numbero
f
goal
achievement
vi
s
i
ts
Table 4: Customer activation.
Metric Description Formula
Active Advocates
Expresses how many advocates of the brand (product, etc.) were active in a
fixed period of time and recommended the product / service. (Owyang and
Lovett, 2010, Lovett, 2011, Greve, 2011, Dörfel and Schulz, 2011)
activeadvocates
inafixedperiodo
f
time
totalnumbero
f
advocates
Advocate Influence
(Level of Influence)
Assesses the impact of an advocate statement on the opinion of others. (Owyang
and Lovett, 2010, Fiege, 2012, Lovett, 2011, Greve, 2011)
uniqueadvocateinfluence
totaladvocateinfluence
Advocacy Impact
Specifies the effect of the contributions of active advocates on others. (Owyang
and Lovett, 2010, Lovett, 2011, Fiege, 2012).
numbero
f
advocac
y
driven
conversions
totalvolumeo
f
advocac
y
traffic
Table 5: Customer satisfaction.
Metric Description Formula
Issue Resolution
Rate
Evaluates the effectiveness of social media use. (Owyang and Lovett, 2010, Lovett,
2011, Fiege, 2012, Greve, 2011)
satisfactorilyanswered
servicerequests
totalnumbero
f
servicerequests
Resolution Time
Shows efficiency of the social media service. (Owyang and Lovett, 2010, Lovett, 2011,
Fiege, 2012, Greve, 2011)
totalresponsetime to
servicerequests
totalnumbero
f
servicerequests
Satisfaction
Score
Percentage of customers who gave a certain rating (positive, negative, neutral) for
content / a feature (Owyang and Lovett, 2010, Lovett, 2011).
customerratingA, B, C …
totalnumber o
f
customerratings
Social Service
Level
Measure of the efficiency and utilization of social media customer service (Etlinger,
2011).
resolvedservicerequests
pertime
totalnumbero
f
open
servicerequest
Table 6: Finance.
Metric Description Formula
Average Cost per
Visitor
Average cost per acquired visitors. This includes not only cost of
acquisition but also includes payments for banner advertising, television
advertising, etc.(Peterson, 2006).
sum o
f
acquisitionmarketing
cost
numbero
f
visitors
Average Cost per
Visit
Average cost per visit by an acquired visitor. (Peterson, 2006)
sum o
f
acquisitionmarketing costs
numbero
f
visits
Average Revenue
per User
Average revenue per user. (Deloitte, 2010, Peterson, 2006)
sumo
f
revenuegenerated
numbero
f
visitors
SocialMediaAnalyticsinCustomerService:ALiteratureOverview-AnOverviewofLiteratureandMetricsRegarding
SocialMediaAnalysisinCustomerService
341

Table 7: Reach.
Metric Description Formula
Share of
Voice
Relative number of references of its own brand in proportion to the number of all
reference to a brand in a defined competitive environment. (Owyang and Lovett, 2010,
Fiege, 2012, Werner, 2013, Lovett, 2011, Bock, 2012, Weinberg et al., 2012, Sponder,
2011, Schmitz-Axe et al., 2012, Kelly, 2012, Dörfel and Schulz, 2011).
referenceso
f
ownbrand
allreferencesinadefined
competetiveenvironment
Unique
Contributors
Total number of participating users (regardless of the number of accounts). (Lovett, 2011).
totalnumbero
f
participatingusers
Reach
Estimation of the potential audience size. (Lovett, 2011, Sponder, 2011).
numbero
f
directusers ×
networ
k
o
f
users
Velocity
Indicates how quickly and to what extent news spread on the Internet. (Lovett, 2011)
reach × time
Virality
Expresses how quickly and to what extent a discussion is spreading. (Fiege, 2012, Werner,
2013)
numbero
f
threads to
atopic
time
3 CRITICAL ANALYSIS
The research in this paper shows that the already
existing literature on the topic of social media
provides a number of metrics and key figures for the
use of social media in customer services. These need
to be categorized in order to develop an adequate
balanced scorecard. The given summary was
researched in great detail, but it is impossible to
claim that every social media metric was analyzed
and categorized. This is due to the fact that new
ways of data capturing are invented almost on a
monthly basis.
The six categories which were established in this
paper are based on an analysis of the service and
social media literature. It is planned to translate the
framework by applying simulation modelling into a
standardized model which empirically proves the
developed concept. However this would go beyond
the constraints of this paper. This is why we strongly
recommend further research on this topic. We are
fully aware that developing an empirical model
could lead up to some changes in the categories and
assumed cause and effect relationships. Our aim in
this paper was to present a first guideline for
developing a customer service scorecard for the use
of social media.
4 CONCLUSIONS AND FUTURE
RESEARCH PROSPECTS
The key figures in the current literature should
enable companies to evaluate their social media use.
However, the allocation of the indicators is not yet
structured, which among other things is reflected by
the fact that up to 90% of companies which are
currently using social media claim that they are not
able to rate how useful their social media work
actually is (Conrad Caine GmbH and Universität
St.Gallen - Institut für Marketing, 2011, Spillecke,
2013, Bock, 2012).
The existing literature is already well fit to develop
some first assumptions developing a balanced
scorecard for applying social media in customer
service. This paper lays the groundwork for future
research in terms of literature overview and
categorization. How and to what extent these
metrics, KPI and variables influence each other and
how the scores should be calculated are the
questions which should be answered by future
projects.
For future research it is advisable to develop the
model further on the research done in this paper.
REFERENCES
Altobelli, C. F. And Schwarzenberger, M. 2013. Social
Media-Strategien Bei Dienstleistungsuntemehmen -
Entwicklung Und Implementierung Mittels Einer
Social Media-Scorecard. In: Bruhn, M. And Hadwich,
K. (Eds.) Dienstleistungsmanagement Und Social
Media: Potenziale, Strategien Und Instrumente Forum
Dienstleistungsmanagement. Wiesbaden: Springer
Verlag.
Anderson, E. W., Fornell, C. And Rust, R. T. 1997.
Customer Satisfaction, Productivity, and Profitability:
Differences between Goods and Services. Marketing
Science, 16, 129-145.
Anderson, E. W. And Mittal, V. 2000. Strengthening the
Satisfaction-Profit Chain. Journal of Service Research,
3, 107-120.
Berry, L. L., Carbone, L. P. And Haeckel, S. H. 2002.
Managing the Total Customer Experience. Mit Sloan
Management Review, Spring 2002.
WEBIST2015-11thInternationalConferenceonWebInformationSystemsandTechnologies
342

Blanchard, O. 2011. Social Media Roi - Managing and
Measuring Social Media Efforts in Your Organization,
Boston, Pearson Education.
Bock, A. H. 2012. Kundenservice Im Social Web, Köln,
O'reilly Verlag Gmbh And Company.
Bruhn, M. And Meffert, H. 2012. Handbuch
Dienstleistungsmarketing - Planung - Umsetzung -
Kontrolle, Wiesbaden, Gabler.
Conrad Caine Gmbh And Universität St.Gallen - Institut
Für Marketing 2011. Social Media Excellence 12.
München: Conrad Caine Gmbh.
Deloitte 2010. Klasse Statt Masse? Kenzahlen Zur
Steuerung Des Online-Geschäfts. Deloitte.
Dimitrova, T., Kolm, R. And Steiml, B. 2011.
Praxisleitfaden Im Kundenservice - Smart Service Im
Social Web. Meerbusch: Mind Business Consultants.
Dörfel, L. And Schulz, T. (Eds.) 2011. Social Media In
Der Unternehmenskommunikation, Berlin: Scm,
Prismus Communications.
Esch, F.-R., Von Einem, E., Gawlowski, D., Isenberg, M.
And Rühl, V. 2012. Vom Konsumenten Zum
Markenbotschafter—Durch Den Gezielten Einsatz
Von Social Media Die Konsumenten An Die Marke
Binden. In: Schulten, M. (Ed.) Social Branding.
Springer.
Etlinger, S. 2011. A Framework for Social Analytics.
Altimeter Group. Usa. Published On, 10, 39.
Etlinger, S., Owyang, J. And Jones, A. 2012. The Social
Media Roi Cookbook: Six Ingredients Top Brands Use
To Measure The Revenue Impact Of Social Media.
San Mateo: Altimeter Group.
Eysenbach, G. 2011. Can Tweets Predict Citations?
Metrics of Social Impact Based On Twitter and
Correlation with Traditional Metrics Of Scientific
Impact. Journal of Medical Internet Research, 13.
Feinberg, R. A., Kim, I.-S., Hokama, L., De Ruyter, K.
And Keen, C. 2000. Operational Determinants of
Caller Satisfaction in the Call Center. International
Journal of Service Industry Management, 11, 131-141.
Fiege, R. 2012. Social Media Balanced Scorecard -
Erfolgreiche Social Media-Strategien In Der Praxis,
Wiesbaden, Springer Vieweg.
Flint, D. J., Blocker, C. P. And Boutin Jr, P. J. 2011.
Customer Value Anticipation, Customer Satisfaction
and Loyalty: An Empirical Examination. Industrial
Marketing Management, 40, 219-230.
Fornell, C., Johnson, M. D., Anderson, E. W., Cha, J. And
Bryant, B. E. 1996. The American Customer
Satisfaction Index: Nature, Purpose, and Findings. The
Journal of Marketing, 60, 7-18.
Greve, G. 2011. Social Crm–Zielgruppenorientiertes
Kundenmanagement Mit Social Media. Online
Targeting Und Controlling. Springer.
Hanna, R., Rohm, A. And Crittenden, V. L. 2011. We’re
All Connected: The Power of the Social Media
Ecosystem. Business Horizons, 54,
265-273.
Haustein, S., Larivière, V., Thelwall, M., Amyot, D. And
Peters, I. 2014. Tweets Vs. Mendeley Readers: How
Do These Two Social Media Metrics Differ? It-
Information Technology, 56, 207-215.
Holbrook, M. B. And Hirschman, E. C. 1982. The
Experiential Aspects of Consumption: Consumer
Fantasies, Feelings, and Fun. Journal of Consumer
Research, 9, 132-140.
Jaiswal, A. K. 2008. Customer Satisfaction and Service
Quality Measurement in Indian Call Centres.
Managing Service Quality, 18, 405-416.
Kärkkäinen, H., Jussila, J. J. And Leino, M. 2012.
Learning From and With Customers with Social
Media: A Model for Social Customer Learning.
International Journal of Management, Knowledge and
Learning, 1, 5-25.
Kellogg, D. L., Youngdahl, W. E. And Bowen, D. E.
1997. On the Relationship between Customer
Participation and Satisfaction: Two Frameworks.
International Journal of Service Industry
Management, 8, 206-219.
Kelly, N. 2012. How To Measure Social Media: A Step-
By-Step Guide To Developing And Assessing Social
Media Roi, New Jersey, Pearson Education.
Kietzmann, J. H., Hermkens, K., Mccarthy, I. P. And
Silvestre, B. S. 2011. Social Media? Get Serious!
Understanding the Functional Building Blocks of
Social Media. Business Horizons, 54, 241-251.
Kim, H.-S. And Kim, Y.-G. 2008. A CRM Performance
Measurement Framework: Its Development Process
and Application. Industrial Marketing Management,
38, 477-489.
Kuhlmann, A. And Sauter, W. 2008. Innovative
Lernsysteme. Kompetenzentwicklung Mit Blended
Learning Und Social Software, Berlin, Springer
Verlag.
Kumar, V., Aksoy, L., Donkers, B., Venkatesan, R.,
Wiesel, T. And Tillmanns, S. 2010. UndervaluedoOr
Overvalued Customers: Capturing Total Customer
Engagement Value. Journal of Service Research, 13,
297-310.
Leung, D., Law, R., Van Hoof, H. And Buhalis, D. 2013.
Social Media in Tourism and Hospitality: A Literature
Review. Journal of Travel and Tourism Marketing,
30, 3-22.
Lovett, J. 2011. Social Media Metrics Secrets,
Indianapolis, Wiley.
Michaelidou, N., Siamagka, N. T. And Christodoulides, G.
2011. Usage, Barriers and Measurement of Social
Media Marketing: An Exploratory Investigation of
Small and Medium B2b Brands. Industrial Marketing
Management, 40, 1153-1159.
Neeb, H.-P. And Wörnle, S. 2011. Social Media Im
Marketing. In: Dörfel, L. (Ed.) Social Media In Der
Unternehmenskommunikation. Berlin: Scm Primus
Gmbh.
Owyang, J. And Li, C. 2011. How Corporations Should
Prioritize Social Business Budgets. San Mateo:
Altimeter Group.
Owyang, J. And Lovett, J. 2010. Social Marketing
Analytics - A New Framework for Measuring Results
in Social Media. San Mateo: Altimeter Group.
Parasuraman, A., Zeithaml, V. A. And Berry, L. L. 1985.
A Conceptual Model of Service Quality and Its
SocialMediaAnalyticsinCustomerService:ALiteratureOverview-AnOverviewofLiteratureandMetricsRegarding
SocialMediaAnalysisinCustomerService
343

Implications for Future Research. The Journal of
Marketing, 49, 41-50.
Parasuraman, A., Zeithaml, V. A. And Berry, L. L. 2001.
Servqual - A Multiple-Item Scale for Measuring
Consumer Perceptions of Service Quality. Journal of
Business Research, 54, 161.
Peters, K., Chen, Y., Kaplan, A. M., Ognibeni, B. And
Pauwels, K. 2013. Social Media Metrics—A
Framework And Guidelines For Managing Social
Media. Journal of Interactive Marketing, 27, 281-298.
Peterson, E. T. 2004. Web Analytics Demystified: A
Marketer's Guide To Understanding How Your Web
Site Affects Your Business, Portland, Celilo Group
Media.
Peterson, E. T. 2006. The Big Book of Key Performance
Indicators [Online]. Portland: Web Analytics
Demystified.
Schmitz-Axe, A., Wilkoszewski, A. And Többens, T.
2012. Social Brand Controlling—Chancen Und
Herausforderungen Von Measurement. In: Schulten,
M. (Ed.) Social Branding Strategien - Praxisbeispiele
- Perspektiven. Wiesbaden: Springer Gabler.
Spillecke, D. 2013. Social Media Roi: Erfolge Messen In
Sozialen Netzwerken. Controlling and Management
Review, 57, 26-35.
Sponder, M. 2011. Social Media Analytics: Effective Tools
for Building, Interpreting, and Using Metrics, New
York, Mcgraw-Hill.
Sterne, J. 2010. Social Media Metrics: How to Measure
and Optimize Your Marketing Investment, Hoboken,
New Jersey, John Wiley and Sons, Inc.
Verhoef, P. C., Lemon, K. N., Parasuraman, A.,
Roggeveen, A., Tsiros, M. And Schlesinger, L. A.
2009. Customer Experience Creation: Determinants,
Dynamics and Management Strategies. Journal of
Retailing, 85, 31-41.
Weinberg, T., Pahrmann, C. And Ladwig, W. 2012. Social
Media Marketing: Strategien Für Twitter, Facebook
And Co, Köln, O'reilly Verlag.
Werner, A. 2013. Social Media - Analytics And
Monitoring: Verfahren Und Werkzeuge Zur
Optimierung Des Roi, Heidelberg, Dpunkt.Verlag
Gmbh.
WEBIST2015-11thInternationalConferenceonWebInformationSystemsandTechnologies
344
