
Automatic Text Difficulty Classifier
Assisting the Selection Of Adequate Reading Materials For European Portuguese
Teaching
Pedro Curto
1,2
, Nuno Mamede
1,2
and Jorge Baptista
1,3
1
Instituto Superior T
´
ecnico, Universidade de Lisboa, Av. Rovisco Pais, 1049-001 Lisboa, Portugal
2
INESC-ID Lisboa/L2F – Spoken Language Lab, R. Alves Redol, 9, 1000-029 Lisboa, Portugal
3
Universidade do Algarve/FCHS and CECL, Campus de Gambelas, 8005-139 Faro, Portugal
Keywords:
Readability, Readability Assessment Metrics, Automatic Readability Classifier, Linguistic Features Extrac-
tion, Portuguese.
Abstract:
This paper describes a system to assist the selection of adequate reading materials to support European Por-
tuguese teaching, especially as second language, while highlighting the key challenges on the selection of
linguistic features for text difficulty (readability) classification. The system uses existing Natural Language
Processing (NLP) tools to extract linguistic features from texts, which are then used by an automatic read-
ability classifier. Currently, 52 features are extracted: parts-of-speech (POS), syllables, words, chunks and
phrases, averages and frequencies, and some extra features. A classifier was created using these features and
a corpus, previously annotated by readability level, using a five-levels language classification official standard
for Portuguese as Second Language. In a five-levels (from A1 to C1) scenario, the best-performing learning
algorithm (LogitBoost) achieved an accuracy of 75.11% with a root mean square error (RMSE) of 0.269. In
a three-levels (A, B and C) scenario, the best-performing learning algorithm (C4.5 grafted) achieved 81.44%
accuracy with a RMSE of 0.346.
1 INTRODUCTION
The selection of adequate reading materials for ed-
ucational purposes is an important task for teach-
ing languages, since giving students reading mate-
rials that are “too difficult” or “too easy” can both
hinder the learning process and demotivate the stu-
dents (Fulcher, 1997). This task implies measuring
the text readability, or text difficulty, which remains
today a relevant research topic, and in the case of Por-
tuguese language teaching, it is still performed mostly
manually.
This paper presents an automatic classifier for Eu-
ropean Portuguese texts, based on a variety of linguis-
tic features. It seeks to assist the selection of adequate
reading materials for teaching European Portuguese,
especially as a second language, adjusting them to
different language proficiency levels. However, as-
signing readability scores to texts is also important in
other areas, such as in the production of medical in-
formation, tools and software manuals, safety instruc-
tions, etc., whose correct interpretation is essential to
avoid different types of risk and to make such texts
accessible reading to the majority of the population.
The extraction of linguistic features from texts is a
core task in the creation of automatic readability clas-
sifiers. Text readability is affected, among other fac-
tors, both by lexical difficulty (the vocabulary level)
and by the syntactic difficulty (the sentence complex-
ity) (Klare, 1963). This paper presents a system that
automatically extracts linguistic features from Por-
tuguese texts and an automatic readability classifier
for European Portuguese texts. To accomplish this,
the system uses existing Natural Language Process-
ing (NLP) tools, a parser and an hyphenator, and two
corpora, previously annotated by readability level.
Currently, the system extracts 52 features, grouped
in 7 groups: parts-of-speech (POS), syllables, words,
chunks and phrases, averages and frequencies, and
some extra features.
Two experiments were carried out to evaluate the
classification task: one based on a five-levels scale
(A1, A2, B1, B2, C1), taken from the Framework for
Teaching Portuguese Abroad (in Portuguese, Quadro
de Refer
ˆ
encia para o Ensino de Portugu
ˆ
es no Es-
36
Curto P., Mamede N. and Baptista J..
Automatic Text Difficulty Classifier - Assisting the Selection Of Adequate Reading Materials For European Portuguese Teaching.
DOI: 10.5220/0005428300360044
In Proceedings of the 7th International Conference on Computer Supported Education (CSEDU-2015), pages 36-44
ISBN: 978-989-758-107-6
Copyright
c
2015 SCITEPRESS (Science and Technology Publications, Lda.)

trangeiro, QuaREPE)
1
, published by the Portuguese
Ministry of Education and Science (Grosso et al.,
2011b), and a second experiment based in a simpli-
fied three-levels scale (A, B and C).
The paper is organized as follows: first, some re-
lated work is presented (Section 2), and then the Nat-
ural Language Processing tools here used (Section 3),
followed by the features extracted from the text (Sec-
tion 4) and the automatic readability classifier here
developed (Section 5). Finally, the evaluation (Sec-
tion 6) is presented, followed by the conclusions and
perspectives for future work (Section 7).
2 RELATED WORK
There are several works on the topic of feature
extraction for predicting the readability of docu-
ments. For English, early approaches consisted only
in measuring simple features like the average sen-
tence length, average number of syllables per word,
etc. These methods include metrics such as Flesch
Reading Ease (Flesch, 1943), the Fog Index (Gun-
ning, 1952; Gunning, 1969), the Fry Graph (Fry,
1968) and the SMOG (“Simple Measure of Gobbley-
gook”) (McLaughlin, 1969). In general, these meth-
ods do not take into account the content of documents,
which was only later considered for readability met-
rics, when some systems used a pre-determined list
of words to predict the reading difficulty, such as the
Lexile (Stenner, 1996) measure. More recently, lan-
guage models have been used instead for this task,
such as unigram language models, trained to predict
the reading difficulty of English documents (Thomp-
son and Callan, 2004). Other methods used syntactic
features in addition to the language models (Schwarm
and Ostendorf, 2005), while some approaches (Pitler
and Nenkova, 2008) relied on a variety of linguistic
features, namely lexical, syntactic and discourse rela-
tions, in order to improve the classification.
Regarding the systems developed for Portuguese
that are able to assess the readability of texts based
on linguistic features’ extraction, one can refer
REAP.PT
2
(Marujo et al., 2009) (“REAder-specific
Practice for Portuguese”), a tutoring system for Euro-
pean Portuguese vocabulary learning, which has been
developed from the REAP system (Brown and Eske-
nazi, 2004) (English). Its readability measurement
1
http://www.dgidc.min-edu.pt/outrosprojetos/
data/outrosprojectos/Portugues/Documentos/
manual quarepe orientador versao final janeiro 2012.pdf
(accessed in Dec. 2014).
2
http://call.l2f.inesc-id.pt/reap.public (accessed in Dec.
2014).
task is based on lexical features, such as statistics of
word unigrams. It achieved an adjacent accuracy of
87.60% and an RMSE of 0.676 on 10-fold cross val-
idation. LX-CEFR
3
(Branco et al., 2014) is yet an-
other system to select adequate materials for creating
exams for teaching European Portuguese as second
language. Its readability measurement task is based
on the Flesch Reading Ease formula, frequency of
nouns, average syllables per word, and average words
per sentence. It achieved an maximum accuracy of
30% on 10-fold cross validation, while only using the
average number of syllables per word in the classifi-
cation task.
3 NATURAL LANGUAGE
PROCESSING TOOLS
To aid the extraction of features from European Por-
tuguese texts, the system uses the natural language
processing chain STRING
4
(Statistical and Rule-
Based Natural Language Processing chain) (Mamede
et al., 2012) to extract statistical information about the
texts. The number of syllables is extracted using the
hyphenator YAH (Yet Another Hyphenator) (Figueir-
inha, 2013).
STRING (Mamede et al., 2012) is an hybrid statis-
tical and rule-based natural language processing chain
for Portuguese, which has been developed by L2F-
Spoken Language Laboratory, at INESC-ID Lisboa.
STRING has a modular structure and performs all
the basic NLP tasks, namely tokenization and text
segmentation, part-of-speech tagging, rule-based and
statistical morphosyntactic disambiguation, shallow
parsing (chunking) and deep parsing (dependency ex-
traction). For parsing, the system uses XIP
5
(A
¨
ıt-
Mokhtar et al., 2002) (Xerox Incremental Parser), a
rule-based parser, whose European Portuguese gram-
mar was jointly developed with XEROX.
The YAH Hyphenator (Figueirinha, 2013) is a
tool that has been developed by L2F-Spoken Lan-
guage Laboratory, at INESC-ID Lisboa, originally de-
signed by Ricardo Ribeiro and later improved by Pe-
dro Figueirinha. This is a rule-based system that ap-
plies various word processing division rules.
3
http://nlx.di.fc.ul.pt/ jrodrigues/camoes/ indexLXCEN-
TER.html?exemplo (accessed in Dec. 2014).
4
https://string.l2f.inesc-id.pt (accessed in Dec. 2014).
5
Reference Guide: https://open.xerox.com/Repo/service/
XIPParser/public/XIPReferenceGuide.pdf (accessed in
Dec. 2014).
AutomaticTextDifficultyClassifier-AssistingtheSelectionOfAdequateReadingMaterialsForEuropeanPortuguese
Teaching
37

4 FEATURES
The set of 52 features extracted by the system con-
sists in: (i) part-of-speech (POS) tags, chunks, words
and sentences features; (ii) verb features and differ-
ent metrics involving averages and frequencies; (iii)
several metrics involving syllables; and (iv) extra fea-
tures. The features of group (i) are extracted from the
chunking tree generated by STRING; features from
groups (ii) and (iv) are also extracted from the chunk-
ing tree, but complemented by the dependencies’ in-
formation generated by the processing chain; the met-
rics related to syllables (iii) are extracted using YAH.
The feature set used is present in appendix section.
For lack of space, only a sketch of the rationale
behind these features is provided below; see (Curto,
2014) for details.
The system calculates the part-of-speech (POS)
relative percentages. Conceptual information, often
introduced through nouns and named entities, e.g.
people’s names, locations, organizations, etc., is im-
portant in text comprehension, yet the more entities
and types of entities a text has, the harder it is to keep
track of them and of the relations between them.
Statistics about elementary syntactic constituents
(or chunks: nominal phrases - NP, prepositional
phrases - PP, etc.) are also extracted. Auxiliary verb
chunks (Baptista et al., 2010) can combine among
them to form longer, complex verbal chains: the
longer the chain, the more complex is the decoding of
the grammatical values involved. Subclause chunks
are related to sentence hypotaxis complexity (Bea-
man, 1984), while the number of coordination rela-
tions and the length of their chains are related with
the parataxis complexity.
The length of a text is related with its readability,
i.e. typically, longer texts, specially with long sen-
tences, have much more detail or content, which can
make them more difficult to understand. Word fre-
quency is related to the vocabulary use and, accord-
ing to (Thompson and Callan, 2004), it can affect the
readability of a text: texts with more familiar vocabu-
lary are easier to understand by the reader. Word fre-
quency has been captured by way of a unigram-based
language model, defined by:
∑
w
C(w) × log(P(w|M)) (1)
where P(w|M) is the probability of word w according
to a background corpus M, and C(w) is the number of
times w appears in the text. This model will be biased
in favor of shorter texts. Since each word has prob-
ability less than 1, the log-probability of each word
is less than 0, and hence including additional words
decreases the log-likelihood. To overcome this issue,
the system calculates this probability in n groups of 50
words each and then calculates an average of the n re-
sults. The calculations were performed using Laplace
smoothing over the word frequencies, obtained from a
set of several, distinct European Portuguese corpora,
provided by the AC/DC project and available at Lin-
guateca.
Based on previous statistics, the system then ex-
tracts several averages and frequencies. The fre-
quency of nouns is the ratio of the number of nouns
per number of words, and a similar ratio is calculated
for the verbs. The average number of verb phrases per
sentence and the average length of sentences derive
from Pitler and Nenkova (Pitler and Nenkova, 2008):
the more verbs a sentence contains and the longer a
sentence is, the more complicated it becomes to un-
derstand it. The average length of syllables per word
is deemed important for readability metrics such as
the Flesch Reading Ease and others metrics (see §2).
The number of pronouns per noun phrases derives
from CohMetrixPort system (Scarton and Alu
´
ısio,
2010). The greater the number of pronouns per
noun phrases, the more difficult it becomes to iden-
tify whom or what the pronoun refers to. The use
of NP with a definite or demonstrative determiner
usually implies a process of reference resolution, as
opposed to indefinite determiners, which do not re-
fer to previously occurring words. A text with lower
definite/indefinite NP ratio should be more cohesive,
hence the anaphora processing involved renders its
decoding more difficult.
The feature extraction system was evaluated on a
manually annotated text, with 490 words and 14 sen-
tences taken from journalistic texts. For lack of space
detailed analysis can not be made here. The system
achieve 98.81% of precision, 98.88% recall and a F-
measure (F) of 98.85%.
The feature set is largely language-independent,
though some features require adequate NLP tools
(e.g. chunking), while others depend on the mor-
phosyntactic properties of the language (e.g. auxiliary
verb types). Specific language-dependent features, to
be explored in future work, relate mostly to syntac-
tic dependencies (e.g. modifier, adjunct), but they can
be approximated using broad interpretation of those
relations.
5 READABILITY CLASSIFIER
According to the Framework for Teaching Por-
tuguese Abroad (in Portuguese, Quadro de Re-
fer
ˆ
encia para o Ensino de Portugu
ˆ
es no Estrangeiro,
CSEDU2015-7thInternationalConferenceonComputerSupportedEducation
38

Table 1: Corpus distribution.
A1 % A2 % B1 % B2 % C1 % Total
# Text 29 12.2 39 16.5 136 57.4 14 5.9 19 8.0 237
# Sentences 184 11.9 384 24.7 535 34.5 199 12.8 250 16.1 1 552
# Words 2,655 10.3 5,010 19.4 9,407 36.3 3,702 14.2 5,114 19.8 25,888
QuaREPE) (Grosso et al., 2011b), published by the
Ministry of Education and Science, and based on
the international standards of the European Common
Reference Framework for Languages, it is considered
that the degree of proficiency in a foreign language
can be determined on a scale of five-levels: A1: ini-
tiation; A2: elementary; B1: intermediate; B2: upper
intermediate; and C1: advanced.
The system’s performance on the classification
task was evaluated with two experiments: one based
on this five-levels scale and a second experiment
based on a simplified three-levels scale, i.e., the clas-
sifier is trained to predict if the text belongs to level
A, B or C. This second experiment is useful because
distinguishing between the levels A1 and A2, or be-
tween B1 and B2, may be very difficult, even for a
specialist.
The corpus used to train the classifier consists of
a set of 237 texts, provided by the Instituto Cam
˜
oes
6
and previously classified according to their readabil-
ity. This corpus was created from tests, exams and
materials used for teaching European Portuguese as a
foreign language. The manual text readability clas-
sification takes into account reading and comprehen-
sion skills stipulated by the QuaREPE for each level.
Table 1 shows the corpus distribution for each read-
ability level. One should bear in mind that the uneven
distribution and the small size of some classes (and of
the corpus as a whole), are likely to have an impact on
the classifier, which is unavoidable due to the scarcity
of resources for this task.
6 EVALUATION
6.1 Readability Classifier
In both scenarios, several machine learning al-
gorithms available in WEKA machine learning
toolkit
7
(Bouckaert et al., 2013) were tested (Table 2
and 5). The evaluation was performed using 10-fold
cross-validation. The metrics chosen for measuring
the performance of the classifier were accuracy (per-
6
http://www.instituto-camoes.pt (accessed in Dec. 2014)
7
http://www.cs.waikato.ac.nz/ml/weka
(accessed in Dec. 2014).
centage of correctly classified instances), root mean
square error (RMSE), ROC area and Kappa statistics.
Additionally, a confusion matrix and algorithm per-
formance comparison are presented for each scenario.
6.1.1 Five-Levels Classification
The best-performing learning algorithm was the Log-
itBoost (Table 2).
Table 2: Algorithms comparison results (five-levels classi-
fier).
Algorithms Accuracy RMSE
Naive Bayes 68.35% 0.339
Support Vector Machines 70.04% 0.342
Logistic regression 59.07% 0.402
K-nearest neighbors learner 65.40% 0.368
K* 70.04% 0.339
AdaBoost 59.49% 0.360
LogitBoost 75.11% 0.269
Holte’s OneR 69.20% 0.351
C4.5 71.31% 0.323
C4.5 grafted 72.57% 0.319
Decision stumps 61.18% 0.297
Random Forest 70.04% 0.275
In this scenario, we also considered the adjacent
accuracy within 1 grade level as a useful evaluation
metrics. This is the percentage of predictions that are
equal to or show one level of difference to the manu-
ally assigned level. Measuring strict accuracy is con-
sidered too demanding because manually assigned la-
bels are not always consistent.
Table 3: Evaluation of the readability classifier (five-levels).
Accuracy RMSE ROC Area Kappa Adjacent Acc.
75.11% 0.269 0.918 0.590 91.98%
In this scenario (Table 3), the classifier correctly
classified 75.11% instances, e.g., 178 texts. It is in-
teresting to notice that for most texts, the assigned
level is either correct or mostly within one-level dif-
ference (Table 4). As expected, the adjacent accu-
racy is very high (91.98%) and the RMSE result is
low because the expected and the observed values are
close. The Kappa metric is a chance-corrected mea-
sure of agreement between the classifications and the
AutomaticTextDifficultyClassifier-AssistingtheSelectionOfAdequateReadingMaterialsForEuropeanPortuguese
Teaching
39
expected values, where 1.0 represents perfect agree-
ment. The Kappa value obtained (0.59) corresponds
to a moderate agreement, according to (Landis and
Koch, 1977).
Table 4: Confusion Matrix (five-levels).
Predicted class
A1 A2 B1 B2 C1
Actual class
A1 18 7 4 0 0
A2 2 27 10 0 0
B1 5 4 121 1 5
B2 0 0 4 2 8
C1 0 1 4 4 10
6.1.2 Three-Levels Classification
In this scenario, the best-performing learning algo-
rithm was the C4.5 grafed (Table 5), with a 81.44%
accuracy and 0.346 RMSE. The second best algo-
rithm, and with very similar results, was the Logit-
Boost, which achieved a lower accuracy than the C4.5
grafed (80.17%) despite having a lower RMSE value
(0.294). Since, in this scenario, the scale used has
only 3 levels, the RMSE value was considered less
significant than the accuracy value.
Table 5: Algorithms comparison results (three-levels clas-
sifier).
Algorithms Accuracy RMSE
Naive Bayes 75.11% 0.405
Support Vector Machines 75.11% 0.363
Logistic regression 70.46% 0.439
K-nearest neighbors learner 72.15% 0.428
K* 77.22% 0.385
AdaBoost 68.78% 0.352
LogitBoost 80.17% 0.294
Holte’s OneR 73.84% 0.418
C4.5 80.17% 0.352
C4.5 grafted 81.44% 0.346
Decision stumps 70.89% 0.347
Random Forest 79.75% 0.295
Table 6: Evaluation of the readability classifier (three-
levels).
Accuracy RMSE ROC Area Kappa
81.44% 0.346 0.831 0.639
The three-levels classification (Table 6) achieved
a better accuracy (86.32%) and obtained RMSE and
ROC area values similar to the previously mentioned
classifier. In this scenario, the adjacent accuracy was
not calculated. However, it is important to report that
for all the texts corresponding to A or C levels, the
level assigned is correct or within one-level difference
(Table 7). The Kappa value obtained (0.639) corre-
sponds to a substantial agreement, according to (Lan-
dis and Koch, 1977).
Table 7: Confusion Matrix (three-levels).
Predicted
class
A B C
Actual
class
A 57 11 0
B 12 127 11
C 0 10 9
6.2 Feature Contribution
To assess the contribution of the features extracted
for the readability classification, we used the WEKA
toolkit (Bouckaert et al., 2013) with the feature selec-
tion algorithm InfoGainAttributeEval
8
. This evalua-
tion was conducted in the two different, previously
mentioned scenarios (Section 5). Figures 1 and 2
show the results for the features with higher contri-
bution on the classification task.
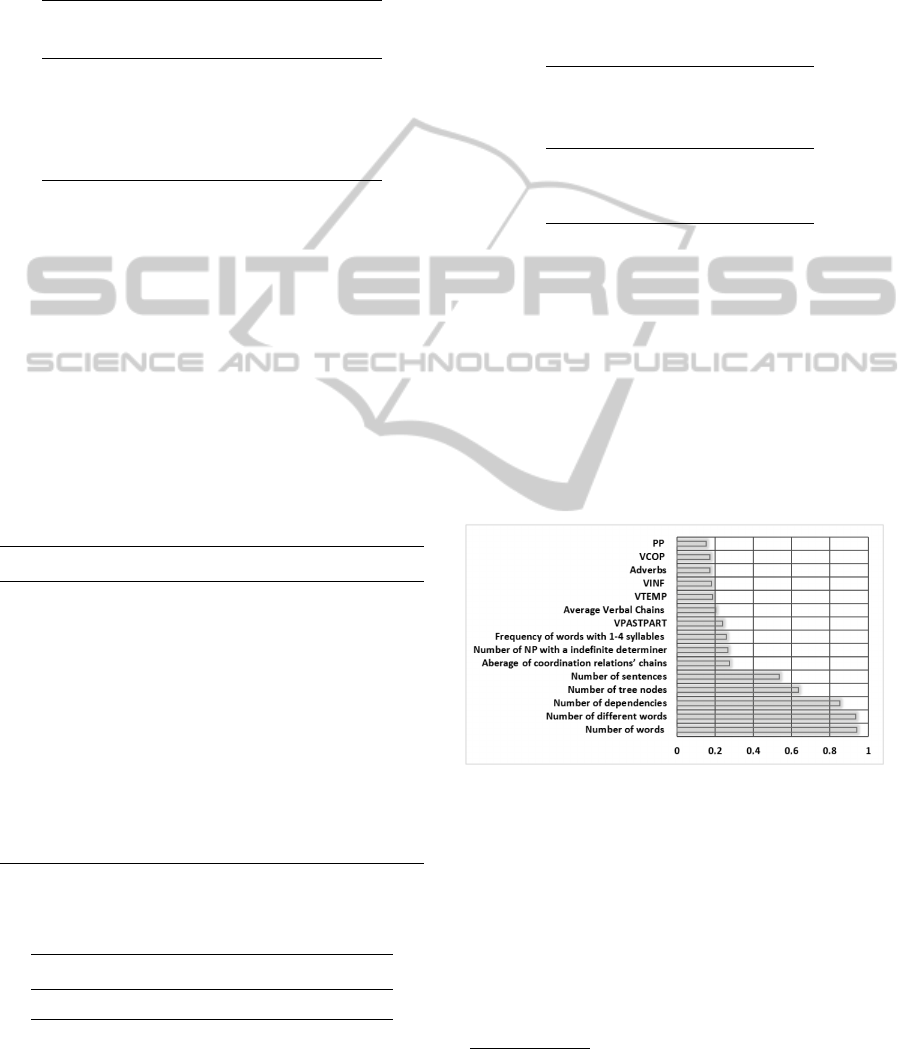
Figure 1: Feature contribution for the five-levels scale clas-
sification.
Regarding the five-levels classification (Figure 1),
among the top five features, some are computation-
ally simple to obtain, namely the number of words
(0.94), of different words (0.93), and sentences (0.54),
showing the relevance of more traditional readability
metrics. On the other hand, the number of dependen-
cies (0.85) and the total number of nodes (0.64) result
from the processing chain and justify the use of more
8
http://weka.sourceforge.net/doc.stable/weka/
attributeSelection/InfoGainAttributeEval.html
(accessed in Dec. 2014).
CSEDU2015-7thInternationalConferenceonComputerSupportedEducation
40
sophisticated, NLP-based tools in this classification
task. The remaining parameters are related to the POS
groups (frequency of adverbs), phrases (frequencies
of past participle verb phrases - VPASTPART, tem-
poral auxiliary verb phrases - VTEMP, infinitive verb
phrases - VINF, copulative verb phrases - VCOP and
PP), and averages and frequencies (average of coordi-
nating relations’ chains, frequency of words with 1-4
syllables and average of verbal chains), and extra fea-
tures (number of noun phrases - NP - with indefinite
determiners).
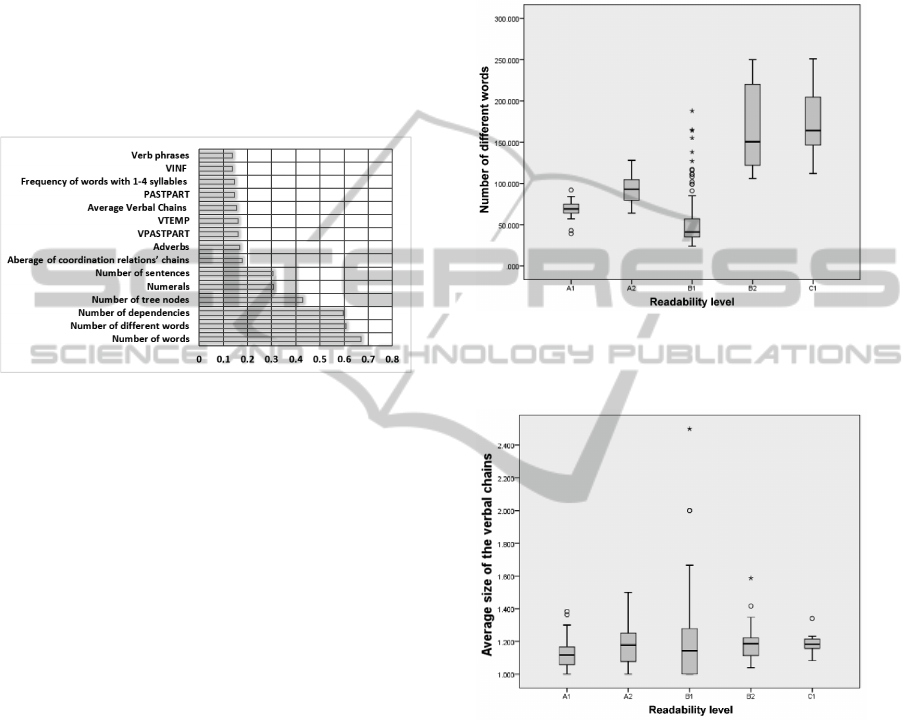
Figure 2: Feature contribution for the three-levels scale
classification.
In the three-levels classification (Figure 2), the
features that contributed most to the success of the
classifier were: the number of words (0.67), of differ-
ent words (0.61) and of dependencies (0.60). Again,
this highlights the importance of using a more so-
phisticated NLP-based tool than just simple counts
of words and sentences length for the classification
task. The list of fifteen features that stood out in the
success of the two classifiers is very similar (Spear-
man correlation coefficient of 0.881), only changing
the priority order of some features. The 1-4 syllables
word frequency parameter was not so relevant to the
results of the tree-levels scenario (0.14) as it was in
the five-levels scenario (0.26).
Additionally, box plot diagrams were built for
each feature used, which allowed to analyse feature
value variations between the different readability lev-
els. Given the large number of diagrams, only two
examples are presented here, namely, the one refer-
ring to the number of different words (Figure 3) and
another on the average of verbal chain’s (Figure 4).
By analysing the box plot diagrams, it was possible to
conclude that there is no feature that has completely
different values for each readability level and, on the
features with highest contribution such as the one on
Figure 3 (0.93 in the five-levels and 0.61 on the three-
levels scale classification), we observe that the B1
level has texts that seems to belong to A1 and A2
levels. However, the remaining features (with low-
est contribution), like the average size of the verbal
chain (Figure 4), do not have a distinct values range
between different readability levels. These observa-
tions confirm the complexity of the text readability
classification task.
Figure 3: Number of different words value variations be-
tween the different readability levels.
Figure 4: Average size of the verbal chain value variations
between the different readability levels.
7 CONCLUSIONS AND FUTURE
WORK
This paper presented two classifiers for European Por-
tuguese texts based on a variety of linguistic features.
These classifiers seek to assist the selection of ade-
quate reading materials for teaching European Por-
tuguese as a second language adapted to different lan-
guage proficiency levels.
The feature system focused on 52 features, from
simple word counts to complex syllables and word-
length counts, and rather sophisticated data involving
AutomaticTextDifficultyClassifier-AssistingtheSelectionOfAdequateReadingMaterialsForEuropeanPortuguese
Teaching
41

parsing techniques. The feature extraction achieved
98.85% F-measure, which is quite satisfactory.
A study of the features that contributed most to
the success of the classification task was conducted.
For both classifiers, the feature contribution shows the
importance of using more sophisticated, NLP-based
tools in this classification task. Additionally, the com-
plexity of the classification task was shown by the
analysis of the feature value variations between the
different readability levels.
In both scenarios, with five readability levels (A1
to C1) or with three-levels (A, B or C), the classi-
fiers here developed achieved good results with an
accuracy of 75.11% and 81.44%, respectively, and
most of their errors are within one-level distance
from the expected results. For comparative proposes,
the five-levels classifier developed presents good re-
sults against the best classifier of the LX-CEFR sys-
tem (Branco et al., 2014)(section 2), which just got
a maximum accuracy of 30%, while only using the
average number of syllables per word in the classifi-
cation task. For evaluation proposes, the corpus used
in the classifiers here presented is the same used by
LX-CEFR system but with more 112 texts.
The systems here presented has already been
made available to the general public through a web
form
9
and it can easily be extended by adding new
features or metrics of interest to the task at hand. Tak-
ing into account the small size of the corpus anno-
tated according to the readability level in the five-level
scale defined by QuaREPE (Grosso et al., 2011a), it
may prove useful to investigate unsupervised learning
techniques, i.e. techniques that do not depend on a
previously classified corpus, for example, using tech-
niques of cluster analysis, which allows to group a set
of objects into clusters via their similarities.
ACKNOWLEDGEMENTS
This work was supported by national funds through
Fundac¸
˜
ao para a Ci
ˆ
encia e a Tecnologia (FCT) with
reference UID/CEC/50021/2013. The authors grate-
fully acknowledge the use of the corpus classified ac-
cording to the Framework for Teaching Portuguese
Abroad and provided by the Instituto Cam
˜
oes.
REFERENCES
A
¨
ıt-Mokhtar, S., Chanod, J.-P., and Roux, C. (2002).
Robustness Beyond Shallowness: Incremental Deep
9
https://string.l2f.inesc-id.pt/demo/classification.pl
(accessed in March 2015).
Parsing. Natural Language Engineering, 8(3):121–
144.
Baptista, J., Mamede, N., and Gomes, F. (2010). Auxil-
iary Verbs and Verbal Chains in European Portuguese.
In Proceedings of the 9
th
International Conference
on Computational Processing of the Portuguese Lan-
guage (PROPOR’10), pages 110–119, Porto Alegre,
RS, Brazil. Springer.
Beaman, K. (1984). Coordination and Subordination Re-
visited: Syntactic Complexity in Spoken and Writ-
ten Narrative Discourse. In Coherence in Spoken and
Written Discourse, volume 12, pages 45–80. Ablex,
Norwood, NJ.
Bouckaert, R. R., Frank, E., Hall, M., Kirkby, R., Reute-
mann, P., Seewald, A., and Scuse, D. (2013). WEKA
Manual for Version 3-7-11. Hamilton, New Zealand.
Branco, A., Rodrigues, J., Costa, F., Silva, J., and Vaz, R.
(2014). Rolling out Text Categorization for Language
Learning Assessment Supported by Language Tech-
nology. In Proceedings of the 11
th
International Con-
ference on Computational Processing of Portuguese
(PROPOR’14), volume 8775, pages 256–261, S
˜
ao
Carlos, Brazil.
Brown, J. and Eskenazi, M. (2004). Retrieval of Authentic
Documents for Reader-Specific Lexical Practice. In
Proceedings of InSTIL/ICALL Symposium 2004, vol-
ume 17, pages 25–28, Venice, Italy.
Curto, P. (2014). Classificador de textos para o ensino de
portugu
ˆ
es como segunda l
´
ıngua. Master’s thesis, Insti-
tuto Superior T
´
ecnico - Universidade de Lisboa, Lis-
boa.
Figueirinha, P. (2013). Syntactic REAP.PT. Exercises on
Word Formation. Master’s thesis, Instituto Superior
T
´
ecnico - Universidade de Lisboa, Lisboa.
Flesch, R. (1943). Marks of Readable Style: A Study in
Adult Education (Contributions to education). Num-
ber 897. Columbia University, Teachers College, Bu-
reau of Publications, New York, United States.
Fry, E. (1968). A readability formula that saves time. Jour-
nal of Reading, 11(7):513–578.
Fulcher, G. (1997). Text difficulty and accessibility:
Reading formulae and expert judgement. System,
25(4):497–513.
Grosso, M. J., Soares, A., de Sousa, F., and Pascoal,
J. (2011a). QuaREPE - Quadro de Refer
ˆ
encia
para o Ensino de Portugu
ˆ
es no Estrangeiro. Docu-
mento Orientador. Lisboa: Minist
´
erio da Educac¸
˜
ao
e Ci
ˆ
encia/Direc¸
˜
ao Geral de Inovac¸
˜
ao e Desenvolvi-
mento Curricular.
Grosso, M. J., Soares, A., de Sousa, F., and Pascoal, J.
(2011b). QuaREPE - Quadro de Refer
ˆ
encia para o
Ensino de Portugu
ˆ
es no Estrangeiro. Tarefas, Activi-
dades, Exerc
´
ıcios e Recursos para a avaliac¸
˜
ao. Lis-
boa: MEC/DGIDC.
Gunning, R. (1952). The Technique of Clear Writing.
McGraw-Hill, New York, USA.
Gunning, R. (1969). The FOG Index after twenty years.
Journal of Business Communication, 6(2):3–13.
Klare, G. (1963). The measurement of readability. Iowa
State University Press, Ames, USA.
CSEDU2015-7thInternationalConferenceonComputerSupportedEducation
42

Landis, J. R. and Koch, G. G. (1977). The measurement of
observer agreement for categorical data. Biometrics,
pages 159–174.
Mamede, N., Baptista, J., Diniz, C., and Cabarr
˜
ao,
V. (2012). STRING: An Hybrid, Statistical and
Rule-Based Natural Language Processing Chain
for Portuguese. In Proceedings of the 10
th
In-
ternational Conference on Computational Process-
ing of Portuguese (PROPOR’12), volume Demo
Session, Coimbra, Portugal, https://string.l2f.inesc-
id.pt/w/index.php/Publications.
Marujo, L., Lopes, J., Mamede, N., Trancoso, I., Pino, J.,
Eskenazi, M., Baptista, J., and Viana, C. (2009). Port-
ing REAP to European Portuguese. In Proceedings
of SLaTE 2009, pages 69–72, Wroxall Abbey Estate,
Warwickshire, England.
McLaughlin, G. H. (1969). SMOG grading: A new read-
ability formula. Journal of Reading, 12(8):639–646.
Pitler, E. and Nenkova, A. (2008). Revisiting readability: a
unified framework for predicting text quality. In Pro-
ceedings of EMNLP’08, pages 186–195, Stroudsburg,
PA, USA. ACL.
Scarton, C. E. and Alu
´
ısio, S. M. (2010). An
´
alise da in-
teligibilidade de textos via ferramentas de Processa-
mento de L
´
ıngua Natural: adaptando as m
´
etricas do
Coh-Metrix para o Portugu
ˆ
es. Linguam
´
atica, 2(1):45–
61.
Schwarm, S. E. and Ostendorf, M. (2005). Reading level as-
sessment using support vector machines and statistical
language models. In Proceedings of ACL’05, pages
523–530, Stroudsburg, PA, USA. ACL.
Stenner, A. J. (1996). Measuring reading comprehension
with the Lexile framework. In Fourth North American
Conference on Adolescent/Adult, London, UK. Aca-
demic Press Ltd.
Thompson, K. C. and Callan, J. P. (2004). A Language
Modeling Approach to Predicting Reading Difficulty.
In Proceedings of NAACL’04, pages 193–200, Boston,
United States. ACL.
APPENDIX
The list of features used in the classification task are
presented in Table 8. For the classification task, the
features’ values for the parts-of-speech, chunks, verbs
and extras groups (with the exception of total number
of dependencies, total number of tree nodes and num-
ber of pronouns per NP) are represented by a ratio
weighted by number of words divided by 1000. For
example, the adjectives’ feature is calculated as fol-
lows: number of adjectives/(number of words/1000).
For the verbs group of features, the system consid-
ers the different inflected verbs forms as independent
counts to measure the use of different tenses and verb
forms. The special symbols are, for example, “$”,
“%”, “#”, etc.
AutomaticTextDifficultyClassifier-AssistingtheSelectionOfAdequateReadingMaterialsForEuropeanPortuguese
Teaching
43

Table 8: Features used in classification.
Group Features
Part-of-speech (POS)
Adjectives (ADJ)
Adverbs (ADV)
Articles (ART)
Conjunctions (CONJ)
Interjections (INTERJ)
Nouns (NOUN)
Numerals (NUM)
Past participles (PASTPART)
Prepositions (PREP)
Pronouns (PRON)
Punctuation (PUNCT)
Special symbols (SYMBOL)
Chunks
Nominal phrases (NP)
Adjectival phrases (AP)
Prepositional phrases (PP)
Adverbial phrases (ADVP)
Temporal auxiliary verb phrases (VTEMP)
Aspectual auxiliary verb phrases (VASP)
Modal auxiliary verb phrases (VMOD)
Copulative verb phrases (VCOP)
Past participle verb phrases (VPASTPART)
Gerundive verb phrases (VGER)
Infinitive verb phrases (VINF)
Finite verb phrases (VF)
Sub-clause phrases (SC e REL)
Verb phrases (VF e VCOP)
Sentences and words
Number of sentences
Number of words
Number of different words
Words frequencies
Verbs
Number of different verbs forms
Number of auxiliary verbs
Number of main verbs
Averages and frequencies
Average number of verb phrases per sentence
Average length of sentences
Average length of syllables per word
Average size of verbal chains
Average size of coordination relation’s chains
Frequency of verbs
Frequency of words with 1-4 syllables
Frequency of words with more than 4 syllables
Extras
Total number of dependencies
Total number of tree nodes
Number of pronouns per noun phrases (NP)
Number of NP with a definite or demonstrative determiner
Number of NP with a indefinite determiner
Number of subordinate clauses (SC/REL chunks)
Number of coordination relations
Number of omit subjects
Flesch Reading Ease BR readability measure
CSEDU2015-7thInternationalConferenceonComputerSupportedEducation
44
