High Frequency Non-intrusive Electric Device Detection and Diagnosis
Roman Jonetzko, Matthias Detzler, Klaus-Uwe Gollmer, Achim Guldner, Marcel Huber,
Rainer Michels and Stefan Naumann
Institute for Software Systems, Trier University of Applied Sciences,
Environmental Campus Birkenfeld, Birkenfeld, Germany
Keywords:
Pattern Recognition, Non-intrusive Load Monitoring, Classification, Fourier Descriptors.
Abstract:
The number of electronic devices in households as well as in industrial workplaces is continuously growing be-
cause of progress in automation. Identifying unusual operating behavior, detecting device failures in advance,
and recognizing energy saving potentials are key features to improve the reliability, safety, and profitability
of those systems. Facing these tasks, todays research is focused inter alia on a non-intrusive load monitoring
approach, where the electrical signal is measured at a central point with modern hardware and processed by
pattern recognition algorithms. Thus, we developed a smart meter prototype with a high sampling frequency,
which allows for continuous measurement of the current and voltage from three-phase power lines. Besides
this, in this paper we describe the usage of current-only measurement data (simple and safe installation using
current transformers) with which we were able to classify state changes of a mobile air-conditioner with the
help of Fourier descriptors as well as with additional voltage measurement.
1 INTRODUCTION
So far, currently available smart meter technology is
used to measure inter alia electrical current, voltage,
and power for determining the electrical energy con-
sumption (or in-feed e.g. of photovoltaics) of a house-
hold or industrial building. For this purpose, it suf-
fices to transfer the acquired data in intervals of sec-
onds to several minutes (calculated from data mea-
sured at sampling rates in the kHz range). This usage
is primarily focused on gaining knowledge about the
immediate energy demand and to visualize the power
curve. However, the analysis of signal data measured
at high sampling rates implies another possible ap-
plication of smart meters: the detection of switching
events and the specific states of electric devices in
a circuit by examining the signal for device specific
patterns to perform load monitoring e.g. in technical
work places.
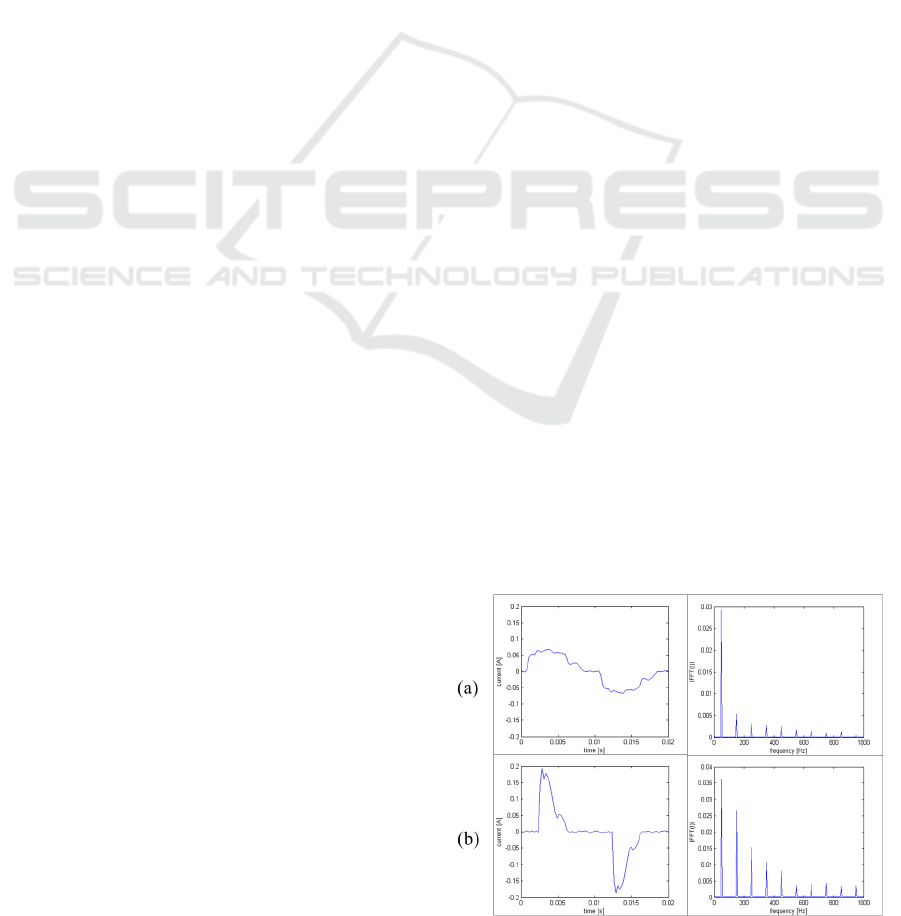
In comparison to pure resistive devices such as
light bulbs, many modern devices consist of elec-
tronic components which produce harmonics (integer
multiples of the fundamental frequency) in the current
signal, because of a nonlinear current-voltage behav-
ior. With the calculation of these harmonics, which is
possible by applying Fast Fourier Transformation to
the measured signal, the frequency spectrum can be
used as a “fingerprint” for different devices, as shown
in figure 1. For our application we need to transfer
measured data at appropriate speeds so that no events
in the signal are missed. Because we did not find such
a smart meter available at a reasonable price for con-
sumers and small and medium enterprices on the mar-
ket, we had to develop a smart meter for our applica-
tion case.
Figure 1: Current signal and amplitude spectrum of an
LED-lamp (a), compared to a compact fluorescent bulb (b).
A cost-efficient method for load monitoring is to in-
stall a smart meter at a central point (e.g. distribution
209
Jonetzko R., Detzler M., Gollmer K., Guldner A., Huber M., Michels R. and Naumann S..
High Frequency Non-intrusive Electric Device Detection and Diagnosis.
DOI: 10.5220/0005434502090216
In Proceedings of the 4th International Conference on Smart Cities and Green ICT Systems (SMARTGREENS-2015), pages 209-216
ISBN: 978-989-758-105-2
Copyright
c
2015 SCITEPRESS (Science and Technology Publications, Lda.)

box). This removes the need for measuring every de-
vice individually but also makes disaggregation algo-
rithms necessary to detect individual devices from the
measured sum signal. Because no intrusion into ma-
chines or devices is needed, this method is called non-
intrusive appliance load monitoring (NIALM). The
aim of load monitoring is to get knowledge about
specific devices and their operation states, improve
fault detection and identify energy efficiency poten-
tials. In residential applications, this allows for identi-
fying devices, in industrial applications with complex
machines, it allows for identifying machine compo-
nents.
In our paper we first consider the state-of-the-art
in NIALM research, focus in the following chapter on
our smart meter prototype. Afterwards, we describe
appropriate features for classification, show inter alia
how to use Fourier descriptors for classification with
current measurement data only, and how we realized
the classification of the active devices.
2 RELATED WORK
Using high-frequency sampled data for NIALM al-
gorithms was already mentioned by (Leeb et al.,
1995), where they describe transient event detection
via spectral envelopes. More recent research used up
to date high frequency measurement hardware avail-
able at the market (high-investment), which directly
outputs calculated complex Fourier coefficients (FC)
and fed this data into neural networks (Srinivasan and
Liew, 2006). They indeed reached good detection-
rates, however they had no variable loads present in
their measurements. This presence of variable loads
is a widely stated problem for the algorithms, which
is described in various publications, e.g. (Lee et al.,
2005). With the finding of strong correlations be-
tween higher harmonics and the active power Lee et
al. subtracted the estimated power of the variable load
from the sum signal, showing that this applies if a sin-
gle variable load is present. (Zoha et al., 2012) gives
an overall overview of steady-state (using features
like power change) and transient-state (using features
like start-up current transients) disaggregation meth-
ods and points out that it is still a challenge for re-
searchers to develop a solution which is able to de-
tect all kinds of device types. A promising approach
could be an implementation of a multi-feature/multi
algorithm solution, which (Liang et al., 2010) pro-
pose, with the extraction of additional features, such
as the complete waveform of a cycle period and in-
stantaneous admittance.
So far, little research has been conducted on
low-investment non-intrusive measuring devices. In
(Guldner et al., 2013) we presented a centralized, low
investment data acquisition prototype based upon a
modified consumer energy meter by Reichelt Elec-
tronics Co. In this paper we further developed the
hardware (cf. section 3) and software (cf. section 5).
3 SMART METER HARDWARE
AND DATA PROCESSING
The purpose of the smart meter in our case is not to
use it for utility billing but rather for perfoming load
monitoring. Therefore no exact active power calcu-
lation but transferring measured data in real-time is
important. As mentioned in the introduction, we de-
veloped a smart meter to match these requirements,
which includes the following parts:
• Low-cost Measurement Instruments. Current
transformers and voltage transformers, which
make direct access to the power lines unnecessary
(direct connection to the power lines can be used
for voltage measurement, too)
• Poly Phase Measurement Chip. An ATMEL
90E36A chip reads current and voltage signals of
up to three phases at sampling rate of 7.324 kHz
• Real-time Processing of Measured Data. To
match the requirement of real-time processing,
we use a Teensy 3.1 microcontroller develop-
ment system that features a MK20DX256 ARM
Cortex-M4 with 72 MHz, 64 kB RAM memory, a
SPI and an USB Port
• Wireless Data Transfer to a Server. A Raspberry
Pi transfers the data via wi-fi, which provides
galvanic isolation between potentially expensive
server hardware and the measured power lines of
up to 400 volts (in case of direct connection to the
power lines).
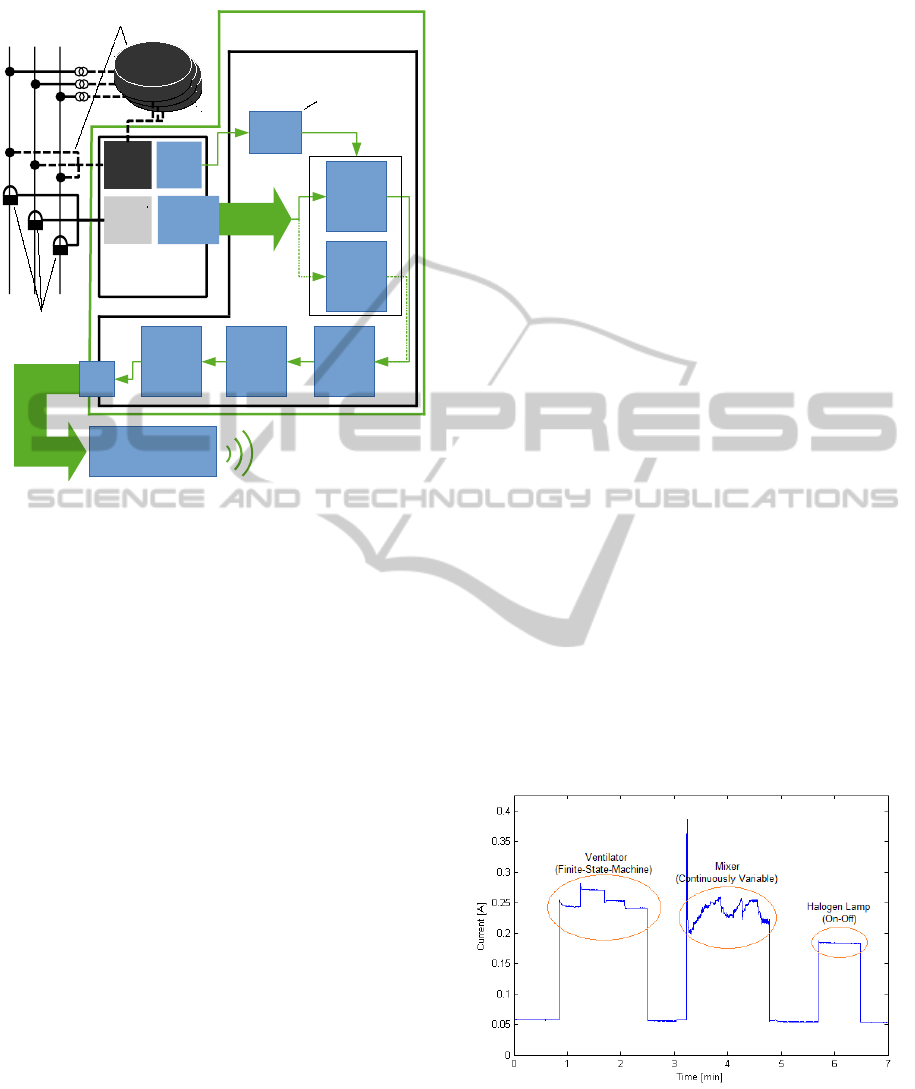
Figure 2 depicts the system structure. The data gen-
erated by the measurement chip is gathered by the
Teensy. Via the SPI bus, the Teensy sends the chip (in
slave-mode) into direct memory access mode (DMA).
Then - in master-mode - the chip sends the read cur-
rent and voltage measurements directly over the SPI
bus, where the Teensy collects them into two buffers
of 2,048 values. One buffer is filled with the alternat-
ing current and voltage readings of each phase, while
the second buffer is propagated to data preprocessing.
For synchronizing the data, the ATMEL chip pro-
vides a zero-crossing signal for each phase via a zero-
crossing detection pin, which propagates the start and
finish of a period in the current or voltage signals.
SMARTGREENS2015-4thInternationalConferenceonSmartCitiesandGreenICTSystems
210
Phases
A B C
Voltage
ADC
Current
ADC
ATMEL
90E36A
3 x
230 V~
3 x 1 V~
YHDC
SCT-013-005
split-core current
transformer
optional and alternative
Alternating
Buffer 1
Alternating
Buffer 2
FFT
Fourier
Descriptors
(optional)
Selection
of 50 Hz
multiples
Interrupt
Service
routine
Teensy 3.1 USB Board
Zero-
crossing
detection
Direct
Memory
Access
Triggers alteration
of buffers after 6
signal periods
SPI
PEBIS Smart Meter Board
Serial
port
Raspberry Pi
Wireless data
transfer to server
USB
Voltage
Transformer
Figure 2: Data acquisition and processing in the devised
smart meter board.
This pin is also read by the Teensy in an interrupt,
which switches the data collection to the other buffer
after the maximum number of full signal periods that
fit within the 2,048 value limit have been read (in Ger-
man power lines with 50 Hz, this results in six periods
being read). This approach fixes the measuring win-
dow to a full multiple of a current- and voltage period,
allowing us to simply apply the Fast Fourier Trans-
form (FFT) to the signal as-is, without the need for
a window function and without distorting the spectral
estimate.
For processing the data, at first, a complex, in-
place, fixed-point Radix-4 algorithm is used to cal-
culate the FFT. Afterwards, the complex values of the
FC are extracted and the fundamental and first 40 har-
monics selected. Thus, the data can be read contin-
uously (no fluctuation in the current and voltage sig-
nals is missed) and is reduced from 8,192 bytes to
656 bytes (real and imaginary part of the 40 harmon-
ics plus the fundamental).
Optionally - if only the current signal is measured
- Fourier descriptors (description see chapter 4.2) are
applied. Finally, the data is sent to a Raspberry Pi (or
any other computer) over the USB-Port of the Teensy.
There, the data can be transfered to a database server
or directly be visualized, disaggregated or clustered.
4 CLASSIFICATION FEATURES
Previous research showed that so far, it is implau-
sible to detect all kinds of electric devices through
their electrical signal using only a single feature (Zeif-
man and Roth, 2011). The reason is a different
load behavior of different kinds of devices that cause
the extraction of specific features needed to detect
devices of specific load behaviors. Therefore, the
calculation of FC of the measured raw signal data
(at high sampling rate), provides information content
about signals shape and phasing. In the following,
a short overview is given of the appliance classifica-
tions stated by (Hart, 1992) which is kept up by sub-
sequent NIALM research. Afterwards, the calculation
of FC and their subsequent processing is detailed.
Permanent Devices. Devices which are always ac-
tive and having a constant load (e.g. hard-wired
alarms, phones, routers).
On-off Devices. Devices with only one active state,
not operated constantly, and having constant load (e.g.
light bulbs, electric motors without speed control).
Finite State Machines. Devices with more than one
active state in between which can be switched and
having a constant load in each state (e.g. dryer, multi
state kitchen devices)
Continuously Variable Devices. Devices which can
have a continuously variable load behavior, having no
stepped variation of load (e.g. speed controlled elec-
tric motors like in power drills, modern energy effi-
cient pumps and fans).
To depict the differences, the amplitude curve of the
FC envelope of the different device types is shown in
figure 3.
Figure 3: Amplitude curve of the FC envelope correspond-
ing to 50 Hz signal component.
HighFrequencyNon-intrusiveElectricDeviceDetectionandDiagnosis
211

4.1 Choice of Fourier Coefficients and
Influence of Noise
It is widely known that, under certain assumptions,
the Fourier series of a signal s = s(t) with period T
and fundamental frequency f
0
= 1/T can be rewrit-
ten as its Fourier series. When a signal is in a steady
state, in our case, we can assume that the fundamen-
tal frequency is (nearly) 50 Hz, so that T = 0.02s
(since s = s(t) is given by the power supply). Be-
cause the observation time is given by a rectangular
window w, the result of the fast Fourier transform is
an approximation of the Fourier Transform of s · w
(we denote the Fourier Transform of s as F (s)). If
the length/time of w is chosen in a way that T | w,
meaning w = k · T with k ∈ Z, one can see, with the
choice of ω = ω
m
= m · 2π f
0
, where m ∈ N
0
that
F (s · w)(ω
m
) gives the calculation formula for the
(theoretical) m-th complex FC (noted as c
m
= c
m
(s))
of a T -periodic signal s = s(t). Since the signal s
is real (current, voltage, or power), it is also known
that c
−m
= c
m
. In steady state, by using the FFT,
we compute F (s · w)(ω), and choosing ω = m · 2π f
0
(m ∈ N
0
), we receive approximately the (complex) FC
of the Fourier series of s. Since there are fluctuations
in f
0
(meaning that the fundamental frequency is not
stable at f
0
= 50 Hz permanently), in practice, we can
find a good approximation to these complex FC. In
experiments we observed a variation of fundamental
frequency from the power supply in a range between
49.8 Hz and 50.2 Hz.
If the measured signal (the observation time is
given by window w) is nearly in steady state, these
complex FC can be used to characterize this signal.
Using these FC, we can calculate a finite Fourier se-
ries which gives a good approximation to the ob-
served signal. These considerations motivate our
choice of feature selection: In the DFT-Calculation
(DFT: Discrete Fourier transform), we use these DFT-
values with ω, so that it is approximately ω = m ·
2π f
0
, where m ∈ N
0
. Using this approach, we also
have two restrictions to observe: First, the number
of interesting FC is bounded by the Nyquist-Shannon
sampling theorem. In the discrete form, we observe
this constraint also by the conjugate symmetry of a
DFT calculated vector. The second constraint is a lim-
itation given by the magnitude of the noise.
4.2 Fourier Descriptors
As mentioned in chapter 3, our system allows us
to classify the devices, measuring only the current
signal (cf. chapter 5.1). In this case a calculation of
Fourier descriptors is required, which the following
passage describes.
No Capturing of the Phase Shift Between Cur-
rent and Voltage. When the measurement of the
current signal s = s(t) is started at a random point
without measuring the voltage at the same time, we
have no knowledge about the phasing of the signal.
Having a continuously changing window position of
the Fourier Transform, this causes a continuous shift
in the real and imaginary parts of FC c
k
= c
k
(s),
which is not feasable for device detection. Calcu-
lating the amplitude spectrum, we can get a constant
set of frequency components of the signal, usable as
a “fingerprint” of a decive. But it lacks informa-
tion about any angle relation of the frequency com-
ponents. Alghough we have no knowledge about the
phasing of the fundamental frequency related to the
voltage signal, we can relate the phasing of high-
order-harmonics of the current signal to the funda-
mental frequency of the current signal to get a de-
sciption about the signal shape, which represents ad-
ditional information for device detection. Calculation
of Fourier descriptors
e
c
k
=
e
c
k
(s) (cf. formula (1)) pro-
vides this and makes evaluation of periodicity of the
signal possible:
If c
1
6= 0 :
c
1
= |c
1
| · e
iϕ
; ϕ ∈ [0,2π) (1)
e
c
2
=
c
2
(e
iϕ
)
2
;
e
c
3
=
c
3
(e
iϕ
)
3
; ...;
e
c
k
=
c
k
(e
iϕ
)
k
k : (positive) harmonic index
Figure 4: Illustration of the first three FC before (l.) and
after applying Fourier descriptors (r.).
For two signals s
1
,s
2
we have:
e
c
k
(s
1
+ s
2
) 6=
e
c
k
(s
1
) +
e
c
k
(s
2
) (2)
Since Fourier descriptors are not additive (cf. formula
(2)) all possible states/combinations of measured de-
vices have to exist as reference patterns.
To show the additional information acquired by us-
ing Fourier descriptors in comparison to the ampli-
tude spectrum, we generated two signals of different
SMARTGREENS2015-4thInternationalConferenceonSmartCitiesandGreenICTSystems
212
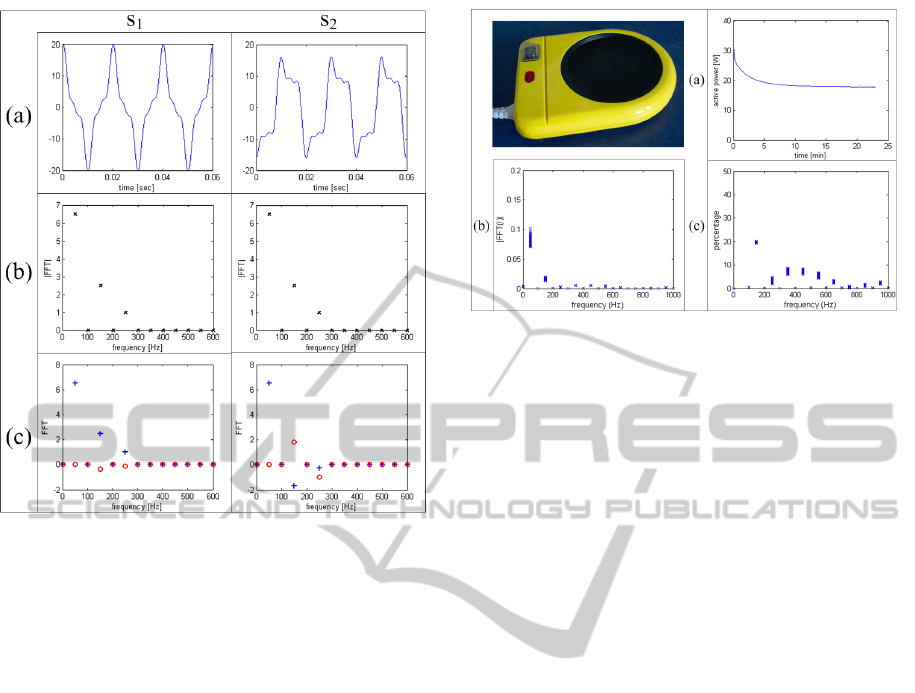
Figure 5: Signals s
1
and s
2
of different shape (a) have the
same amplitude spectrum (b) but a different frequency spec-
trum where Fourier descriptors are applied to FC (c).
shape. The point is that these signals could not be dis-
tinguished by a pattern recognition algorithm, which
uses the amplitudes of the frequency components for
classification. Although one can see that the two sig-
nals are clearly of a different kind of shape, it is recog-
nizable in figure 5 that they have the same amplitude
spectrum. In comparison to calculation of magnitudes
we keep the information about signal shape existing in
the FC when calculating Fourier descriptors and have
a constant “fingerprint” for device classification.
4.3 Ratios Between nth and 1st
Harmonic
The problem of detecting devices when variable loads
are present caused us to research features which re-
main constant for a variable load during their op-
eration. As a result, the ratio between high-order
harmonics and the fundamental frequency seems to
be relatively constant in initial tests (cf. figure 6).
However, the ratio is not an additive feature, so sum
signals with more than one active device cannot be
used. For generating a signal where only one device is
active, the delta-form has to be calculated. The delta-
form is the difference between the measured instanta-
neous data and the data at the previous measurement
point. In this period of time between two measured
data, we assume that only one device is switched.
Figure 6: The load variation of the hotplate (a); the variation
in amplitude spectrum (b); ratios diagram (c), where a good
stability of ratio between 3rd and 1st FC is recognizable
(150 Hz to 50 Hz component ratio of around 20%).
(H
¨
ock, 2009) states that devices of different elec-
tric function have specific values of those ratios. In
table 2 the classification of devices used in our exper-
iments is listed.
5 CLASSIFICATION
To perform state and device detection from measured
signals, we used three different pattern recognition
approaches. We performed real time recognition of
device states of a mobile air-conditioner with a clus-
tering algorithm. Here we especially tested classi-
fying with current only measurement data, and also
tested artificial neural networks. The used setup is
described in section 5.1. With the setup described
in section 5.2 we measured combinations of differ-
end devices and applied a nearest-neighbor classifier
to that historic dataset.
5.1 Benchmark Setup 1
In this setup we analyzed a mobile air-conditioner in-
dividually considering its different operation states,
which are specified in table 1. This means the focus
is not on detecting the single components but detect-
ing the different states of the device. Therefore, the
new Teensy smart meter was used to benefit from its
continuous measurement method.
5.1.1 Applying Cluster Analysis
For creating clusters we collected the first 17 FC in
a row vector. We measured 2,000 datasets for each
possible state (corresponds to approx. 4 minutes per
state). These historic datasets of all possible states
HighFrequencyNon-intrusiveElectricDeviceDetectionandDiagnosis
213

Table 2: Overview of Ratios for Measured Devices and Physical according to (H
¨
ock, 2009).
Device
Ratio n
th
to 1
st
harmonic [%]
Cause
n = 2 n = 3 n = 4 n = 5 n = 7
Air-conditioner fan 4 2 2 saturation
Speakers 35 18 4 rectifier
Pedestal fan 4 2 2 saturation
Compact fluorescent lamp (CFL) without ECG 1 9 1 2 gas discharge
Halogen lamp
Mixer 62 25 5 5 5 rectifier
Hotplate 20
Food processor 16 3 saturation
Electric knife 6 2 saturation
Table 1: Overview of the mobile air-conditioner states.
State Active device components
FanLow Evaporator fan performs
FanMed air-circulation in three different
FanHigh power states (42 W, 44 W, 51 W)
CoolLow Condenser fan (74 W), condenser
CoolMed water pump (9 W),
CoolHigh evaporator fan (42 W, 44 W, 51 W),
compressor (500...550 W)
are averaged (by components) and the calculated C
17
average is used as center point for the respective clus-
ter. For calculating cluster radii, as a first approach
we used the following formula:
r =
Q
0.25
+ Q
0.75
2
+ 2 · IQR (3)
Q : quartile
IQR : interquartile range
Figure 7 shows the data flow of applying the cluster
algorithm to measured input data.
If a new measured vector is located in more than one
cluster, it is assigned to the cluster with the minimum
distance to its cluster center. Is the vector not located
in any cluster, it is defined as an outlier, if it falls
below the 25% quartile (low-outlier) or exceeds the
75% quartile (high outlier), respectively by more than
2 times the IQR.
The detection of the three fan only switching
states (low/med/high) with the clustering algorithm
using only current measurement data (no capture of
phase shift of the signal, thus applying Fourier de-
scriptors) works nearly as well as with phase capture
(cp. table 3). In comparison to that, using only ampli-
tudes results in a much lower detection rate. During
compressor activity (cooling states) changes in evap-
orator fan states are not recognizable by the cluster-
ing algorithm, even when phase shift of the signal
is considered through zero-crossing detection of volt-
age signal. The high difference in load scale between
compressor and evaporator fan makes detecting small
changes of the fan’s power constumption difficult, a
problem we also observed in setup 2.
Table 3: Detection rates applying cluster algorithm for three
fan states and different preprocessed measurement data.
Measurement data Detection rate
Current and voltage 93%
(phase capture)
Current only 82%
(Fourier descriptors applied to)
Current only (amplitudes) 39%
5.1.2 Applying Artificial Neural Networks
Besides the clustering algorithm, we tested if an arti-
ficial neural network (ANN), which it is another ap-
propriate method to solve pattern recognition prob-
lems, is able to detect all states of the mobile air-
conditioner. Using the MathWorks Matlab software,
we chose a two-layer feed-forward network with sig-
moid transfer function and back propagation training
and used as input vector the result of a principle com-
ponent analysis (PCA) of the FC, which represents a
lower number of weighted and sorted features. The
target-vector contains whether or not the particular
device is active (element contains 1) or inactive (el-
ement contains 0).
The trained ANN yields the same result as the
clustering algorithm: it was also able to correctly clas-
sify the fan states, but not able to distinguish between
cooling states due to the high differences in power
consumption.
5.2 Benchmark Setup 2
The second setup consists of nine (cf. table 4) de-
vices which were measured individually for creating
reference patterns and combined with an automated
SMARTGREENS2015-4thInternationalConferenceonSmartCitiesandGreenICTSystems
214

Neuer Input-Datensatz
Neuer Input-Datensatz
Neuer Input-Datensatz
Input-dataset (no. n+1)
Input-dataset (no. n)
Interval: approx. 1,0 sec.
Input-
Dataset
(no. n)
Input-
Dataset
(no. n)
I1_Re: 0.378
I1_Im: 0.253
I2_Re: -0.131
…
U1_Re: 0.634
U1_Im: 0.342
U2_Re: 0.001
…
IRMS: 2.312
URMS: 227.212
…
P_Real: 4.955
P_React: 2.241
...
Historical data
Analysis
Generated from
Known
cluster
New
cluster Cm+1
Outlier definition
Clustering-
algorithm
Output
data
sequence
Known
clusters
C1 C2
C3 C4
…
Cm
Figure 7: Outlier detection algorithm.
device switching system composed of power distribu-
tion units (Energenie EG-PMS2, multi sockets which
are switchable by PC through a USB connection).
The goal of this setup was to disaggregate the single
devices from a measured sum signal. For this mea-
surement, in an early project phase, we used the Zig-
Bee smart meter prototype which measures at 4 kHz
sampling rate current and voltage signal and does not
provide continuous measurement.
Table 4: Classification of the devices via their load classes.
Device Nominal Load Class
Power [W]
Air conditioner fan 75 on-off
Speakers 3 on-off
Pedestal fan 30 on-off
CFL 25 on-off
Halogen lamp 30 on-off
Mixer 40 on-off
Hotplate 15 cont. variable
Food processor 130 cont. variable
Electric knife 65 on-off
5.2.1 Applying Nearest-neighbor Classifier
To detect individual loads from of the aggregated sig
nals, a nearest-neighbor classifier has been imple-
mented. At first, the current signals of the switchable
distribution unit’s microcontrollers were subtracted
from the measured reference dataset (individual de-
vices) and combination dataset. Thereby, a distur-
bance in the calculation of combinations from the in-
dividual signals could be avoided. Using FC, calcu-
lated through discrete Fourier transformation of the
measured raw signals, we classified with a brute-
force algorithm, which means all possible combina-
tions were calculated from the reference pattern (indi-
vidual measurements of all existing devices) and the
sum of the features was compared to the feature of the
measured dataset signal (real measurement of combi-
nation). The calculated combination with the smallest
Euclidean distance to the real measured combination
was classified as the current combination.
Applying the brute force algorithm using nearest
neighbor classifier to the complete dataset of 9 de-
vices (containing devices from different load behavior
classes) using the first 39 FC as features a relatively
low recognition rate of 27% for this dataset was com-
puted (cf. table 5). Separating out combinations of
devices which include devices with load behavior dif-
ferent than on-off-devices significantly increased the
detection rate.
Table 5: Detection rates of complete and reduced dataset.
Left out devices None Speaker, hotplate,
mixing machine
correctly classified 139 58
combinations
Total no. of 511 64
combinations
Percentage 27% 91%
We identified the appearance of variable loads as pri-
mary cause for confounding the NIALM algorithm.
The devices with variable loads in this dataset are
the hotplate where a temperature controller adjusts
the current demand and the food processor which
HighFrequencyNon-intrusiveElectricDeviceDetectionandDiagnosis
215

runs up to higher rotational speed meaning that cur-
rent demand decreases (whereby the efficiency factor
increases). A continuously variable load coincides
with continuous changes of the frequency spectrum.
This implies that the averaged values of FC cause a
high similarity of different compared combinations.
In section 4.3, we presented an appropriate feature
(ratios between FC) that is likely to solve this prob-
lem. Because we often switched more than one de-
vice at the same time during the measurement of the
dataset, we are not able to use this feature yet, because
it needs the delta-form (only one device may switch
at the same time).
In comparison with setup 1, we could observe the
same problem in device detection, when there is a
large difference between the load scale of present de-
vices. Variations of the power consumptions of high
load devices can exceed smaller devices power con-
sumption level. Here, the speakers load is as high as
the variation range of power of the mixing machine.
So far, we did not find any feature which could solve
this.
6 SUMMARY AND OUTLOOK
Our developed smart meter prototype, which is cur-
rently in testing phase, is able to provide information
about the electric signal without missing any event
occurring during time of measurement. We pointed
out that with Fourier descriptors, classification with-
out consideration of the voltage signal is possible for
observing state changes of finite state machines. For
specific machines which have a finite state load be-
havior and whose states are of a similar load scale,
this could be a low cost and safe method of supervis-
ing. Like previous research, we observed the problem
of variable loads for the disaggregation algorithms at
setup 2. Therefore, additional extracted features like
ratios between FC could help to identify the existence
of variable loads and will be tested in further setups.
Another approach is to improve transient signal de-
tection, where envelopes of FC during device start-
up and shut-down could be allocated with specific de-
vices. The goal is to make all information contained
in the FC available and combining features extracted
from short time windows and long time windows in
detection algorithms.
ACKNOWLEDGEMENTS
This paper evolved from the research and develop-
ment project “Process Monitoring and Improved En-
ergy Efficiency of Technical Workplaces via Smart
Meters” (PEBiS), which is sponsored by the founda-
tion “Stiftung Rheinland-Pfalz f
¨
ur Innovation” grant
number 961-386261/1048. The contents of this docu-
ment are the sole responsibility of the authors and can
under no circumstances be regarded as reflecting the
position of the foundation “Stiftung Rheinland-Pfalz
f
¨
ur Innovation”.
REFERENCES
Guldner, A., Arns, S., Schunk, T., Gollmer, K.-U., Michels,
R., and Naumann, S. (2013). Detecting consumer de-
vices by applying pattern recognition to smart me-
ter signals. In Page, B., Fleischer, A. G., G
¨
obel, J.,
and Wohlgemuth, V., editors, EnviroInfo2013 - Envi-
ronmental Informatics and Renewable Energies. 27th
International Conference on Informatics for Environ-
mental Protection, Hamburg, September 2-4, 2013,
pages 198–204.
Hart, G. W. (1992). Nonintrusive appliance load monitor-
ing. In Proceedings of the IEEE, Vol. 80, pp. 1870-
1891. IEEE.
H
¨
ock, G. (2009). Dirty Power Oberschwingungen
durch nichtlineare Verbraucher. http://www.gmc-
instruments.ch/src/download/dDirty Power.pdf. [On-
line; accessed 01-December-2014].
Lee, K. D., Norford, L. K., Armstrong, P. R., Holloway, J.,
and Shaw, S. R. (2005). Estimation of variable-speed-
drive power consumption from harmonic content. In
IEEE Transactions on Energy Conversion, Vol. 20, pp.
566-574. IEEE.
Leeb, S. B., Shaw, S. R., and Kirtley, J. L. (1995). Transient
event detection in spectral envelope estimates for non-
intrusive load monitoring. In IEEE Transactions on
Power Delivery, p. 1200, 1995. IEEE.
Liang, J., Ng, S. K. K., Kendall, G., and Cheng, J. W. M.
(2010). Load signature studypart i: Basic concept,
structure, and methodology. In IEEE Transactions on
Power Delivery, Vol. 25, pp. 551-560. IEEE.
Srinivasan, D. and Liew, A. (2006). Neural-network-based
signature recognition for harmonic source identifica-
tion. In IEEE Transactions on Power Delivery, vol.
21, pp. 398-405. IEEE.
Zeifman, M. and Roth, K. (2011). Nonintrusive appliance
load monitoring: Review and outlook. In IEEE Trans-
actions on Consumer Electronics, Vol. 57, pp. 76-84.
IEEE.
Zoha, A., Gluhak, A., Imran, M. A., and Rajasegarar, S.
(2012). Non-intrusive load monitoring approaches for
disaggregated energy sensing: A survey. In Sensors
2012, 12. Sensors - Open Access Journal.
SMARTGREENS2015-4thInternationalConferenceonSmartCitiesandGreenICTSystems
216
