
Guideline for Crowd Evacuation Simulation
Validation of a Pedestrian Simulator with RiMEA Test Scenarios
Yayun Zhou, Wolfram Klein and Hermann Georg Mayer
Siemens AG, Corporate Technology, CT RTC AUC, Otto-Hahn-Ring 6, 81739 Munich, Germany
Keywords:
Crowd Evacuation, Microscopic Pedestrian Simulation, Simulation Guideline.
Abstract:
This paper introduces a way to verify a microscopic pedestrian simulator. The microscopic pedestrian sim-
ulator tested in this paper is developed by our group, which can be used to guide the crowd evacuation and
prepare respond plans for emergent situations as reference to city council and law enforcement agency. It is
important that the simulation results reveal the true behavior of pedestrian, for certain precaution actions can
be taken in order to guarantee the safety of the crowd. Therefore, the simulator has to been tested and verified
using different test scenarios. In this paper, we documented the performance of our simulator tested with
all 14 scenarios proposed by the RiMEA (Richtlinie f
¨
ur Mikroskopische Entfluchtungs-Analysen) guideline.
The test results show that our simulator passes all the tests. Moreover, our pedestrian simulator constantly
improves its performance by cooperating with construction companies and government departments running
on-site tests with first-hand data. Now it covers emergency scenarios such as fire / smoke and floods.
1 INTRODUCTION
Nowadays, more and more people are moving from
small villages to big cities forming metropolises
worldwide. The increasing population density and
limited living space make metropolises top targets for
terror attacks and make them vulnerable to natural
disasters. A key task for smart city is to make the
city safer to its residents. Central stations, skyscrap-
ers and sport stadiums should be designed to reduce
risk by removing congestion, reducing crowd density
at hot spots, minimizing evacuation times or maxi-
mizing throughput. In those cases, a simulation soft-
ware which simulates the crowd movement, predicts
the evacuation time and identifies the possible bottle-
neck is very helpful to design smart buildings. As for
existing non-smart-buildings, the pedestrian simula-
tor can provide insight in evacuation time and aids to
prepare respond plans.
Because of its various applications and convincing
results, adopting pedestrian flow simulation is becom-
ing a popular topic in designing public transport sys-
tems and large infrastructure facilities (Kneidl et al.,
2012) (Gilg et al., 2014) (L
¨
ammel et al., 2008). There
are two major types of models adopted by pedestrian
behavior simulation: microscopic models and macro-
scopic models. The so-called microscopic models
simulate the behavior of a single pedestrian while
the macroscopic models consider flows of pedestrian
entities. The macroscopic models are often used to
study large scale behavior and typically use network-
based models (e.g. (Hamacher and Tjandra, 2002)) or
fluid dynamics models (e.g. (Helbing, 1992)). The
microscopic models on the other hand are often in-
terested in local small scale behavior of pedestrian
flows. The microscopic models can be further dis-
tinguished into force models (e.g. (Burstedde et al.,
2001)), discrete-choice models (e.g. (Antonini et al.,
2006)) and agent-based models (e.g. (Ronald et al.,
2007)).
Despite of all the advantages and numerous re-
searches done before, the features mentioned above
can only be exploited if the simulation tool fulfills
several technical demands: First of all, the simula-
tor should provide results with a well defined accu-
racy: The simulation results should be investigated
and compared with real measurements. For certain
cases, the simulation model and parameter should
be calibrated in order to achieve better performance.
A second critical limitation is the simulation speed,
i.e. time needed until a simulation result is available.
Moreover, the usability of the software also affects
its acceptance. After all, the potential users are most
likely to be architects or government officer who are
neither familiar with mathematical modeling nor have
programing experiences. Therefore, the abstract re-
35
Zhou Y., Klein W. and Mayer H..
Guideline for Crowd Evacuation Simulation - Validation of a Pedestrian Simulator with RiMEA Test Scenarios.
DOI: 10.5220/0005436700350042
In Proceedings of the 4th International Conference on Smart Cities and Green ICT Systems (SMARTGREENS-2015), pages 35-42
ISBN: 978-989-758-105-2
Copyright
c
2015 SCITEPRESS (Science and Technology Publications, Lda.)
sults should be properly visualized to help users link
simulated scenarios to real situations.
Based on these prerequisites, our group developed
a pedestrian simulation environment named Crowd
Control, which has already been used for several
evacuation projects in the field of trains and build-
ings (K
¨
oster et al., 2010)(Davidich and K
¨
oster, 2012).
In the newly released version of our simulator, more
scenario-models such as fire / smoke, and flood are
integrated, which allow our simulator to meet various
simulation demands. In order to ensure its accuracy
after the extension, certain tests must be performed.
In this paper, we test our newly released simulator
with the test scenarios proposed by the RiMEA guide-
lines (RiMEA e.V., 2009) and document the test re-
sults. With the user-friendly graphical interface, we
are able to create the test scenario by simple mouse-
clicks. The test results show that our simulator passes
all the tests within short simulation time. Besides, the
2D and 3D visualization kits of our simulator allow
us to check the simulation results; a detailed analysis
can be done by exporting the results to Excel, e.g..
The remaining of the paper is organized as fol-
lows: In Section 2 the theoretical background and the
simulation model are briefly introduced; In Section 3
the software architecture is sketched; In Section 4 the
test scenarios and test results are documented; In Sec-
tion 5 the performance of the simulator is evaluated
and a conclusion is drawn based on the simulation re-
sults.
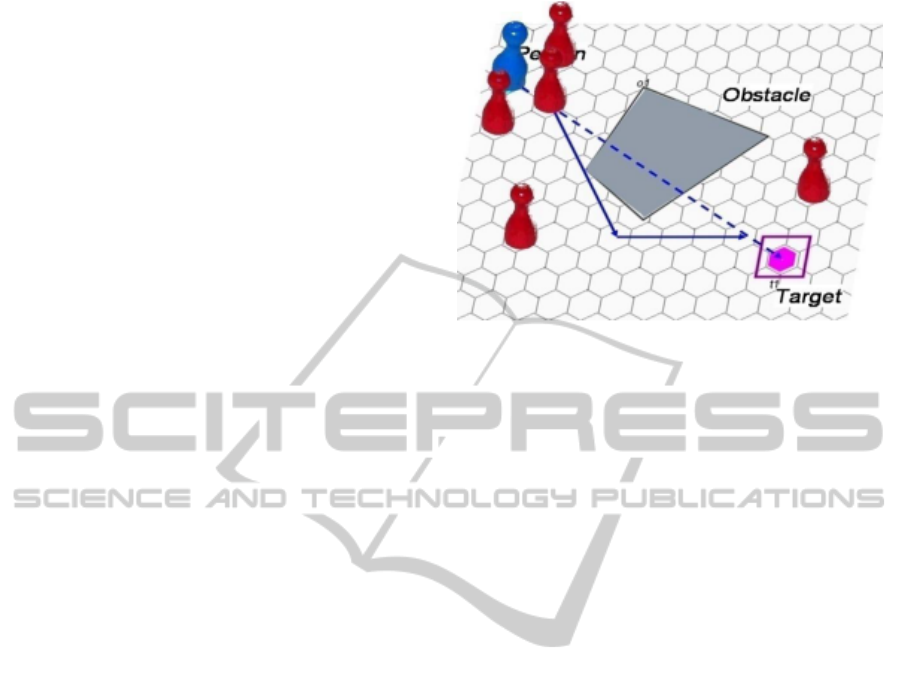
2 SIMULATION MODEL
The simulator tested in this paper is developed based
on a discrete, microscopic force model. The simu-
lation model is a cellular automaton on a hexagonal
grid (Fig. 1). At each time step each cell has a certain
state: It is either empty or occupied by a pedestrian
or a fixed obstacle. The positions are updated accord-
ing to a set of rules (K
¨
oster et al., 2010). In com-
parison to continuous simulation, a discrete model is
much faster and does not suffer from artifacts such
as instability factors like non realistic oscillatory be-
havior. In addition, it is easier to include interactions
of the pedestrian with dynamic events like closing or
opening gates or catastrophic events like fire spread,
since calculations can be restricted to discrete events
in time. While macroscopic pedestrian simulation is
predominantly focused on producing statistical data
(like flows and densities), microscopic simulation can
help to identify even the behavior of single pedestri-
ans. Of course one has to be aware that the behav-
ior of a specific single individual can never be antic-
Figure 1: Schematic sketch of a cellular automaton simulat-
ing microscopic pedestrian dynamics.
ipated, but the interaction of a larger number of in-
dividuals can be emulated by microscopic simulation
very well (Gilg et al., 2014).
In the simulation model, each pedestrian is ini-
tially assigned with an individual velocity, which is
considered as a normally distributed variable, whose
average and variance are given parameters. In each
time step, pedestrians adjust their speed during the
simulation as responses to the change of situation.
For instance, a pedestrian slows down his movement
when the crowd density is too high (for example con-
gestion). The observation area is divided in hexagon
cells and each cell is in a certain state for each time
step: It is as mentioned above either empty or occu-
pied and an occupied cell cannot be entered. In ev-
ery time step a person can move one cell forward or
stay at the current cell, but cannot move farther than
one cell. The update scheme of the cellular automa-
ton has to guarantee, that pedestrians with a higher
speed are allowed to move more often than pedestri-
ans with a lower speed. Thus a slow person might
not move at each time step compared to faster mov-
ing person. Once the set of persons which are allowed
to move is determined, they are updated sequentially.
The movement rule is similar to the so-called static
floor field cellular automaton (Burstedde et al., 2001),
in which the movement is determined by a potential
f . In the simplest case, the movement rule for a sin-
gle pedestrian is purely deterministic: Find the un-
occupied neighboring cell with the minimal total po-
tential value f
total
= f
navigation
(x;y) + f
pedestrian
(x;y).
In this equation, the f
pedestrian
(x;y) represents the
force that the pedestrians repel each other, while the
f
navigation
(x;y) represents the force that the pedestri-
ans are attracted by the target. For more details about
the simulation model, please refer to (K
¨
oster et al.,
2010).
SMARTGREENS2015-4thInternationalConferenceonSmartCitiesandGreenICTSystems
36
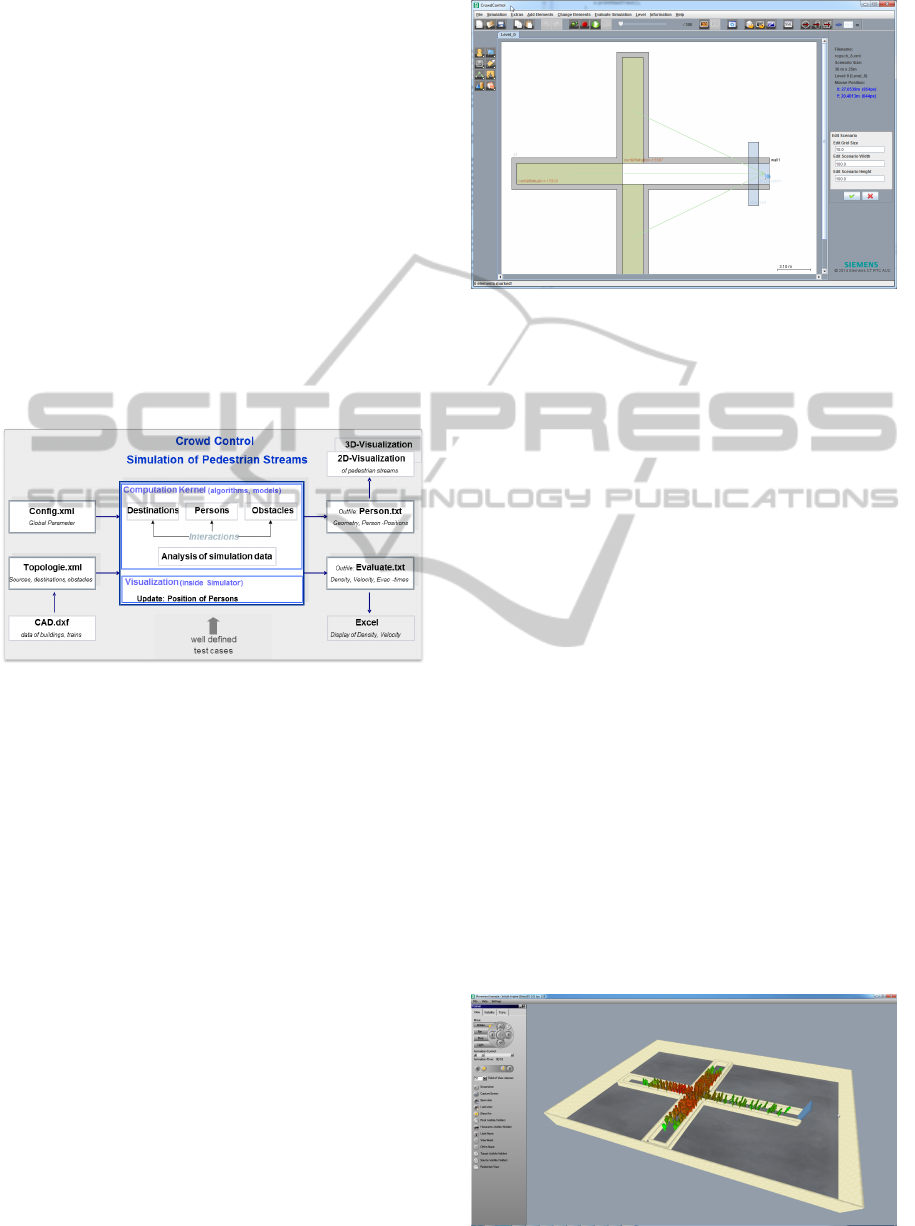
3 SOFTWARE ARCHITECTURE
In this section, we will introduce the architecture of
our simulator. Figure 2 shows the main components
of the software and its data flow. The software com-
prises a simulation kernel, a graphical user interface,
a tool for statistical evaluation and a 3D visualiza-
tion. The graphical user interface enables the user to
create specific scenarios using tools provided by the
software. Besides, the scenarios also can be extracted
from architectural drawings (Mayer et al., 2014) or
data bases. In addition, it is possible to couple the
simulation with third party tools, such as Microsoft
Excel, which is very useful for processing results and
analyzing data. Furthermore, the tool has been cali-
brated with many real measurements and recently ex-
tended by adding more items like fire model, flood
model to extend its functionality.
Figure 2: Software Architecture.
Figure 3 shows the graphical user interface, in
which user can create a scenario by adding source,
destination, walls, obstacles and staircases. Besides,
it provides the user possibilities to create more vivid
scenarios by add 3D elements, such as trees. The re-
cent version also allows user to add extra dynamic
models such as fire spots to simulate the pedestrian
behavior under certain emergency situations. All the
objects can be configured by adjusting the parameters.
For instance, the user can assign a source (the place
where a group of pedestrians are generated) with a
pedestrian velocity profile. In this way, sources rep-
resenting pedestrians with different ages can be gen-
erated. In this paper, all the test scenarios are created
by this graphical user interface.
The created scenarios and the parameter of the
simulator are saved as XML files, which contain the
topology and model relevant information. Those in-
put files are passed to the computation kernel, which
updates the position of persons for each time step.
The simulator generates two types of output files.
One type of output file contains the geometry and per-
son position information, which is used to visualize
Figure 3: Graphical User Interface.
the crowd movement combined with a 2D or 3D visu-
alization engine. The other type of output file contains
the density, velocity and evacuation time information,
which can be exported to external software, such as
Excel to analyze the results. In 2D visualization, each
pedestrian is represented as a colored dot. The color
of the dot is determined by the person density, which
is shown via a very intuitive coloring scheme green
yellow - red for a small, medium or high density. In
this way, critical spots can be easily identified by the
presence of red color. The 3D visualization is realized
by an interface to the 3D-Game-Engine Irrlicht. The
computed output file of the simulation storing the ge-
ometry and all persons positions at all time steps is di-
rectly taken over by the Irrlicht-Engine. The 3D visu-
alization is capable of displaying stairs, doors, narrow
corridors, passages, ramps and pillars. It helps the
user interpret and analyze the results directly. Similar
to the 2D-visualization, crowds or congestion can be
seen and discussed directly by that coloring scheme.
Figure 4 shows an example of a 3D visualization.
The user can follow the movement of the persons in
a familiar, well known 3D-environment without any
delay. The control panel on the right side allows the
user to navigate and move in the 3D-Game-Engine
to gain a better observation perspective. The zoom
functionality enables the user to analyze details of the
scenarios. The animation control allows the user to
Figure 4: Example of a 3D Visualization.
GuidelineforCrowdEvacuationSimulation-ValidationofaPedestrianSimulatorwithRiMEATestScenarios
37

review the simulation or analyze the situation of a spe-
cific time. Using menus under the control panel, the
user can even identify and walk as one specific person
through the scenario. All those functions are devel-
oped to increase the usability, which as mentioned in
the first section is very crucial for the acceptance of a
simulator.
4 RiMEA TEST SCENARIOS AND
TEST RESULTS
As mentioned in the first section, a pedestrian sim-
ulation tool must fulfill several technical demands
and certain guidelines, such as the IMO (Interna-
tional Maritime Organization) (IMO, 2014) guide-
lines and the RiMEA (Richtlinie f
¨
ur Mikroskopische
Entfluchtungs-Analysen) guidelines (RiMEA e.V.,
2009). According to the Rimea guideline, 14 scenar-
ios should be tested in order to check the performance
of a person stream simulator and verify its function-
ality. The test scenarios in this paper are generated
according to the Rimea-Standard V.2.2.1. The test re-
sults and their corresponding parameters for the con-
crete application to the Crowd Control simulation tool
from Siemens are documented in this paper. Due to
the special grid property of our simulator, in addition
to the standard RiMEA tests, the tests are repeated
several times in different rotation angle and shifted
horizontally and vertically to prove the robustness of
the simulator. Besides that, the scenarios are tested
with different grid sizes.
There are some important assumptions in the
RiMEA guideline. The first assumption is the ve-
locity of person group with different ages on the
ground. The velocities are defined in the following
table 1 (Weidmann, 1992):
Table 1: Velocities on the ground according to Weidmann.
Person Group(Age)
Velocities on the Ground (m/s)
Minimum Maximum
under 30 0.58 1.61
30 to 50 1.41 1.54
Over 50 0.68 1.41
Person with limited mobility 0.46 0.76
The second assumption is the velocity of person
group with different ages climbing up and down the
staircases. The velocities are defined in the following
table 2 (Fruin, 1971):
All tests are repeated several times in order to
identify the influence of the basic grid to the simu-
lation results. The tests are repeated in the following
orders:
• by rotating the topology in different angles
Table 2: Velocities on the staircase according to Fruin.
Person Group(Age)
Velocities on the Staricase (m/s)
Climbing Down Climbing Up
Indoor Outdoor Indoor Outdoor
under 30 0.76 0.81 0.55 0.58
30 to 50 0.65 0.78 0.50 0.58
Over 50 0.55 0.59 0.42 0.42
Person with limited mobility 0.42 0.32
• by shifting the topology vertically
• by shifting the topology horizontally
• by using different grid sizes for the basic hexago-
nal grid
The first 3 tests are single pedestrian tests. In the
first test, it should be proven, that a person with a
given velocity (1.33m/s) runs through a 2 m wide,
40 m long corridor within the given time. The ex-
pected time is between 26 to 34 seconds. Inaccuracy
tolerance of the person position is 0.4 m (body size,
1 second reaction time). Inaccuracy tolerance of ve-
locity is 5%. In the second test, the person retains
the same given velocity as the first test climbing up a
staircase. It should be proven, that a person climbs up
a 2 m wide, 10 m long (the slope length) stair with a
defined velocity in a given time range. In the third
test, the person retains the given velocity climbing
down a staircase. It should be proven, that a person
climbs down a 2 m wide, 10 m long (the slope length)
stair with a defined velocity in a given time range.
Table refres:test1-3 shows the test results of the first
3 test scenarios. From the table, we can see that all
the results of repeated tests (shift, rotate topology and
change grid size) lie in the given time range.
Table 3: Test Results of RiMEA Test 1-3.
RiMEA Test Number
Tested Time of Simulator (s) Allowed Time Range (s)
Minimum Maximum Minimum Maximum
Test 1 30.27 32.72 26 34
Test 2 11.63 12.89 10.84 14.17
Test 3 8.69 9.25 7.22 9.44
RiMEA test 4 is to check the relationship of a spe-
cial flow with the person density. The special flow
with respect to the person density is given:
Θ
s,max
= ρ · 1.34 · (1 − e
−1.913·(
1
ρ
−
1
t·5.4
)
) (1)
In order to realize the test, a ring is generated with
internal radius 70 meter and external radius 74 meter
(Fig. 5(a). 8 person blocks each generates 5000 per-
sons and the persons walk in circles. The ring radius
remains constant, but the number of persons increases
as time goes by. The test results are plotted in the di-
agram (Fig. 5(b)). We can see that the test results fit
the Weidmann diagram very well.
RiMEA test 5 is to check the reaction time of each
person. In this test, 10 persons stand in an 8 m×5 m
SMARTGREENS2015-4thInternationalConferenceonSmartCitiesandGreenICTSystems
38
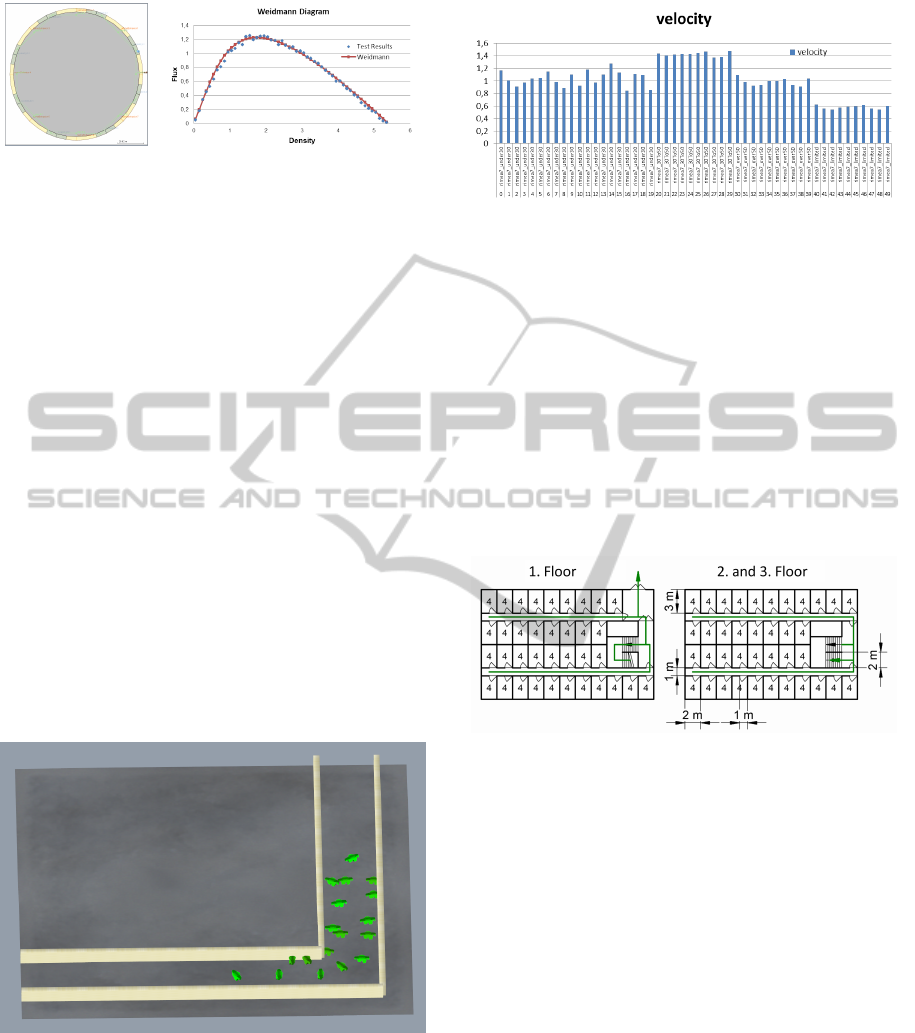
(a) Topology (b) Result
Figure 5: RiMEA Test 4.
room with a 1 m wide exit in the middle of the 5 m
long wall. The reaction time is to be set uniformly
distributed in the interval of 10 s and 100s. We need
to verify that each reaction time corresponds to a per-
son. In this test, our simulator generates 10 persons
in the interval [10,100], since the first person is not
generated at 10 second, the time interval between two
persons reaction time is 90/11. We can compare the
reaction time of each person with the expected value
10 + i · d, where i is the index of the person and d is
the time interval between two persons reaction time.
The simulation results confirm the conclusion.
In RiMEA test 6, 20 pedestrians walk along a 2 m
x 10 m corridor and turn left, go further along a 2 m x
10 m corridor. There should be no person go though
the walls. To carry out this test, we set three areas out-
side the corridor (three rectangular areas: outside top
left, outside top right and outside bottom) to check if
the number of person in each area equals to zero. We
also repeated this test to test the robustness of the sim-
ulator and all the tests fulfill the requirement. Fig 6
shows one of these tests.
Figure 6: RiMEA Test 6.
In RiMEA test 7, we choose a group of 50 persons
and assign the pedestrian velocity according to table 1
listed above. The task is to check if the simulated
velocity corresponds to the velocity listed in the table.
Fig 7 shows the test results. From this figure, we can
see that the minimal velocity and maximal velocity of
each group lie in the given range listed in table 1.
Figure 7: Result of RiMEA Test 7.
In RiMEA test 8, a test topology with three floors
is given (Fig. 8). Each room contains 4 persons and
has a 1 meter wide door. This topology is adopted to
test the influence of parameter in each person on the
total evacuation time. If the parameter of each per-
son is changed, the total evacuation time should also
change correspondingly. In this test, the persons are
assigned with different velocities for each simulation
run. We need to check if the evacuation time is within
the given tolerance. We also repeat the tests with dif-
ferent topology orientation and location, the evacua-
tion time variation is under the given tolerance.
Figure 8: Topology of RiMEA Test 8.
In RiMEA test 9, 1000 persons with same figure
size and no reaction delay are uniformly distributed
in a public room with four exits. The topology of the
test room is shown in the following picture (Fig. 9).
Assume that people in this group are all adults and
their velocities are set according to table 1. In the
first test, the time of the last people leaves the room is
documented. Then two exits are closed and the test is
repeated to check the time of the last people leaves the
room again. Then we calculate the ratio of the evac-
uation time with four doors open and the evacuation
time with two doors open. If the ratio lies between
0.4 and 0.6, the simulator passes the test. In our test,
the ratio lines between 0.49 and 0.56.
For RiMEA test 10, we construct a test topology
(Fig. 10) with a corridor, 12 rooms each with a 0.9 m
door are located along the corridor. 23 adults with no
reaction delay and defined velocity according to the
Table 1 are scattered in rooms. The people in room
1,2,3,4,7,8, 9 and 10 are assigned to use the main
GuidelineforCrowdEvacuationSimulation-ValidationofaPedestrianSimulatorwithRiMEATestScenarios
39
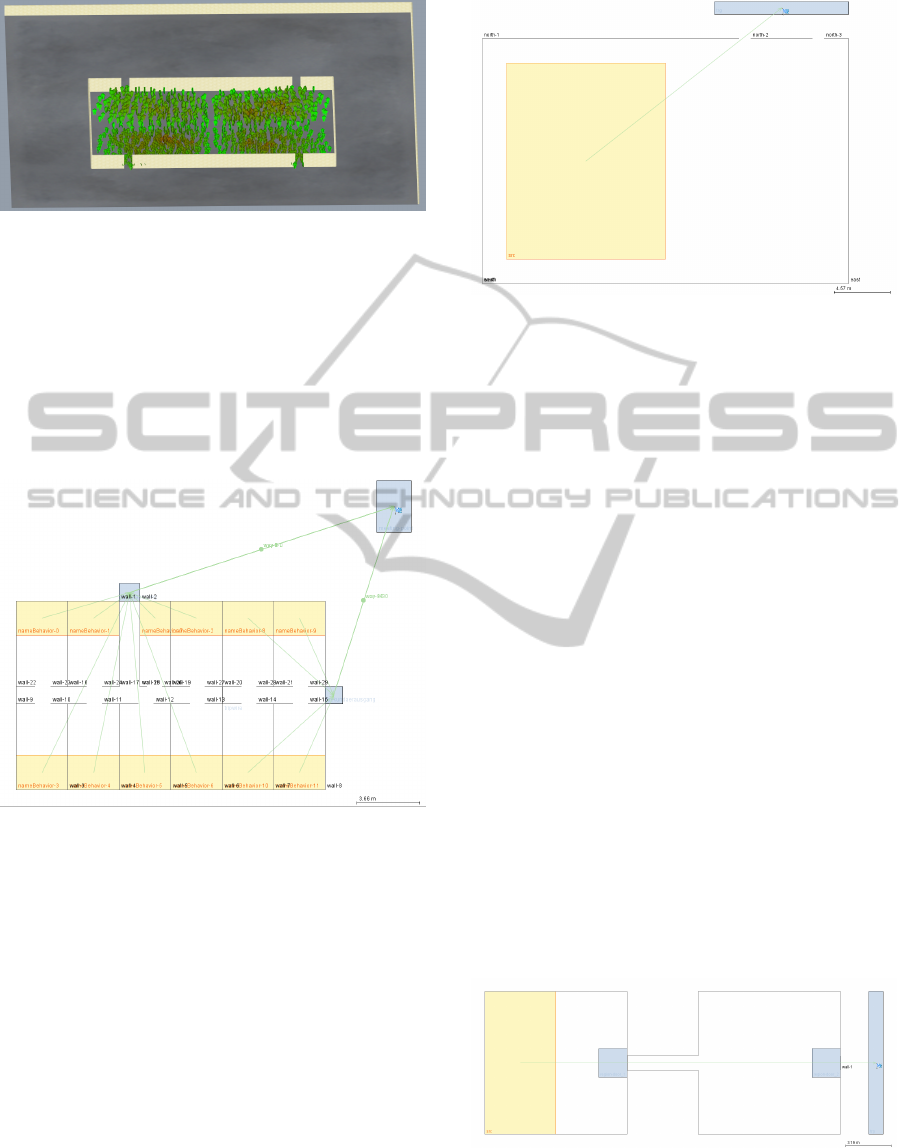
Figure 9: RiMEA Test 9 with 4 Doors Open.
exit and the remaining people are assigned to use the
second exit. The expected result is that the people
behave just like the assignment and leave the region
using the assigned exit. We set a tripwire in the corri-
dor. The tripwire is located between room 5 and room
11, which separates two exits. If the number of per-
sons who cross this line is 0, it means that persons use
the assigned exit to leave the room. In all the tests, no
person crosses the tripwire.
Figure 10: Test Topology for RiMEA Test 10.
RiMEA test 11 is about the choice of emergency
route. The test topology is a public room with two
exits: exit 1 and exit 2 (Fig. 11). 1000 adults with no
reaction delay are gathered on the left side of the room
(achieve the maximal person density). The velocities
of the people are set according to the Table 1. The
people should leave the room through two exits. The
expected result is that the people prefer to leave the
room through a nearer exit (in this case, exit 1), but if
the exit 1 is over-crowded, people should choose the
alternative exit (exit 2) to leave the room.
In this test two tripwires are defined to count the
number of persons crossing these lines. The number
of the persons who cross the tripwire 1 stands for the
number of persons who leave the room with exit 1,
and the number of the persons who cross the tripwire
2 stands for the number of the persons who leave the
Figure 11: Test Topology for RiMEA Test 11.
room with exit 2. The test criteria is to check the num-
ber of persons using exit 1 and exit 2 respectively. The
simulator passes the test if two criteria are satisfied:
1. More persons use exit 1 than exit 2;
2. At least 20% of the persons use exit 2;
In all the repeated tests, the ratio of the persons using
the exit 2 lies between 22.6% and 42.4%, the simula-
tor passes this test as well.
The test topology of RiMEA test 12 is two rooms
connected by a narrow corridor (Fig. 12). 150 adults
with no reaction delay are gathered on the left side
of room 1 and room 2 has an exit. These 150 people
in room should leave the room through exit in room
2. Since the corridor is very narrow, the person flow
is limited. The expected result is that the crowded
condition occurs only in room 1 but not in room 2.
For this test, we select two areas (one is in room 1
right before the narrow corridor and the other is in
room 2). The person density of these two areas are
checked to see where the crowded condition occurs.
The simulation results show that the maximal person
density in region 2 lies between 1.40 to 1.96, while
the average person density in region 1 lies between
3.33 to 4.63, which confirms the expectation that the
crowded condition occurs only in room 1 but not in
room 2.
Figure 12: Test Topology for RiMEA Test 12.
The test topology of RiMEA test 13 is a room
connected to a staircase toward upstairs by a corri-
SMARTGREENS2015-4thInternationalConferenceonSmartCitiesandGreenICTSystems
40
dor. 150 adults with no reaction delay and velocity
according to Table 2 are gathered in the room. These
people leave the room by taking the staircase. The
expected result is that the crowded condition occurs
at the exit of the room to the corridor. Besides, peo-
ple are crowded in front of the staircase and the sit-
uation becomes worse as the time goes by, since the
person flow over the staircase is smaller than the cor-
ridor. The test topology is constructed in two levels:
at the first level, there is a room, source, a corridor and
a staircase; at the second level, there is a staircase and
a target area (Fig. 13). For this test, we define two ar-
eas in the test topology. Area 1 is located at the room
exit and area 2 is located in front of the staircase. We
count the person density of these two areas to check if
the maximal person density is larger than 3 (definition
of crowded situation). The test results show that the
maximal person density at the room exit lies between
3.24 and 4.28. The maximal person density in front
of the staircase lies between 3.78 and 4.72. The per-
son density of both areas exceeds the threshold of the
definition of crowded situation.
(a) Level 1 (b) Level 2
Figure 13: Test Topology of RiMEA Test 13.
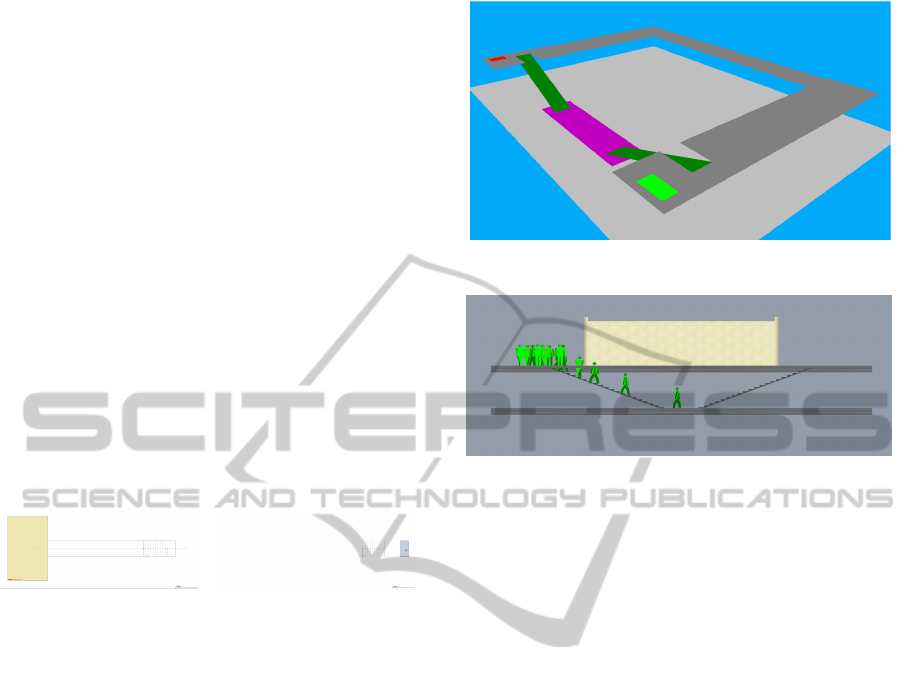
The last RiMEA test refers to the simulator con-
figuration. The test topology is shown below (Fig.
14). The start area and the targeted area are located
at the second floor and marked with different colors.
The start area is marked as red and the targeted area is
marked as green. They are further connected by two
staircases and a long corridor on the ground floor. The
task is to check how a pedestrian chooses his route: he
chooses a long route which is on the same floor or a
short route though the staircases and the corridor on
the ground floor. For different simulators, different
choices can be made (short, long, mixed or config-
urable). Our simulator supports the version ”short”.
That means all persons select the shortest path. In this
test, we construct a two levels topology: the first level
has two staircases and no other obstacles; the source
and target areas are located at the second floor. Be-
sides the staircases to downstairs, there is a corridor
connecting these two areas at the same level (Fig. 15).
The simulator passes the test if no person crosses the
tripwire set in the second floor corridor. The tests are
repeated by rotating, shifting the topology as well as
changing the cell size to verify the robustness of the
simulator. In all tests, the number of persons who
cross the tripwire equals to zero.
Figure 14: Test Topology for RiMEA Test 14.
Figure 15: Constructed Topology for RiMEA Test 14.
5 CONCLUSIONS
In this paper, all tests listed in the RiMEA guideline
are implemented and used to test the Crowd Con-
trol Simulator Version 2.2. The tests are repeated
by rotating, shifting the topology as well as chang-
ing the cell size to verify the robustness of the simu-
lator. The test results show that the simulator passes
all the tests, which indicates its reliability and robust-
ness. All of the mentioned RiMEA test cases are part
of a larger test suite containing additional internal test
cases, which compares the simulation results auto-
matically with given result values. These test cases
should be checked after each software update.
Our simulator offers architectures, city planners,
authorities and other potential users a powerful tool to
get precise and valuable simulations results, in order
to improve the infrastructure planning and the safety
of passengers. This new version of the simulator not
only allows the user to create a test scenario by us-
ing its graphical user interface, but also interacts with
BIM (Building Information Modeling) model to im-
prove the performance of the building (Mayer et al.,
2014). With the newly integrated emission model
(such as fire, smoke) and flood model, the simula-
tor can calculate an optimal escape route for emergent
situation provided that the building is equipped with
sensors and detectors. There are enough applications
for a robust reliable pedestrian behavior simulation
tool like our Crowd Control Simulator. It is highly de-
sirable to complement the RiMEA tests with scenar-
GuidelineforCrowdEvacuationSimulation-ValidationofaPedestrianSimulatorwithRiMEATestScenarios
41

ios based on measured data. However, collecting this
data and finding appropriate measures for qualitative
assessment of simulation results is still an open field
of research. It is also the interests of the authors to
collect more test scenarios, on which different mod-
els can be tested, compared and calibrated.
REFERENCES
Antonini, G., Bierlaire, M., and M.Weber (2006). Discrete
choice models of pedestrian walking behavior. Re-
search Part B: Methodological, 40.
Burstedde, C., Kaluck, K., A.Schadschneider, and Zittartzl,
A. (2001). Simulation of pedestrian dynamics using
a two dimensional cellular automation. Physica A:
Statistical Mechanics and its Applications, 295.
Davidich, M. and K
¨
oster, G. (2012). Towards automatic and
robust adjustment of human behavioral parameters in
a pedestrian stream model to measured data. Safety
Science, 50.
Fruin, J. (1971). Pedestrian planning and design.
Metropolitan Association of Urban Designers and En-
vironmental Planners.
Gilg, A., Klein, W., Mayer, H., and Witte, F. (2014). Intel-
ligent crowd control, the various use cases in public
mass transit. In International Conference on Railway
Engineering 2014.
Hamacher, H. and Tjandra, S. A. (2002). Mathematical
modelling of evacuation problems: A state of the art.
Pedestrian and Evacuation Dynamics.
Helbing, D. (1992). A fluid-dynamic model for the move-
ment of pedestrians. Complex Systems, 6.
IMO (2014). Guidelines of the international mar-
itime organisation imo. http://www.imo.org/Pages/
home.aspx.
Kneidl, A., Hartmann, D., Mayer, H., and Borrmann, A.
(2012). A holistic multi-scale approach for simulation
o pedestrian. In Proceedings of the 6th International
Conference on Pedestrian and Evacuation Dynamics.
K
¨
oster, G., Hartmann, D., and W.Klein (2010). Micro-
scopic pedestrian simulations: From passenger ex-
change times to regional evacuation. In Operations
Research Proceedings.
L
¨
ammel, G., Rieser, M., and Nagel, K. (2008). Large scale
microscopic evacuation simulation. In Pedestrian and
evacuation dynamics 2008.
Mayer, H., Klein, W., Frey, C., Daum, S., Kielar, P., and
Borrmann, A. (2014). Proc. of the ashrae/ibpsa-usa
pedestrian simulation based on bim data. In Building
Simulation Conference.
RiMEA e.V. (2009). Rimea guidline on evacuation scenar-
ios. http://www.rimea.de/fileadmin/files/dok/analyse/
Analyse PedGo 20060609.pdf.
Ronald, N., Sterling, L., and M.Kirleyr (2007). An agent-
based approach to modelling pedestrian behaviour. In
Lecture Notes in Computer Sciencel.
Weidmann, U. (1992). Transporttechnik der fussg
¨
anger.
Schriftenreihe des Institut f
¨
ur Verkehrsplanung,
Transporttechnik, Strassen- und Eisenbahnbau, 90.
SMARTGREENS2015-4thInternationalConferenceonSmartCitiesandGreenICTSystems
42
