
New Aproaches for High-Resolution Optical Microscopy
Denis E. Trancă and George A. Stanciu
Center for Microscopy-Microanalysis and Information Processing, University Politehnica of Bucharest, Splaiul
Independentei, Bucharest, Romania
1 RESEARCH PROBLEM
The optical microscopy field has been largely
developed in the past decade and many efforts have
been made to get improvements in respect to the
optical resolution. A special attention has been paid
to the detection techniques of the evanescent waves,
which are not affected by diffraction, but
unfortunately they do not propagate into space.
Among these techniques, the apertureless Scanning
Near-field Optical Microscopy (a-SNOM) (Patane et
al., 2004) have been particularly proved efficient in
many ways. Usually it is build as an upgrade to an
Atomic Force Microscope (AFM) and it make use of
an external laser beam, which is focused on the tip
of the AFM probe (Brehm et al., 2005). This
configuration allows for simultaneous s-SNOM and
AFM imaging. The investigation is done by
maintaining the probe in a fixed position, and
moving the sample point-by-point in a raster scan
manner.
Depending on the type of the interaction between
the tip, the focused external laser beam and the
surface of the sample, three major a-SNOM
techniques exist, which return complementary
optical information: a) scattering - Scanning Near-
field Optical Microscopy (s-SNOM) (Knoll and
Keilmann, 2000, Hillenbrand, 2007); b)
Fluorescence Apertureless Scanning Near-field
Optical Microscopy (FASNOM) (Fragola et al.,
2003, Huang et al., 2006), and c) Apertureless
Scanning Near-field Optical Microscopy with
Second Harmonic Generation (ASNOM-SHG)
(Zayats and Sandoghdar, 2001).
In the first approach (s-SNOM), the illuminated
nano-tip of the investigating probe is equivalent to
an oscillating electric dipole (Brehm et al., 2005).
The electric field component of the incident beam
creates this dipole in the tip and determines the
dipole to oscillate with the same frequency as the
electric field intensity. As a result, the oscillating
electric dipole will re-emit light, behaving like an
antenna. Because in a typical AFM investigation the
tip is located in the proximity of the sample, the
oscillating dipole will be highly influenced by the
presence of the sample’s surface. In this case, the
surface is equivalent to a mirror dipole (located in
the sample, close to the surface), which will interact
with the original dipole. The interaction is reciprocal
and the light emitted by the oscillating electric
dipole will carry optical information related to the
optical characteristics of the sample’s surface.
The second approach (FASNOM) exploits the
fact that metallic and semiconductor nano-structures
have complex influence on fluorescence phenomena
(Huang et al., 2006). More precisely, it relies on the
fact that placing a metallic structure in the proximity
of a fluorophore leads to fluorescence quenching or
enhancement and also to a modification of both the
radiative and the non-radiative rates of the probe,
inducing changes in both the fluorescence lifetime
and the in emission intensity. These changes can be
exploited to obtain sub-wavelength resolution
imaging.
The third approach (SHG-ASNOM) is based on
a nonlinear optical effect in which either the tip or
the sample is SHG active. In this configuration, the
local second harmonic field generated at the
sample’s surface is probed.
While all these approaches are capable of sub-
wavelength optical resolution (on the order of
curvature radius of the tip, usually few nanometers),
the a-SNOM techniques are widely limited by the
difficulties in understanding the collected data. This
situation is generated by the fact that the existing
mathematical models are either incomplete or
extremely complicated (Brehm et al., 2005). In the
same time, the experimental acquisition data process
is highly affected by background light (representing
noise), which appear due to multiple light reflections
between the sample’s surface and the probe’s body;
this background light arrives on the detector and has
a higher intensity than the light emitted from the
near-field of the sample, assessing thus difficulties
in the detection process.
19
E. Tranc
ˇ
a D. and A. Stanciu G..
New Aproaches for High-Resolution Optical Microscopy.
Copyright
c
2015 SCITEPRESS (Science and Technology Publications, Lda.)

2 OUTLINE OF OBJECTIVES
The objectives of the presented work are focused on
addressing the major issues faced by a-SNOM
techniques. Thus, an advancement regarding the
mathematical models associated with the physical
phenomena is on the objective list. Analyses of the
mathematical models will provide clues for
improvements with respect to data interpretation
process – that is another major objective. Because of
the difficulties associated with a-SNOM techniques,
few investigation areas had been explored till now.
Thus, an increased attention is given to new research
areas where a-SNOM can be used successfully – this
being the third major objective of the presented
work.
3 STATE OF THE ART
In the frame of near-field optical investigations, two
major categories of microscopes are available: (a)
aperture-SNOM, and (b) apertureless-SNOM. The
first class uses a metal-coated tapered optical fibre
as a probe (NOVOTNY et al., 1995). Although
SNOM with aperture is more popular and already
commercially available, it suffers from a major
drawback, as a compromise is necessary between the
dimension of the aperture and the power of the
incident laser beam. For higher resolution, the
aperture needs to be smaller; in the same time, for an
efficient transmission, a smaller aperture requires a
greater optical power, which may be harmful to the
probe’s tip. This situation limits the lateral
resolution to about 100 nm.
The second class of near-field microscopes is
represented by the so-called “apertureless-SNOM”.
Its functioning principle has been already presented
in the introductive part of the paper. As this class of
near-field microscopes present several advantages
over SNOM with aperture (better resolution;
independence on the radiation wavelength), it itself
confronts with a series of difficulties. The major
drawback is the presence of a background light
(noise), which affects the detection process. Several
techniques have been developed to date in order to
discriminate between the near-field signal and the
signal generated by the background light. Higher
harmonic demodulation (HHD) (Maghelli et al.,
2001) takes advantage over the nonlinear
dependence of the intensity of the light emitted from
the near-field with the distance between the tip and
the sample’s surface. Thus, oscillating the probe in a
sinusoidal movement above the sample (as in AFM
tapping mode) and detecting the signal on a higher
harmonic of the oscillation frequency f
o
, the signal-
to-noise ratio (SNR) will increase. This is due to the
rather linear dependency of the background light on
the tip-sample distance.
However, HHD is not sufficient for efficient
background reduction. Along with it, interferometric
detection is also used. During the last decade, three
major interferometric methods were used: homodyne
(Knoll and Keilmann, 2000), heterodyne (Gomez et
al., 2006) and pseudoheterodyne detection (Ocelic et
al., 2006). Among these, the last one proved to be
particularly efficient and easy to implement. Is
consists in a modified Michelson interferometer, in
which one arm is used for the illumination of the tip
and for collection of the near-field emitted light
(together with the background). The other arm is
travelled by a reference beam, which is phase-
modulated by an oscillating mirror. This reference
mirror oscillates with a certain frequency M (much
smaller than the oscillating frequency of the probe)
and certain amplitude, A. The two beams finally
interfere on the detection path, on which a detector
is placed. Without the reference beam, the Fourier
spectrum of the electric signal generated by the
detector will contain signal components situated at
the probe’s oscillation frequency and at its
harmonics. When the reference beam is present, the
phase modulation determines the appearance of two
side-bands around each initial harmonic component.
These side-bands contain components situated at
nf
o
±mM. It had been demonstrated that the
background light has a minimal influence on these
side-bands; thus, detection on a frequencies situated
in these side-bands assures for best SNR.
A recently reported alternative to pseudo-
heterodyne detection is represented by the
combination between synthetic optical holography
and s-SNOM (Schnell et al., 2014). In this case, the
resulting image is a hologram, which contains both
amplitude and phase data of the near-field emitted
light.
Regarding the mathematical models, two major
models are largely used: Oscillating Point Dipole
Model (OPDM) (Knoll and Keilmann, 1999) and
Finite Dipole Model (FDM) (Cvitkovic et al., 2007).
To date, a-SNOM has been applied successfully in
several areas, including: nano-imaging (Schnell et
al., 2010), characterisation of plasmonic structures
(Kim and Kim, 2012), near-field spectroscopy
(Stiegler et al., 2011), nano-chemical
characterisation (Berweger et al., 2013), or SHG and
fluorescence on representative samples (Huang et
PHOTOPTICS2015-DoctoralConsortium
20

al., 2006, Zayats and Sandoghdar, 2001). The
presented work extends the application areas of a-
SNOM in areas like biology, electronics and
measurement of electric permittivity in the visible
domain (using the OPDM). Detailed studies
regarding the influence of functioning parameters
upon the image contrast in a pseudo-heterodyne
scheme was also done (Tranca et al., 2014).
4 METHODOLOGY
The methodology is divided in three sections, which
follow the three major objectives described before.
Thus, advances in mathematical modelling are
represented by improvements regarding the
oscillating dipole model (OPDM), which are
obtained by advanced mathematical analysis of
signal spectra. Theoretical results are correlated with
the experimental data in the purpose of advancing
the data interpretation process. A quest for new
applications for s-SNOM investigations is worked
up by using the results obtained in the previous steps
and experimental data on samples containing
dielectrics or biological tissues.
4.1 Signal Analysis
The intensity of the near-field scattered light σ is
proportional with the amplitude of the incident light
phasor E
o
and a factor α
eff
named the effective
polarizability (Ocelic et al., 2006):
~
eff
o
E
(1)
According to the oscillating point dipole model, the
effective polarizability has the form:
1
1
3
16
s
eff
s
az
(2)
In Eq. (2), α stands for the polarizability of the tip,
and β(ε) depends on the local sample electric
permittivity, ε
s
by the relation:
1
1
s
s
s
(3)
Assuming a sinusoidal oscillation of the probe above
the sample, this parameter can be written as:
1
1sin2
2
zft
o
oo
dz
(4)
Here, d
o
is the min. distance between tip-sample
during the probe’s oscillation above the sample, z
o
is
the oscillation amplitude of the probe, f
o
is the
oscillation frequency of the probe and t is time.
Rewriting Eq. (2), the intensity of the near-field
scattered light will have the following form:
1
1sin2
2
1
1
1sin2
2
3
16
3
16
,
zft
o
oo
o
zft
o
oo
ad
ad
tE
(5)
From this point, one can spectrally analyse the
function given by Eq. (5), by using the exponential
Fourier transformation method. According to
Fourier analysis, a function can be written as a sum
of its harmonic components. In our case, the
harmonic components can be written as:
3
1
116
3
1sin
2
1
1
2
jnu
n
o
o
du
e
cE du
a+
(6)
Although the integration calculus in Eq. (6) is not a
common one and its calculation requires special
mathematical algorithms, its complexity decreases if
it is calculated for certain values of the n factor.
Using numerical methods, the definite integral in Eq.
(6) can be easily calculated. Thus, for a certain
integral positive n and in the case of well-known
experimental conditions (regarding the AFM
functioning parameters and the characteristics of the
probe), the only variable in Eq. (6) remains β.
However, the value of the spectral component c
n
cannot be experimentally determined, and this is due
to the background light presence. By using the
pseudoheterodyne detection scheme and detecting
the signal on the side-bands created around every
spectral component of the initial signal, the
influence of the background light can be bypassed.
The detection on a certain component located at
nf
o
±mM can be accomplished by means of a lock-in
amplifier. In this case, a reference beam is used and
its mathematical form will be (as a Fourier series):
exp 2
Rm
m
E
jm Mt
(7)
The coefficients ρ
m
can be written as:
2
exp
2
mm R
JA jjm
(8)
Here, ρ is the amplitude of the amplitude of the
reference wave phasor, A is the oscillation amplitude
of the reference mirror, λ is the wavelength of the
beam, M is the oscillation frequency of the reference
mirror, Ψ
R
is the mean phase difference between the
two interferometric pathways and t is time. In Eq.
(8), J
m
stands for the Bessel function of order m.
The resulting interference signal U between the
NewAproachesforHigh-ResolutionOpticalMicroscopy
21
near-field light σ will and the reference beam E
R
will
have the spectral components u
n,m
:
,
2
nm n m n m
u real c real imag c imag
(9)
The above equation expresses the exact form of a
single spectral component of the higher harmonic
demodulated, pseudo-heterodyned near-field signal.
Together with the Eq. (6) and (8), it can be used to
develop a detailed analysis of the near-field signal.
The main purpose is to understand the way in which
the optical parameters of a sample influence the
detected signal. In the same time, it is important to
understand the way in which every functioning
parameter of the system influences the detected
signal and the overall image contrast.
4.2 Data Interpretation
As the background light has a minor influence on the
components situated at frequencies nf
o
±mM, with
m≠0, a proportional relation can be assumed
between the value of an image pixel I
n,m
and the
amplitude of the harmonic component u
n,m
on which
the detection is employed. This can be expressed as
a linear mathematical relation. Based on this
proportionality, the spectral component c
n
from Eq.
(9) can be determined. Introducing c
n
in Eq. (6), the
value for β is obtained and with Eq. (3), the electric
permittivity of the investigated material is then
determined. Thus, the data obtained by s-SNOM
investigation can be interpreted on the basis of the
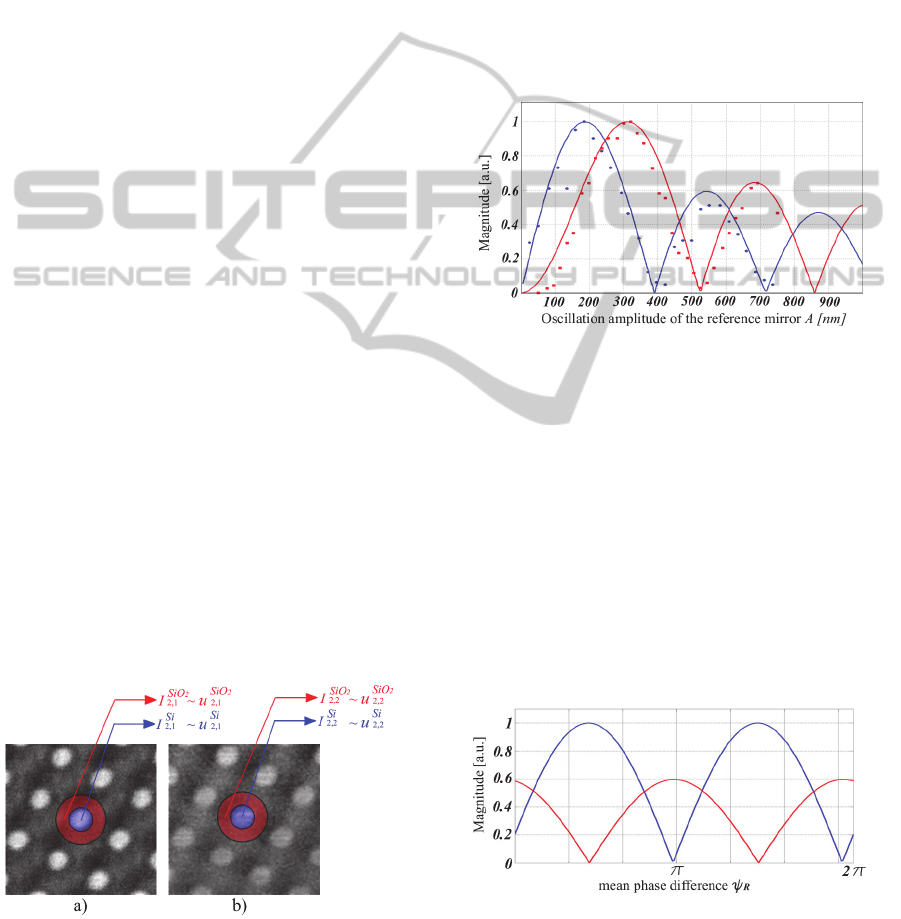
local electric permittivity of the sample. Figure 1
shows two images of a sample containing Si and
SiO
2
domains. The images were detected at,
respectively, 2f
o
+M and 2f
o
+2M. Both images are
necessary for electric permittivity measurement. The
figure also shows how the areas of different
materials (Si and SiO
2
) were selected for local
permittivity determination.
Figure 1: 2x2 μm s-SNOM images of the Si/SiO
2
sample;
a) detection on 2f
o
+M; b) detection on 2f
o
+2M. The
central Si region is marked with blue and the surrounding
SiO
2
region is marked with red.
A crucial role in data interpretation process is
played by the functioning parameters of the system,
which can easily influence the image intensity and
contrast. An example is the oscillation amplitude, A,
of the reference mirror. It has been demonstrated
that the image contrast is strongly dependent on A
and depending on the value of A, the image contrast
can be inverted and even reduced to zero. However,
the contrast variation is due to variation of the
amplitude of the spectral components of the signal
with the amplitude A. In Figure 2 is presented the
variation of the magnitudes of the spectral
components situated at 2f
o
+M and 2f
o
+2M with the
amplitude A of the reference mirror oscillation.
Figure 2: Normalized magnitudes of the spectral
components situated at 2f
o
+M (blue) and at 2f
o
+2M (red);
their variation with the amplitude A of the reference
mirror. Continuous curves: Jacobi–Anger expansion
coefficients; circled curves: Fast Fourier Transform; Black
dots: experimental determinations.
Another example is the mean phase difference Ψ
R
between the two interferometric pathways. Varying
the mean phase difference, the amplitude of the
detected signal will also vary, and every spectral
component will be affected. In Figure 3 is presented
the variation of the magnitudes of the spectral
components situated at 2f
o
+M and 2f
o
+2M when the
mean phase difference Ψ
R
is varied between 0 and
2π.
Figure 3: Normalized magnitudes of the spectral
components situated at 2f
o
+M (blue) and at 2f
o
+2M (red);
their variation with the mean phase difference, Ψ
R
.
PHOTOPTICS2015-DoctoralConsortium
22
4.3 New Applications
Due to the fact that such a microscopy system can
provide local optical information about the
investigated sample with sub-wavelength resolution,
it became highly attractive for many applications. In
biology and medicine, the refractive index of a live
cell has gained much attention as an attractive
indicator of cell abnormality. In cancer biology, it is
well known that the refractive indexes of cancer
cells are relatively higher than normal cells, which is
believed as a good criterion for quantitative
diagnosis of cell malignancy. The possibility to map
the electric permittivity of a biologic sample with
nano-resolution precision can provide the means for
early stage cancer diagnosis.
In materials science, the detailed knowledge of
the changes in the refractive index can be used to
pinpoint the locations of local defects.
The a-SNOM system can also be used in the
nano-electronics industry, where in the last years the
optical constants of the materials became important,
as they are related to the thickness of the films:
errors in the refractive index value translate into
errors in the film thickness, determining less
accurate results.
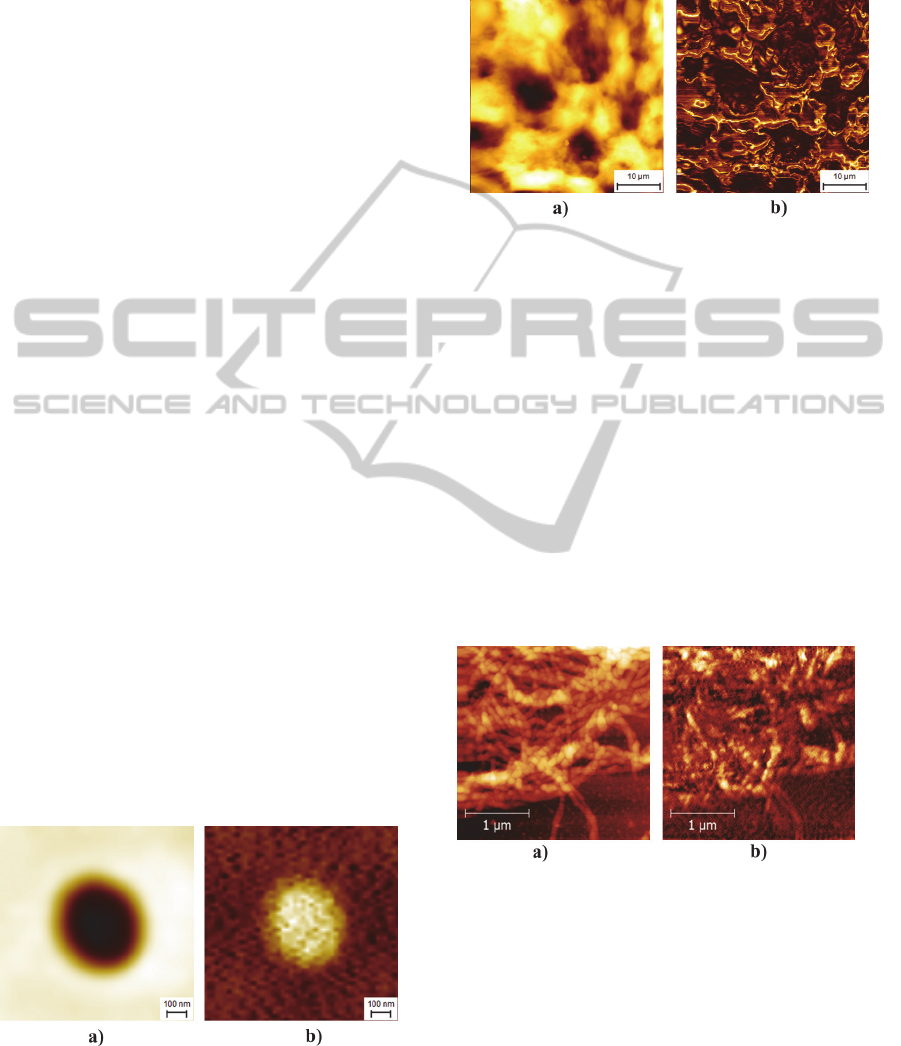
4.3.1 S-SNOM Investigations
Two different samples were used for s-SNOM
investigations. The first one was a calibration
sample containing Si and SiO
2
features and it is
relevant for nano-electronics industry. It was
prepared from a Si substrate on which a 26 nm thick
SiO
2
film was deposed. Holes with 500 nm in
diameter have been made in the SiO
2
film until they
reached the Si substrate. s-SNOM image containing
a single hole, together with the AFM image is
presented in Figure 4. The two images were taken
simultaneous.
Figure 4: a) AFM and b) s-SNOM investigation on a
Si/SiO
2
sample.
The second sample for s-SNOM investigations
was a biological tissue from a rat retina. In Figure 5
there can be observed retinal ganglion cells. Again,
simultaneous acquired AFM and s-SNOM are
presented.
Figure 5: a) AFM and b) s-SNOM investigation on a rat
retina tissue.
The results presented here demonstrate not only the
capability of the s-SNOM system to image samples
relevant for micro- and nano-electronics industry
and for biology, but they also demonstrate the
nanometric-scale optical resolution capability.
4.3.2 FASNOM Investigations
A sample containing collagen fibres deposed on a Si
substrate was used to investigate the optical near-
field with the modulation of the fluorescence
(FASNOM). This sample is also relevant to biology
and medicine areas, as the collagen is an important
compound of many biological tissues. In Figure 6
are presented the AFM and FASNOM images.
Figure 6: a) AFM and b) FASNOM investigation on a
sample containing collagen fibres.
4.3.3 SHG-SNOM Investigations
The collagen sample used for FASNOM imaging is
also relevant for SHG-SNOM investigation. In
Figure 7 are presented the AFM and SHG-SNOM
images on this sample.
A second sample on which SHG-SNOM imaging
was performed is a rabbit cornea tissue. A good
SHG signal was detected, as investigated tissue is
NewAproachesforHigh-ResolutionOpticalMicroscopy
23

rich in collagen, which is known to generate second
harmonic optical frequency light.
Figure 7: a) AFM and b) SHG-SNOM investigation on a
sample containing collagen fibres.
Figure 8: a) AFM and b) SHG-SNOM investigation on a
sample containing a rabbit cornea tissue.
5 EXPECTED OUTCOME
Regarding the s-SNOM imaging, the expected
outcome is related to the possibility to map at
nanoscale precision the local electric permittivity of
complex samples, such as biological samples. Such a
map can provide useful information regarding the
cell abnormality or details of the sub-cellular
features. Such investigations are of high importance,
as the s-SNOM system does not require special
preparations or treatments of the samples. To
achieve this, firstly the influence on the detected
signal of all involved functioning parameters of the
system need to be evaluated. Secondly,
investigations in well-known functioning conditions
need to be performed on simple samples containing
known materials, in order to calibrate the system and
to confirm the method for electric permittivity
determination. The third major step comes with the
complex samples containing biological cells, on
which the mapping of the local electric permittivity
is performed.
For FASNOM and SHG-SNOM systems, the
expected outcome is related to the correlation with
their corresponding far-field optical investigations.
If their only gain (against the fluorescence
microscopy and SHG microscopy, respectively) is
the improved resolution, then this is sufficient for
new important scientific findings, as fluorescence
optical investigations or SHG investigations with
nanometric resolution were impossible before. For
this, large areas on relevant samples can be
investigated both with far-field and near-field
methods, in order to find correspondences at micro-
scale. If correspondences are possible, then
fluorescence and SHG near-field investigations can
be performed at nano-scale, which will provide
detailed optical data.
6 STAGE OF THE RESEARCH
The stage of the presented research is sufficiently
advanced for s-SNOM imaging system. As shown in
the Methodology section, the possibility to measure
the local electric permittivity with nano-resolution
was demonstrated on a calibration sample. New
applications for s-SNOM in the biology area are
expected, as biological tissues has already been
investigated by s-SNOM (see section 4.3.1). The
next step is the mapping of the electric permittivity
of complex samples containing biological cells.
Regarding the FASNOM and SHG-SNOM, the
detection capabilities was demonstrated on relevant
samples; however, far-field investigations need to be
performed on the same samples, in the next steps, in
order to compare them with the near-field images.
ACKNOWLEDGEMENTS
This work is supported by the Sectoral Operational
Programme Human Resources Development (SOP
HRD), financed from the European Social Fund and
the Romanian Government under the contract
number POSDRU/159/1.5/S/137390/.
REFERENCES
Berweger, S., Nguyen, D. M., Muller, E. A., Bechtel, H.
A., Perkins, T. T. & Raschke, M. B. 2013. Nano-
Chemical Infrared Imaging of Membrane Proteins in
Lipid Bilayers. Journal of the American Chemical
Society, 135, 18292-18295.
Brehm, M., Frey, H., Guckenberger, R., Hillenbrand, R.,
Kazantsev, D., Keilmann, F., Ocelic, N. & Taubner, T.
2005. Consolidating apertureless SNOM. Journal of
PHOTOPTICS2015-DoctoralConsortium
24

the Korean Physical Society, 47, S80-S85.
Cvitkovic, A., Ocelic, N. & Hillenbrand, R. 2007.
Analytical model for quantitative prediction of
material contrasts in scattering-type near-field optical
microscopy. Optics Express, 15, 8550-8565.
Fragola, A., Aigouy, L. & Boccara, A. 2003. Fluorescence
apertureless scanning near-field microscopy for high
resolution biological imaging. Novel Optical
Instrumentation For Biomedical Applications, 5143,
139-144.
Gomez, L., Bachelot, R., Bouhelier, A., Wiederrecht, G.,
Chang, S., Gray, S., Hua, F., Jeon, S., Rogers, J.,
Castro, M., Blaize, S., Stefanon, I., Lerondel, G. &
Royer, P. 2006. Apertureless scanning near-field
optical microscopy: a comparison between homodyne
and heterodyne approaches. Journal of the Optical
Society of America B-Optical Physics, 23, 823-833.
Hillenbrand, R. 2007. Scattering-type near-field
microscopy: From nanoscale infrared material
recognition to superlens studies. 2007 Pacific Rim
Conference on Lasers and Electro-Optics, Vols 1-4,
39-40.
Huang, F., Festy, F., Richards, D., Andrews, D., Nunzi, J.
& Ostendorf, A. 2006. Fluorescence enhancement and
energy transfer near a metal tip. Nanophotonics-USA,
6195.
Kim, D. S. & Kim, Z. H. 2012. Role of in-plane
polarizability of the tip in scattering near-field
microscopy of a plasmonic nanoparticle. Optics
Express, 20, 8689-8699.
Knoll, B. & Keilmann, F. 1999. Near-field probing of
vibrational absorption for chemical microscopy.
Nature, 399, 134-137.
Knoll, B. & Keilmann, F. 2000. Enhanced dielectric
contrast in scattering-type scanning near-field optical
microscopy. Optics Communications, 182, 321-328.
Maghelli, N., Labardi, M., Patane, S., Irrera, F. &
Allegrini, M. 2001. Optical near-field harmonic
demodulation in apertureless microscopy. J Microsc,
202, 84-93.
Novotny, l., pohl, d. & regli, p. 1995. Near-field, Far-field
and Imaging Properties of the 2D Aperture SNOM.
Ultramicroscopy, 57, 180-188.
Ocelic, N., Huber, A. & Hillenbrand, R. 2006.
Pseudoheterodyne detection for background-free near-
field spectroscopy. Applied Physics Letters, 89.
Patane, S., Gucciardi, P. G., Labardi, M. & Allegrini, M.
2004. Apertureless near-field optical microscopy.
Rivista Del Nuovo Cimento, 27, 1-46.
Schnell, M., Carney, P. & Hillenbrand, R. 2014. Synthetic
optical holography for rapid nanoimaging. Nature
Communications, 5.
Schnell, M., Garcia-Etxarri, A., Alkorta, J., Aizpurua, J. &
Hillenbrand, R. 2010. Phase-Resolved Mapping of the
Near-Field Vector and Polarization State in Nanoscale
Antenna Gaps. Nano Letters, 10, 3524-3528.
Stiegler, J. M., Abate, Y., Cvitkovic, A., Romanyuk, Y.
E., Huber, A. J., Leone, S. R. & Hillenbrand, R. 2011.
Nanoscale Infrared Absorption Spectroscopy of
Individual Nanoparticles Enabled by Scattering-Type
Near-Field Microscopy. Acs Nano, 5, 6494-6499.
Tranca, D. E., Stoichita, C., Hristu, R., Stanciu, S. G. &
Stanciu, G. A. 2014. A study on the image contrast of
pseudo-heterodyned scattering scanning near-field
optical microscopy. Optics Express, 22, 1687-1696.
Zayats, A. V. & Sandoghdar, V. 2001. Apertureless near-
field optical microscopy via local second-harmonic
generation. Journal of Microscopy-Oxford, 202, 94-
99.
NewAproachesforHigh-ResolutionOpticalMicroscopy
25
