
Quality of Service Trade-offs between Central Data Centers and
Nano Data Centers
Farzaneh Akhbar and Tolga Ovatman
Department of Computer Engineering, Istanbul Technical University, 34469, Istanbul, Turkey
Keywords: Nano Data Center, Distributed Cloud Architectures, Quality of Service in Cloud Services.
Abstract: Nano data centers are one of the latest trends in cloud computing aiming towards distributing the computing
power of massive data centers among the clients in order to overcome setup and maintenance costs. The
distribution process is done over the already present computing elements in client houses such as tv
receivers, wireless modems, etc. In this paper we investigate the feasibility of using nano data centers
instead of conventional data centers containing accumulated computing power. We try to draw the lines that
may affect the decision of nano data center approach considering important parameters in cloud computing
such as memory capacity, diversity of user traffic and computing costs. We also investigate the thresholds
for these parameters to find out the conditions that make more sense to set up nano data centers as the best
replacement of Central Data Centers. We use a CloudSim based simulator, namely CloudAnalyst, for Data
Center performance experiments in java. Our results show that 1 gigabyte memory capacity can be seen as a
threshold for response time improvement of nano data centers. For nano data centers with more memory
capacity there will not be any improvement in response times that leverages the performance cost. We also
combine the results of response time and performance cost to provide a similar threshold.
1 INTRODUCTION
Cloud computing is continuously getting more
mature over time as the challenges retaining the
concept (Qi Zhang et al. 2010) keeps evolving.
Challenges like energy efficient computing in cloud
environments (Kliazovich et al., 2010) and optimal
resource management (Adami et al., 2013) is heavily
studied while new concepts like nano data centers
(NaDa) are proposed as well through time (Laoutaris
et al., 2008) NaDa concept is based on the idea of
distributing the computing power of central data
centers (CDC) among the customers of the
computing service by using relatively less powerful
computing devices at customer site. However, CDC
should manage requests of different servers, NaDa
could consent request of their local users, which are
in edge of their networks, for example their home
gateways or set-top-boxes.
The basis drive in the development of NaDa is
the thriving towards pertaining QoS issues where
continuous low latency (Ousterhout et al., 2011)
(Zeng and Veeravalli, 2012) is an important
parameter to improve. Even more importantly,
inducing the cost (Papagianni et al., 2013) to setup
and maintain a large CDC may increase the cost of
services (Sravan Kumar and Saxena, 2011).
In this paper we show that distributed data
centers as a new version of data centers have
advantages in contrast to current CDC in cloud
based infrastructures. We use CloudAnalyst
simulator (Wickremasinghe et al., 2010) to study the
behavior of data centers in both central and
distributed topologies. After that we present the
tradeoff between data center properties: memory
capacity, computing costs and latency under
different configurations of data centers to study if
they can be used in the decision process of migrating
to a distributed NaDa approach. Finaly, we take into
consideration parameters like the number of user
bases: cumulated areas of incoming user traffic and
the ratio between CDC’s memory capacity and a
single node’s capacity in the distributed nano
network.
The rest of the paper is organized as follows: In
Section 2 we present related work on NaDa. In
Section 3 we present our simulation environment
and in Section 4 we discuss the results obtained from
our experiments. In the last section we conclude our
study and present future work.
113
Akhbar F. and Ovatman T..
Quality of Service Trade-offs between Central Data Centers and Nano Data Centers.
DOI: 10.5220/0005439101130118
In Proceedings of the 5th International Conference on Cloud Computing and Services Science (CLOSER-2015), pages 113-118
ISBN: 978-989-758-104-5
Copyright
c
2015 SCITEPRESS (Science and Technology Publications, Lda.)

2 RELATED WORK
As cloud computing is a modern technology,
recently a lot of studies on different aspects have
been done. Since, in these studies data centers play
an important role, always attaining big attention.
Majority of articles that exist in literature consider
only energy consumption of data centers in their
studies. In this study we try to find some thresholds
to adjust different characteristics of our nano data
centers as a replacement for current central ones.
For example, Ning Liu et al suggested an
optimization model for energy consumption (Ning
Liu et al., 2013). They used greedy algorithm for
allocating tasks to different open server and
maintained the response time and energy
consumption and compared results with the results
of random task scheduling in Internet. Their results
show greedy task scheduling gives less energy
consumption and at the same time less response
time. Another research proposed genetic algorithm
based approach, namely GABA for virtual machine
online reconfiguration in large-scale cloud
computing data centers with aim of energy
efficiency. In the study by Lin Yuan et al. GABA
algorithm is suggested to conserve consumption
energy by decreasing the number of physical
machine that should be turn on when tasks get
arrived in cloud based infrastructures (Haibo Mi et
al., 2010).
Moreno and Xu suggested Nano data center
again for energy conservation in a way that data
centers be located at the edge of the network, like
home gateways or set-top-boxes, and cooperate in a
peer-to-peer manner (Moreno and Xu, 2011).
Valancius et al. applied NaDa in video on demand
(VoD) services in cloud computing environment and
verified energy utilization in traditional current
centric data centers and the new version of data
centers, NaDa (Valancius et al., 2009). In this study
NaDa utilized ISP-controlled home gateways to
provide computing and storage services and adopts a
managed peer-to-peer model to form a distributed
data center infrastructures. By developing energy
consumption pattern with using a large set of
empirical VoD access data in traditional and in
NaDa data centers they demonstrated, even under
the most pessimistic scenarios, NaDa saves at least
20% to 30% of the energy compared to traditional
data centers. In the study, it is claimed such kind of
energy savings is result of cooling costs avoidance,
or reduction of network energy consumptions.
3 SIMULATION ENVIRONMENT
In contrast with traditional data centers that provide
services for a large variety of consumers, NaDa
supply just local consumers. Since cloud computing
developed with the aim to as needed service, so
equipment in cloud based infrastructure, should have
enough facilities to resolve the requests they take
and this may cause data centers and virtual machines
over provision. In all, Disadvantages of traditional
data centers include majorly three factors (Valancius
et al., 2009): 1) over-provisioning, 2) height cost of
heat dissipation and 3) increased distance to end-
users. In this paper we show how NaDa could
overcome these three factors in best. Actually our
aim is to find a threshold could guarantee privilege
of NaDa in comparison of CDC, while NaDa get
maximum proficiency.
We simulate the performance of traditional DCs
and Nano ones. We use Cloud Analyst simulator in
Java with Intel Core i7-3537U-2.0GHz. During the
paper we show response time and performance costs
in both traditional and NaDa, and compare them to
prove that NaDa works more better than the current
CDC and reach the saturation points in which NaDa
give their best QoS. We show results as performance
cost and response time in charts.
3.1 Cloud Analyst Simulator
Cloud Analyst simulator (CA) have written in java.
CA built on Cloudsim, which is a toolkit for
modeling and simulation of cloud computing
environment and evaluation of resource provisioning
algorithms and studying the data center's response
time patterns (Buyya et al., 2009) In CA whole
worlds considered as 6 different regions. These
regions could hosts data centers and user bases. For
studying the traditional data centers as CDC, we
define a data center in central region and distribute
users in all around regions but for NaDa we define
one data center for every user. The topology of
CDCs in our simulator, model the configuration of
CDCs in real world. We put a datacenter in central
region of simulator for investigate CDCs
performance, because current central data centers
receive tasks from lots of consumer and different
machines all over their environment, so by placing a
CDC in central region we try to force that data
center to get task from all user bases in all regions
around to act like real central data centers. For
modeling NaDas, we try to put users in shortest
distance, by placing them in the same region as a
NaDa data center is in. NaDas could communicate
CLOSER2015-5thInternationalConferenceonCloudComputingandServicesScience
114
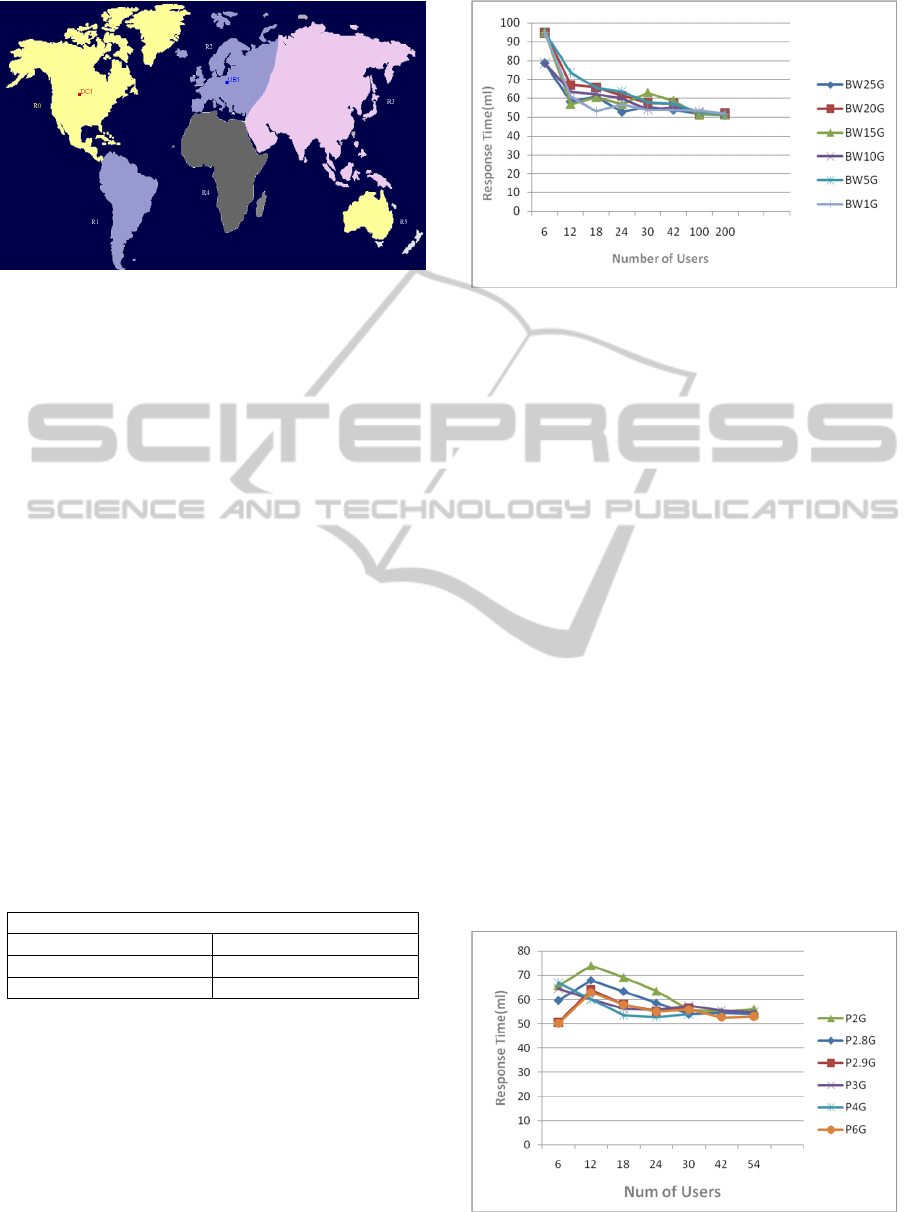
Figure 1: Cloud Analyst Regions.
peer to peer to get their required data instead they
send their requests via internet to the servers and
waste lots of time and energy during their transfer.
With this simulator we could change
different data center's configurations and user bases
properties. Figure 1 shows regions distribution in
Cloud Analyst simulator. UB1 near R2 shows we
have one user in region 2 and DC1 close to R0
shows there is one data center in region 0.
We show the result of our investigation for
different configuration of data centers and user
bases. By these results we can determine which
configuration make NaDa work better. Results are in
forms of the response time in millisecond and
performance cost. In Table1 there are the
characteristics of our CDC. These characteristics are
default in our cloud analyst simulator. In fact these
values are the average amount of specification we
need in our data centers totally (Qi Zhang et al.,
2010). Below amount are the average values which
guarantee satisfying quality of services in a normal
size data center with small task of video demand or
such kind of tasks (Pepelnjak, 2014).
Table 1: Properties of CDC.
Central Data Center
Band Width(Mb/s) 1000000
Memory Capacity(Mb) 204800
Processor Speed(MHz) 10000
4 SIMULATION RESULTS AND
EVALUATION
For next step at first we consider bandwidth
fluctuation. As shown in Figure 2, we consider
bandwidth between 1Mbps and 25Mbps. As we
expected, by increasing the bandwidth amount,
response time decreases. We can see behavior of the
Figure 2: NaDa bandwidth effect on response times.
lines almost are linearly and the same for all sizes of
bandwidth. Also we can see when the number of
user bases exceeds the 100, response time going to
stay constant near the 50 ml second.
Figure 3 demonstrates pattern of response time
when we change the amounts of processor speed.
The amounts interval is between 2 and 6 GHz.
Although response time for different amounts of
processor speed at first act differently but as the
number of user bases increase it goes to be constant
again near 50 ml second. So based on our purpose,
network structure or the number of user bases; we
could select the bandwidth size. Then we start
investigate the memory changes effects on response
time behavior. We can see from Figure 4, after we
increase NaDa's memory storage capacity more than
1GB, response time show the constant behavior,
with 50mls value. It means, with this threshold we
will have no concern about response time
fluctuations and guarantee the average response time
for consumer whose their data centers has this
amount of memory capacity in their local data
center. In other mean with help of these results we
can design local Data center that provides lower
response time.
Figure 3: NaDa processor speed effect on response times.
QualityofServiceTrade-offsbetweenCentralDataCentersandNanoDataCenters
115
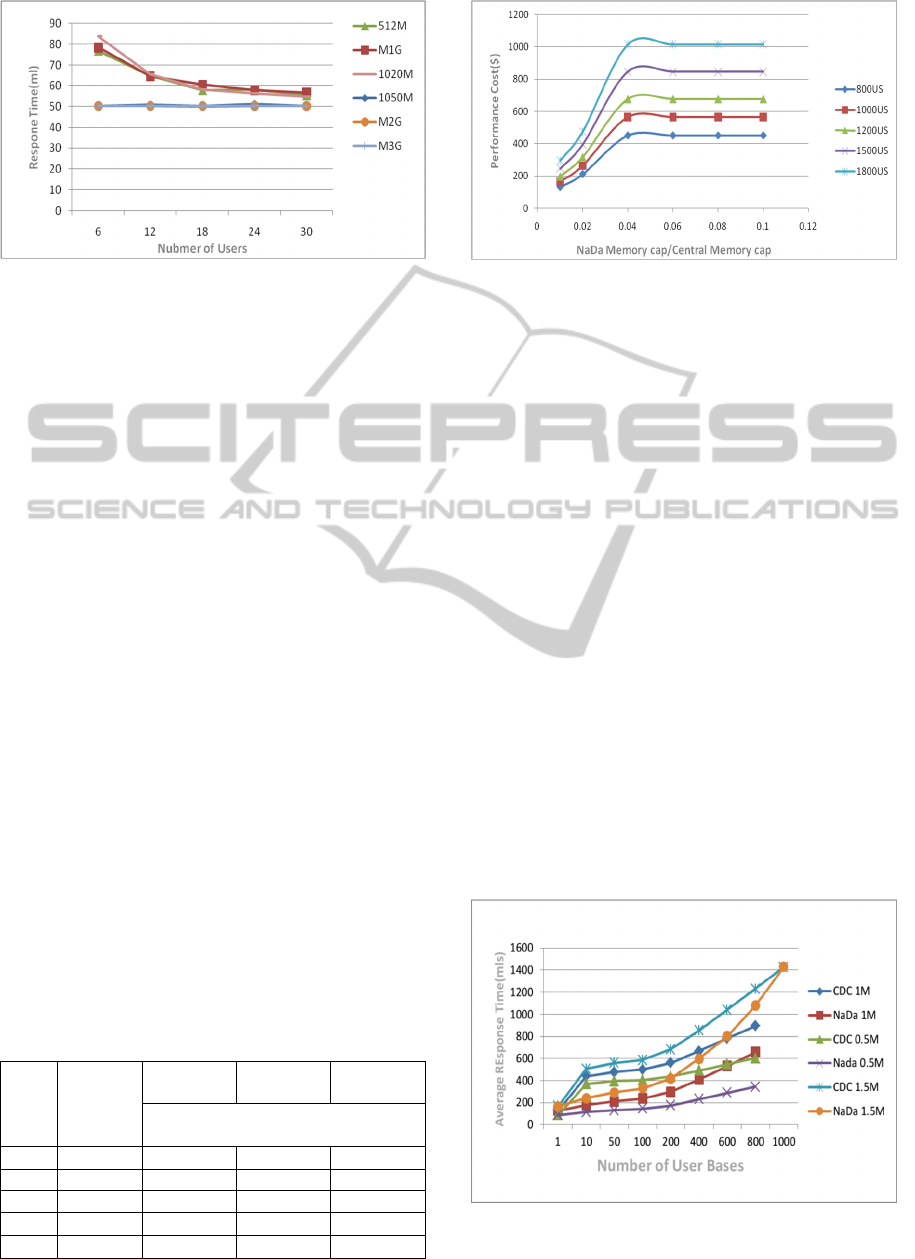
Figure 4: NaDa memory storage effect on response times.
Up to this point we examine bandwidth,
processor speed and memory capacity that are the
most important properties in data centers. For
demonstrating how the behavior of distributed NaDa
and central ones are different, we collect the
maximum response time value in NaDa and CDC
for all three properties that we have examined for
different user bases in Table 2. In this way we can
see the difference between NaDa and CDC response
times. As we can see there is a significant difference
between response time values of NaDa and CDC.
Between the characteristic we have checked,
memory capacity has some kind of exception; cause
after a point response time become a horizontally
line for all different number of user bases. These all
lead us to consider the memory capacity proportion
of traditional data center on our NaDa, till we
explore more precisely point of memory storage
value which NaDa gain their best performance and
could be substitute with traditional data centers in
best way. Maybe proportion comparison could help
more, because the central datacenter which will be
replace with NaDa could have different memory
storage amount in different places, depends on
network structures or some other parameters. But
this time we pay attention to the performance cost
values, because we knew how response time
fluctuations based on Figure 4.
Figure 5 presents performance cost pattern of
NaDa memory capacity on CDC memory capacity.
Table 2: Comparison of CDC and NaDa Response Times.
# of
Users
CDC
Response
Time
NaDa
Bandwidth
NaDa
Mem.Cap.
NaDa Proc.
Speed
Worst Case
Response Time
6 309.89 94.86 84 65.8
18 308.36 65.5 58.38 69.01
30 308.68 57.72 54.96 55.7
100 307.95 51.52 50.42 52.49
500 309.01 50.98 50.12 50.23
Figure 5: The effect of memory capacity ratio on
performance cost with respect to small number of users.
There may be other interpretations for this chart; for
example for different number of user bases after
almost 0.05 point, we see horizontal constant
response time. In deed for one CDC substitution we
could consider the NaDa with memory capacity that
make this proportion, till NaDa get the best quality
and service. Another amassing thing in Figure 5, is
lines are close to each other after number of user
bases increase from 20, and this shows, as the
numbers of consumer of NaDa increase, response
time going to be close to each other and it could give
us more opportunity to choose the user base number
to ascribe local data center as a NaDa. In Figure 5
we consider 640 GB for our central for being sure
that the 0.05 points for memory proportion is a
correct point.
Data size is another important factor that affect
data center behavior drastically. Hence we choose
data size for our next investigation. we start to verify
the effect of transferring data in different size
between user bases and data centers in different
CDC and NaDa, so we consider three different CDC
with different data sizes and also three different
NaDa with the same data size values.
Figure 6: NaDa and CDC Response Times for Different
Data Sizes.
CLOSER2015-5thInternationalConferenceonCloudComputingandServicesScience
116
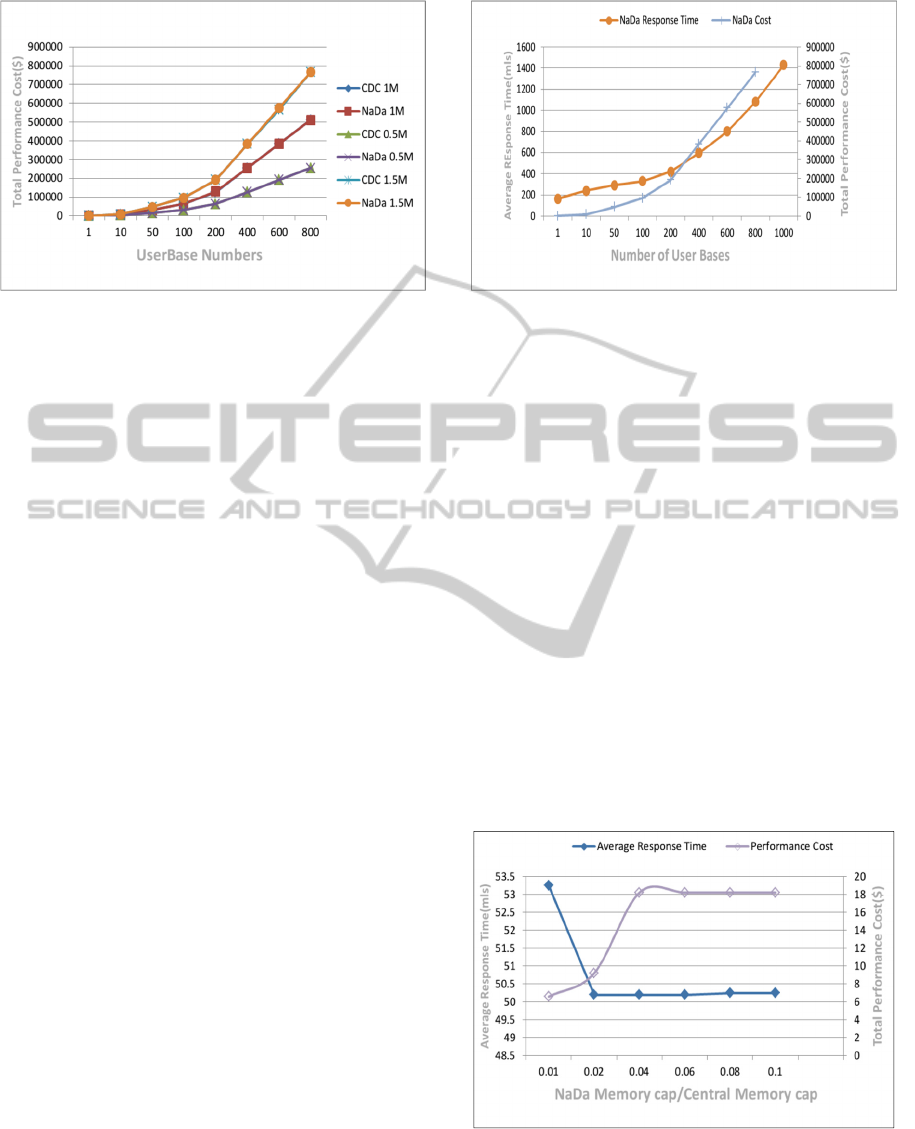
Figure 7: NaDa and CDC Performance Cost for Different
Data Sizes.
Figure 6 shows average response time of CDC
and NaDa. As we can see in chart, for all three, 0.5,
1 and 1.5 MB data sized packets, response time has
less amount for NaDa in comparison with CDC.
NaDa response time has smaller amount than
CDC, but we except performance cost be higher for
NaDa. So we start check it and surprisingly we
realize performance cost of all CDC and NaDa have
the same amount for different data packet sizes.
Figure 7 demonstrates the results. In all for data
packet size properties again we see our NaDa have
better proficiency than the CDC. Less response time
with equal performance cost really satisfying to
substitute NaDa with current traditional central ones.
Finally for having the better perspective of how
our research could help construct the NaDa for
replacing with CDC, we put the results of
performance cost and average response time in one
chart together till we could have better comparison.
Because user bases number and memory capacity
are both of most important properties, at Figure 8
and Figure 9 we have results of them respectively.
As we can see for 1.5MB data packet sizes,
response time line and cost line intersect with each
other at one point which belong to a user base, so
based on our aim, if less response time is important
for us or less performance cost, we could replace a
CDC with nano one for apparent number of user
bases we reach in our charts till we get best
proficiency.
In Figure 9, we repeat showing the result of
performance cost and response time in one diagram
this time vs. the proportion of memory capacity of
nano data center on memory capacity of CDC for 50
user bases. This chart fluctuation is less, because as
you can see response time always has constant
amount near 50 milliseconds.
Figure 8: Average Response Performance Cost vs.
Number of User Bases.
If we need to have less response time in contrast
with performance cost we need to give the amount
of memory to NaDa in a way they have more than
0.02 ratio of the previous CDC's memory capacity,
because response time line is under the performance
cost line after 0.02 ratio. In our studies we examine
distributed data centers as nano data center to find
the properties that make nano data center as a good
replacement for central data centers. We find
response time and performance cost for different
properties amounts like memory capacity,
bandwidth, processor speed and user bases. For
example our research shows for more than 1
Gigabyte memory capacity response time will not
change. This approach could help people who
concern with data centers performance to construct
needed data center in a way they could reach
maximum quality of services in different cloud
architectures.
Figure 9: Average Response Time and Performance Cost
vs. Memory Capacity Ratio.
QualityofServiceTrade-offsbetweenCentralDataCentersandNanoDataCenters
117

5 CONCLUSIONS AND FUTURE
WORK
We reach threshold points for different properties of
NaDas, include: memory capacity, bandwidth and
processor speed. We show how NaDa could have
it’s maximum quality of services in these points. We
also show Our NaDas performance while giving
services to different number of user bases. In all of
our simulations neighbor NaDas could ask services
from each other in peer to peer form. Trying other
ways of communication between neighbor data
centers could be considered as a next level of
performance investigation.
In addition, our studies can be extended by using
real cloud based architectures for experiments. The
ways of how it could help the industry for more
financial profit and improvement could be another
charming spark to use this approach. Web
application providers could adopt their products
based on our new thresholds for NaDa for get better
QoS values and in follow reach more profit. This
work shows that maybe we should investigate cloud
structure more precisely and researchers should look
at our work as a spark for more and deeper
investigation.
Our studies show that still there are gap in cloud
computing structures and shows we could prepare
data centers in a way they be more proportional. Our
threshold can be used almost in all of the application
served over Internet. ISP Provider or who other
adjust the data centers characteristics could consider
our work to reach the better performance and QoS.
The thresholds in this study give hints for adjusting
the properties of the NaDa to improve their services
by having the minimum response time of task
delivery, or less performance cost.
REFERENCES
Adami, D., Martini, B., Gharbaoui, M., Castoldi, P.,
Antichi, G., Giordano, S., 2013. Effective resource
control strategies using OpenFlow in cloud data
center. IM, page 568-574. IEEE.
Buyya, R., Ranjan, R. and Calheiros, R.N., 2009.
Modeling and Simulation of Scalable Cloud
Computing Environments and the CloudSim Toolkit:
Challenges and Opportunities. Proceedings of the 7th
High Performance Computing and Simulation
Conference HPCS2009, IEEE Computer Society.
Haibo Mi, Huaimin Wang, Gang Yin, Yangfan Zhou,
Dianxi Shi, Lin Yuan, 2010. Online Self-
reconfiguration with Performance Guarantee for
Energy-efficient Large-scale Cloud Computing Data
Centers. IEEE SCC, page 514-521.
Kliazovich, D., Bouvry, P., Audzevich, Y., Khan, S.U.,
2010. GreenCloud: A Packet- Level Simulator of
Energy-Aware Cloud Computing Data Center .
GLOBECOM, page 1-5. IEEE.
Laoutaris, N., Rodriguez, P., Massoulie, L., 2008.
ECHOS: Edge Capacity Hosting Overlays of Nano
Data Centers. Computer Communication Review
38(1):51-54.
Moreno, I.S., Jie Xu, 2011. Customer-Aware Resource
Overallocation to Improve Energy Efficiency in Real-
Time Cloud Computing Data Centers. SOCA, page 1-
8. IEEE.
Ning Liu, Ziqian Dong, Rojas-Cessa, R., 2013. Task
Scheduling and Server Provisioning for Energy-
Efficient Cloud-Computing Data Centers. ICDCS
Workshops, page 226-231. IEEE.
Ousterhout, J., Agrawal, P., Erickson, D., Kozyrakis, C.,
Leverich, J., Mazières, D., Mitra, S., Narayanan, A.,
Parulkar, G., Rosenblum, M., Rumble, S.M.,
Stratmann, E., Stutsman R., 2011. The Case For
RAMClouds. Commun. ACM 54(7):121-130.
Papagianni, C., Leivadeas, A., Papavassiliou, S., Maglaris,
V., Cervello-Pastor, C., Monje, A., 2013. On the
Optimal Allocation of Virtual Resources in Cloud
Computing Networks. IEEE Trans. Computers
62(6):1060-1071.
Pepelnjak, I., 2014. Data Center Design Case Studies. In
Space Publication. First edidtion.
Qi Zhang, Lu Cheng, Boutaba, R., 2010. Cloud
computing: state-of-the-art and research challenges.
Journal of Internet Services and Applications In
Journal of Internet Services and Applications. Vol. 1,
No. 1. pp. 7-18.
Sravan Kumar, R., Saxena, A. R., 2011. Data Integrity
Proofs in Cloud Storage. COMSNETS, page 1-4.
IEEE.
Valancius, V., Laoutaris, N., Massoulié, L., Diot, C.,
Rodriguez, P., 2009. Greening the Internet with Nano
Data Centers . CoNEXT. page 37-48. ACM.
Wickremasinghe, B., Calheiros, R.N., Buyya, R., 2010.
CloudAnalyst: A CloudSim-based Visual Modeller for
Analysing Cloud Computing Environments and
Applications. AINA, page 446-452. IEEE Computer.
Zeng, Z., Veeravalli, B., 2012. Do More Replicas of
Object Data Improve the Performance of Cloud Data
Centers. UCC, page 39-46. IEEE.
CLOSER2015-5thInternationalConferenceonCloudComputingandServicesScience
118
