
May SmartPhones Help to Maintain Audience Attention During
Presentations?
Matteo Ciman
1
, Yari Formaggio
1
, Ombretta Gaggi
1
and Marco Regazzo
2
1
Department of Mathematics, University of Padua, via Trieste, 63, Padova, Italy
2
Primo Round S.r.L.,via Durando 39, Milano, Italy
Keywords:
Interactive Presentations, Slideshows, Mobile Applications.
Abstract:
In this paper we describe a new tool for interactive presentations: the speaker shows a common slideshow on
the screen, and the users can see the same slide in their smartphone or tablet, independently from its model and
brand. The system can be used for both on-line and on-site presentations and encourages the user to perform
social activities, e. g., comment or like a slide. The author can also submit a questionnaire or a poll to the
audience and see in real-time the answers. Our tool has been used during 37 different events, followed by
3753 users. We recorded the actions of the users and, depending on the different kind of events, the average
of actions ranges from 1 to 8 per user per presentation. This data shows that our tool helps to increase users
engagement and to maintain user attention.
1 INTRODUCTION
One of the key problems for a speaker is to maintain
user attention. This problem is particularly relevant
for teachers, who has to transmit knowledge to their
students, or for speakers who presents a new product,
e. g., a medicine, to potential buyers. For this reason,
computer-based multimedia presentations has rapidly
replaced the use of chalkboards, overheads and hand-
outs, both in academic lectures and in presentations
in conference rooms. (Guadagno et al., 2011) even
demonstrate that the use of animated PowerPoint
r
presentations may affect the persuasive power of the
lesson/event on users’ decisions. Users perceive tech-
nological sophistication of a presentation as a heuris-
tic cue for high quality of the content, therefore it
inflates positive evaluations from users. Moreover,
(Snell, 1999) presented several reasons why interac-
tive lecturing and presentations are better than a static
presentation, e. g., active involvement can increase
student learning, attention and motivation and can
also provide feedback not only to the student but even
to the teacher, with a double benefit.
Although the persuasive power of computer-based
multimedia presentations, they do not completely
solve the problem, since it often happens that many
users do not follow a presentation from its beginning
to the end, due to the limited attention threshold. The
diffusion of smartphones and tablets increases this
problem, since a bored audience often begins to read
email through smartphones or tablets or to perform
social activities like using Facebook or Twitter. But
can smartphones be used in a useful way?
In this paper we propose a system to involve users
during talks with the aims at turning smartphones
from a distracting tool, i. e., an enemy for the speaker,
into a useful tool for interaction for the user itself or
between the speaker and the user, thus encouraging
the user to keep attention on the presentation.
Our system allows to show PowerPoint
r
presen-
tations both through a projector and users devices.
The speaker follows the natural trend of the presen-
tation, can submit to the audience questionnaires or
polls and receive in real-time the answers, showing
the results on a dedicated slide. Moreover, it is pos-
sible to add comments on a slide that can be seen im-
mediately or in a second moment by the presenter.
Due to the widespread diffusion of PowerPoint
r
,
our system is based on an editor which translates a
presentation from its format to web pages, and allows
the insertion of questionnaires and polls. This clearly
aims at removing the learning curve, that is typically
associated with the adoption of a new technology, and
at targeting the highest number of presenters, even
those not skilled with HTML5, CSS and Javascript
languages. We also support other formats, e. g., ODF,
as discussed in Section 5.
55
Ciman M., Formaggio Y., Gaggi O. and Regazzo M..
May SmartPhones Help to Maintain Audience Attention During Presentations?.
DOI: 10.5220/0005441100550063
In Proceedings of the 11th International Conference on Web Information Systems and Technologies (WEBIST-2015), pages 55-63
ISBN: 978-989-758-106-9
Copyright
c
2015 SCITEPRESS (Science and Technology Publications, Lda.)

2 RELATED WORK
PowerPoint
r
presentation conversion to web pages
and audience engagement has been investigated in lit-
erature from several points of view.
Joubert et al. (Joubert et al., 2011) converts pre-
sentations into compressed scalable vector graphics.
The conversion is performed to adapt presentations to
phones which are not able to read PowerPoint
r
for-
mat, but they do not provide any kind of interaction
more than stepping to the next slide.
Commercial tools like Adobe Captivate
1
, iSpring
2
and SlideGo
3
, that let the user convert from PPTX
format to HTML5 pages, besides being expensive,
produce not valid pages or introduce SWF elements
inside the pages. Another solution adopted by these
products is the simple conversion of a slide into an im-
age, which is placed inside an HTML page. All these
solutions do not allow the portability of the system
over all the mobile platforms. Our approach can be
used both with a desktop, a tablet or a mobile device.
Moreover it adapts the slides to user preferences, like
the dimension of the font.
Interaction between the speaker and the audience
is studied in (Triglianos and Pautasso, 2013). ASQ
allows to deliver interactive HTML5 presentations
which can contain questionnaires and polls, but the
teacher must create a web presentation which is a skill
not commonly available among teachers. The same
problem is also present in (Edge et al., 2013), where
the system, although it uses PowerPoint
r
application
and slide format as a basis, requires to the authors the
knowledge of a simple markup language.
In early 1993, Nickerson (Nickerson, 1993) reg-
istered a patent for a real-time wireless audience re-
sponse system to collect data from a plurality of par-
ticipants. This idea could be identified as the begin-
ning of the active participation in public talks, where
users are engaged and requested to provide their opin-
ion or data to particular questions.
To increase audience engagement, Maynes-
Aminzade et al. (Maynes-Aminzade et al., 2002)
developed a system that lets the audience control
on-screen activities using three different interactions:
leaning left or right on the seats, batting a beach ball
while its shadow is used as a pointing device and
pointing lasers at the screen. Although these inter-
actions cannot be used with professional audience, it
was clear that this sort of interaction could easily en-
gage people and increase their attention.
1
http://www.adobe.com/it/products/captivate.html
2
http://www.ispringsolutions.com/ispring-converter
3
http://www.slidego.com/
Barkhuus et al. (Barkhuus and Jørgensen, 2008)
investigated the usage of a voting system at rap com-
petitions. They showed how augmented interaction
can increase the sense of participation among the au-
dience. One investigation on a more serious context
was carried on by Jones et al. (Jones et al., 2006).
In this case, they investigated the usage of text mes-
saging as answer provider to polls submitted by the
speaker. The system receives the SMS with the an-
swer to the poll, records the data and let the speaker
show the overall answers provided. From their tests,
they showed how about 15% of the audience directly
took part at the polls, that could be higher if the stu-
dents had not to pay the costs of the SMS.
Differently from these approaches, our system
does not require any programming skills or to change
the tool to create presentations, but allows to use pre-
sentations already available for lessons or talks and to
integrate more interaction through a simple web page.
Moreover, it is portable over all the operating systems
and mobile devices that integrate a browser that sup-
ports HTML5. Our system does not translate each
slide into an image or a canvas, thus losing accessibil-
ity and portability of its content, but it translates the
slide in pure and valid HTML code, i. e., paragraphs,
tags <p>, for text and tags <img> only for pictures
and icons. In this way we preserve not only portabil-
ity and accessibility, but each slide adapts itself also
to user preferences as font size.
3 SYSTEM ARCHITECTURE
Our system must support both on-site presentations,
i. e., audience and speaker meet together in a room,
and on-line events, i. e., the presentation is distributed
through the web, but there is not a speaker in the
users’ room. In the first case, the speaker presents the
slides to the audience, following the natural trend of
the presentation. The main objective is to increase the
attention and the engagement (interaction) of the au-
dience with the speaker, and viceversa. Therefore, the
system supports the possibility for the user, i.e. a per-
son of the audience, to add a “like” or a comment on
a particular slide or, in some cases
4
, navigate through
the slides, without waiting for speaker presentation.
Moreover, the system supports the possibility, for the
speaker, to add a slide with a questionnaire or a poll.
The idea is to use these slides to interact with the au-
dience, and receive in real-time the answers. The user
initially sees only the question and the possible an-
swers, then the system collects in real-time all the
4
If the speaker enables this action during the configura-
tion phase.
WEBIST2015-11thInternationalConferenceonWebInformationSystemsandTechnologies
56
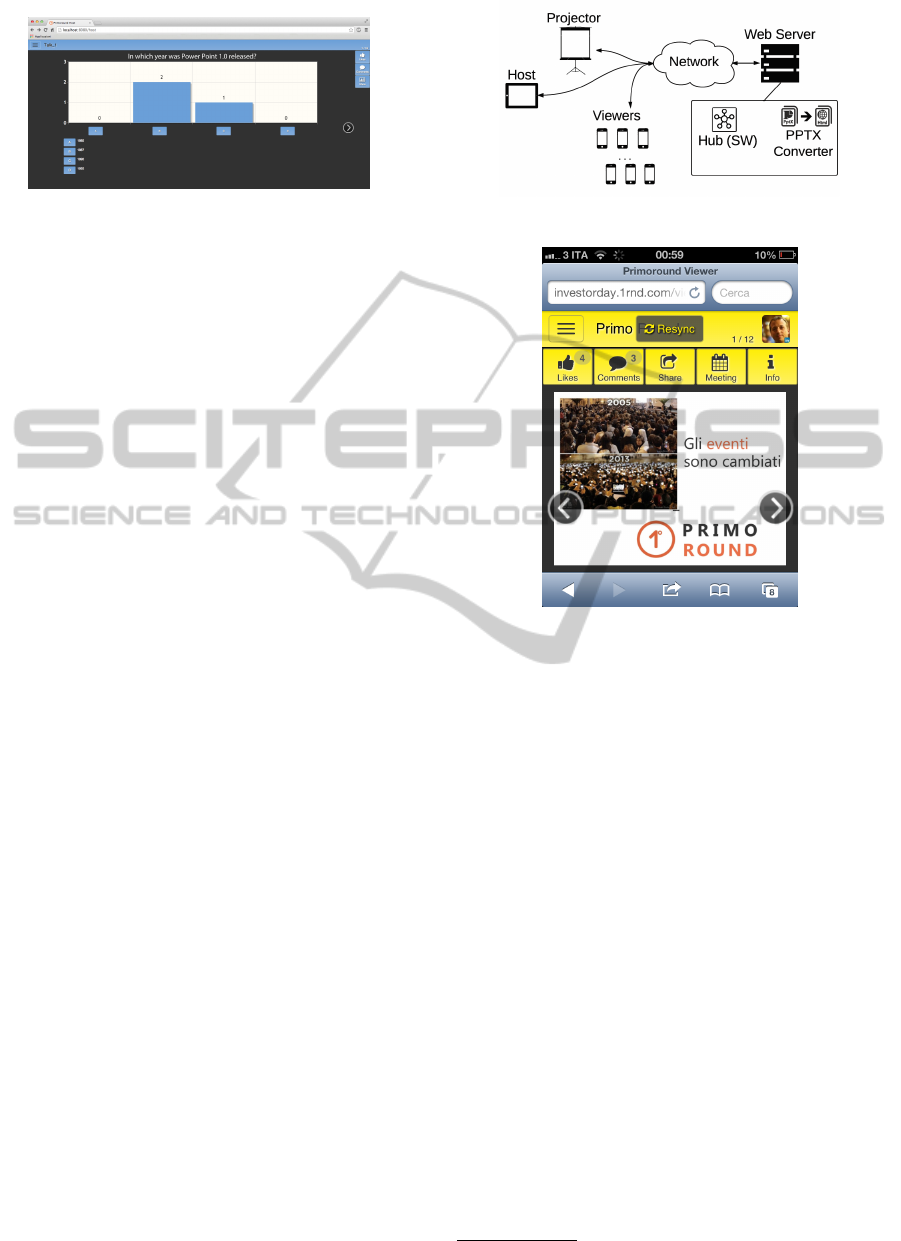
Figure 1: Slide report with the result of a questionnaire.
answers, elaborates them and shows the results in a
dedicated slide (see Figure 1).
During on-site presentations, “like” and com-
ments are notified in real-time to the speaker, hence
giving him/her a feedback of the audience response
during the presentation. Moreover, if comments from
the audience are enabled, this immediate notification
gives him/her the possibility to answer immediately
to possible questions.
Our system supports even on-line presentations,
where the presentation is recorded and spread through
the Web. In this case, presentation timing is managed
by the user, who can also submit “like”, comments
or questions to which the presenter can answer in a
second moment through email.
The system can be divided into a front-end and
a back-end component. The front-end component is
responsible to manage all the possible interactions be-
tween the speaker, the users and the system. First of
all, it provides the configuration pages used to upload
and convert PowerPoint
r
presentations and to add in-
teractivity, i.e. questionnaire slides. Secondly, the
front-end component provides the proper interfaces
during the presentation. We identified three different
users’ roles that correspond to three different inter-
faces: the Viewer, the Projector and the Host. Fig-
ure 2 depicts all these components and their interac-
tions. We call Viewer the interface dedicated to the
audience and is responsible to manage users interac-
tions. Through this interface, an attendant is able to
interact during the presentation submitting comments,
answering to polls or sharing slides.
An example of the interface is provided in Figure
3. Comments and “like” are notified to the speaker
with two icons, a thumb up and a cartoon bubble with
the number of received “like” and comments.
The Host is the interface dedicated to the speaker.
During an on-site event, the speaker has the control of
the slideshow. He/she can move to the next/previous
slide and controls slides’ animations and interactive
slides. Moreover he/she can read, in real-time, au-
dience’s comments. The system allows to enable or
not the possibility to show comments to the speaker
during the initial configuration phase. If enabled, the
Figure 2: System architecture.
Figure 3: Example of interface provided for the Viewer.
speaker, or the user, can click on the cartoon bubble
icon to display the comments. A visualization in the
Host interface is propagated to all the Viewer. A visu-
alization in a Viewer interface is interpreted as a tem-
porary de-synchronization from the presentation. The
speaker can decide to verbally answer to the comment
in the case of on-site presentation, otherwise he/she
can answer to the user through e-mail.
The Host is a reference point for viewers synchro-
nization and it rules the progress of the slideshow. As
soon as the speaker moves to a new slide, viewers who
are following the speaker, i. e., who are not moving
autonomously among the slides
5
, are also automat-
ically synchronized with the current slide. Even if
very different in terms of role inside the system, from
a graphic point of view, the Host interface is very sim-
ilar to the Viewer: it shows the number of comments
and “like”, it allows to see a particular comment and
to answer (this action is not possible in the Viewer).
In case of questionnaire, the Host shows the collected
data as depicted in Figure 1 and the Viewer shows the
question and the list of possible answers.
Finally, the Projector is the interface dedicated
to the room’s projector, if available. This is the
most simple interface because it only displays the
5
The speaker can decide to give or not this possibility.
MaySmartPhonesHelptoMaintainAudienceAttentionDuringPresentations?
57

slideshow and it does not allow any input or inter-
action. It also displays the number of comments and
likes of the slide currently shown.
The back-end component, the rectangle in Figure
2, contains a PPTX Converter and the Hub. The for-
mer converts a PowerPoint
r
presentation into a set of
HTML5 slides, the latter manages all the signals com-
ing from the host and from all the viewers, to maintain
the synchronization between the speaker and the au-
dience and to collect users’ feedback.
We must note here that a user from the audience
may temporarily deviate from the state of the presen-
tation imposed by the speaker, navigating through the
slides. The Hub does not re-synchronized this kind
of users, since a deviation from the current presen-
tation state is interpreted as the wish to navigate au-
tonomously. The user can decide, in every moment, to
re-sync with the presentation displayed by the Host,
clicking on the dedicated button. This is possible
thanks to the Hub which knows, in every moment, the
current state of the slideshow. Moreover, the Hub is
also used to send the correct slide to new viewers that
connect when the slideshow is already begun. In this
way, the Hub always guarantees synchronization be-
tween speaker and the audience.
4 SYSTEM DEVELOPMENT
4.1 Managing Synchronization
The main task of the back-end component of the sys-
tem, and in particular of the Hub, is to maintain the
synchronization between all the devices connected
to the server, e.g. the presenter and audience de-
vices, and to manage all the exchanged messages.
The server is implemented using NodeJS, in particu-
lar with the Socket IO library (Socket IO, 2015), that
lets manage several parallel websocket connections
reducing transferred data and increasing synchroniza-
tion speed. As previously mentioned, the Hub com-
ponent has to be aware about the current slide of the
presentation, in order to be able to keep synchroniza-
tion between all the connected devices, and to sync a
new user that connects to the system.
In particular, the most important messages ex-
changed with the Hub are:
• change-slide: from Host to the Hub, notifies that
the presenter has changed slide. This message is
then forwarded to all the followers currently syn-
chronized with the presentation to move to the
next slide;
• update-like and update-comment: from the Hub
to the Host, is used to update the number of “like”
or the comments of a slide of the presentation;
• user-resync: from the Viewer to the Hub, used to
sync the presentation of a viewer with the current
slide of the presenter. The Hub will answer with
the current slide of the presentation;
• user-navigation: from the Viewer to the Hub, in-
forms the Hub that the current device is no more
following the presenter, but is freely watching the
slideshow.
Other signals between the Hub, the Viewer and the
Host are exchanged to manage all the possible actions
that can be performed with our system.
As mentioned before, the system supports interac-
tivity between the presenter and the audience, in par-
ticular using interactive slides, that let the presenter
ask questions to the audience, i. e., multiple choice
questions or poll. When asked, people from the au-
dience have a particular slide that is dedicated to let
them submit their answer to the question. A specific
message with the provided answer is then sent to the
Hub, that collects all the answers from the audience
and will send the final report to the Host. Then the
Host itself shows the result in a proper slide. An ex-
ample of the results of a poll is provided in Figure 1.
4.2 Module Converter
The module converter translates a PowerPoint
r
pre-
sentation into a set of HTML5 slides. We support only
the .pptx format and do not support the old format
.ppt, since the latter is not implemented using XML
language. A description of the support of other for-
mats is discussed in Section 5. We aims at a, as accu-
rately as possible, translation of the PowerPoint
r
pre-
sentation, considering images, text, animations and
transition effects.
The core of this module is an XML parser that
parses, in succession, the XML files that represent the
slides and identifies the elements contained in every
single slide. Analyzing these elements, the converter
creates an HTML5 page adding the corresponding
HTML5 element, if there is one, or adding a partic-
ular combination of HTML5 elements to reproduce
the PowerPoint
r
object.
Consider, as an example, a slide containing an im-
age: the converter creates a div, and sets the right im-
age as source for its background-image property. The
basic information that are needed to correctly trans-
late a PowerPoint
r
image are: the source image, its
size, its position and its rotation. The information
about the source image is contained in the r:embed
attribute of the <a:blip> XML element: rId8 rep-
resents a unique ID that can be used to identify the
WEBIST2015-11thInternationalConferenceonWebInformationSystemsandTechnologies
58
correct image (Fig. 4(a)). This ID must be searched
into a PowerPoint
r
’s relationships file, (Fig. 4(b)),
that is strictly connected to the slide XML file that
contains the picture element. The Target attribute
specifies the image file for the picture identified by
the rId8 ID.
Picture’s position, size and rotation are contained
into the <a:xfrm> XML element. The root at-
tribute contains the image rotation. It is a simple type
that represents an angle in 60.000ths of a degree. Pos-
itive angles are clockwise (i.e., towards the positive y
axis); negative angles are counter-clockwise (i.e., to-
wards the negative y axis). In this example the image
is rotated 90 degrees clockwise.
The x and y attributes of the <a:off> element,
describe the picture position. Values are measured in
EMUs (English Metric Units)
6
and they represent a
distance from the top-left corner of the slide. In this
example, the image has no offset.
The cx and cy attributes of the <a:ext> element,
express the picture size, measured in EMUs. In our
example, the image has a size of 720x540 points.
Moreover, if the slide contains a text area, the
converter creates a div element, puts the text inside
it, and sets all the necessary properties to maintain
< p:pi c >
< p:b li p Fi ll >
< a: blip r: em bed = " r Id 8 " > ... </ a: blip >
...
</ p:b li pFi ll >
< p: spPr bw Mo de =" au to " >
< a: xfrm rot = " 5 400 00 0 " >
< a: of f x = "0" y = "0" / >
< a: ex t cx = " 914 40 00 " cy = " 6 85800 0 " / >
</ a: xf rm >
< a:p rs t Ge om prst = " rect " > ... </ a:p rs tGe om >
...
</ p: sp Pr >
</ p: pi c >
(a)
< R el ati ons hi p s xm ln s = " .. . " >
...
< R el ati on s hi p Id = " rId8 " T ar get = " ../ me di a /
im age5 . jp g "/>
...
</ Rel ati on s hi p s >
(b)
Figure 4: XML fragment of a .pptx presentation containing
an image (a) and its relationship file (b).
the correct font, font size, font color, alignment, line
spacing and format, used in PowerPoint
r
.
6
A EMU is defined as 1/360.000 of a centimeter and
thus there are 914.400 EMUs per inch, and 12.700 EMUs
per point.
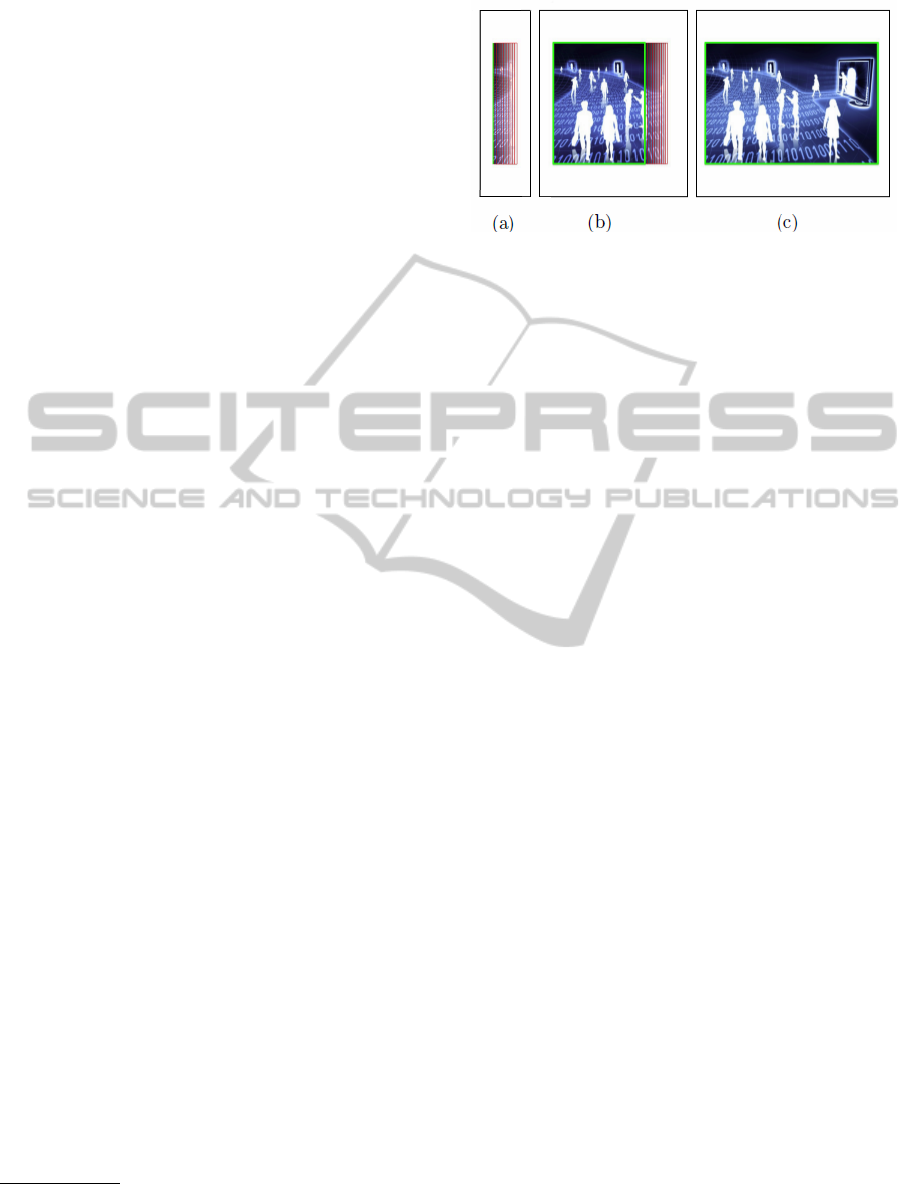
Figure 5: Wipe-in animation implemented in HTML5 and
CSS3. (a), (b), (c) show, progressively, how the main div
element, i. e. the green one, is expanded and how the red
rectangles are moved according to it.
The converter is written using the NodeJS plat-
form and Javascript language. First of all, it reads
the picture’s information, described above, from the
XML file. The second step is to convert this informa-
tion into valid CSS values. Images’ position and size
are converted in pixel, and images’ rotation values in
degrees; the size of the div element and of the font
are scaled, according to the window size, to allow to
adapt the slides to every device.
Moreover, since the slides are scaled to meet the
screen size of different devices, also the images con-
tained in the presentation must be scaled. This oper-
ation is performed on server side to obtain a second,
important, goal: to save network bandwidth. In fact,
it makes no sense to send a big image file, thus wast-
ing time and bandwidth, to show it smaller, according
to final user interface.
The converter is able to translate slides which con-
tains objects like images, text-areas and shapes (only
squares and rectangles). The system can reproduce
user defined layouts with good results and can recre-
ate a small set of PowerPoint
r
animations as fade-
in, fade-out, wipe-in (from left, right, bottom, top),
blink, entrance (from left, right, bottom, top) and exit
(from left, right, bottom, top). The set of supported
features, detailed in Table 1, is not complete but cov-
ers the most commonly used features, as discussed in
following section.
4.3 Animations
Animations have great importance and they are trans-
lated in the slides using features offered by CSS3
standard and Javascript. The converter reads the an-
imation information from the XML file: i. e., type,
duration, involved elements and triggers. For each an-
imation a specific CSS class is created and applied to
the correct HTML5 element, at the right moment. An-
imations are played in real-time by a Javascript func-
MaySmartPhonesHelptoMaintainAudienceAttentionDuringPresentations?
59

Table 1: Summary of supported elements and features of a
PowerPoint
r
presentation.
Elements Features
Text position, font, size, color, alignment
Images position, source, size, rotation, cutting
Text Boxes position, size, color background, text
(font, size, color and alignment)
Bullet lists position, color, type, text (font, size,
color and alignment)
Shapes
Square,
rectangle
position, size, color background,text
(font, size, color and alignment)
Animations
Fade-in,
Fade-out
duration, trigger (click or timer)
Slide-in,
Slide-out,
Wipe-in
duration, trigger (click or timer), di-
rection (from left, from right, from on
high, from on low)
Slide Layout
Layout
Grid
bullet list, title, etc. are displayed ac-
cording to the chosen layout
Background Slide background color
Placeholder header, footnote, date, slide count, title,
and text inherit their features from the
layout of the slide
tion executed by user’s internet browser.
It is important to note that the creation of anima-
tion inside HTML5 slide is not a simple translation
between XML tags. This comes from the fact that it
does not exist a correspondent CSS property for each
animations provided by PowerPoint
r
, but only for
the easiest one like fade-in and fade-out. Other type
of animations are supported manually creating the an-
imation effect.
Consider as an example the wipe-in (left) anima-
tion. It is an animation effect which reveals, progres-
sively, an object placed on the slide, increasing its
width, starting from a value equal to 0 pixels (the pic-
ture is not visible) and reaching the size of the object
(the image is completely visible). To further empha-
size the animation, a gradient effect is also applied
along the vertical right side that reveals the image.
This animation is implemented with the combination
of two simpler effects. The first one changes the di-
mension of the div element which contains the ob-
ject, colored in green in Figure 5. This animation
is realized using a CSS3 transformation. The second
animation adds the gradient effect and its implemen-
tation is more difficult. We create a number of div
elements which contain only a slice of the original
object. Then, different values of transparency are ap-
plied to these elements to simulate the gradient effect.
Moreover, all these elements are moved according to
the main div containing the object. The elements
which realize the gradient are colored in red in Fig-
ure 5. To better support mobile devices, this second
animation is facultative and it is not applied in case of
old device or device with low CPU resources.
5 TEST
5.1 Coverage Test
We tested our system in different ways. First, we col-
lected 16 sets of slides, created by 13 different au-
thors, for a total of 449 slides, and we tested how
many slides have been correctly translated and if any
error occurs during conversion. Presentations has
been selected from lectures’ slideshows and presen-
tation from commercial events; 15 out of 16 presen-
tations contain images, 9 out of 16 presentations con-
tains animations. The authors were not involved in
the development of our system and did not have any
notion about how it is built and its coverage of the
features under evaluation.
As already discussed in the previous section, our
converter does not fully support all PowerPoint
r
fea-
tures, but a reasonable set. We want to explore the ef-
fective coverage of features, since some PowerPoint
r
features are more widespread and other are seldom, if
ever, used by the authors.
We must note here that some features, if not sup-
ported, can be easily replaced by other without loss
of expressiveness of the presentation, e.g., a complex
animation can be replaced by a fade in. We asked to
one of the authors of the presentations and a devel-
oper of the system to grade the conversion of slides
from PowerPoint
r
using this rating scale:
• 0, if the converted slide lacked of important ele-
ments (or they are empty) and the slide failed to
convey its content;
• 1, if the converted slide contained some errors
which can be considered as “minor” since they al-
lowed to convey the slide’s content but with some
difficulty by the users, as depicted in Figure 6, and
• 2, if the converted slide was equal to the original
or conveyed with the same efficacy its content.
We chose an author and a developer for the grad-
ing to combine a black-box approach, i. e., the au-
thor did not know anything about the development of
the system, and judgment from a person that knew
very well the system. When they did not agree on
the grade, we reported the opinion of the author since
she was not biased by grading something she has con-
tributed to develop. Therefore, reported results can be
considered a lower bound.
WEBIST2015-11thInternationalConferenceonWebInformationSystemsandTechnologies
60
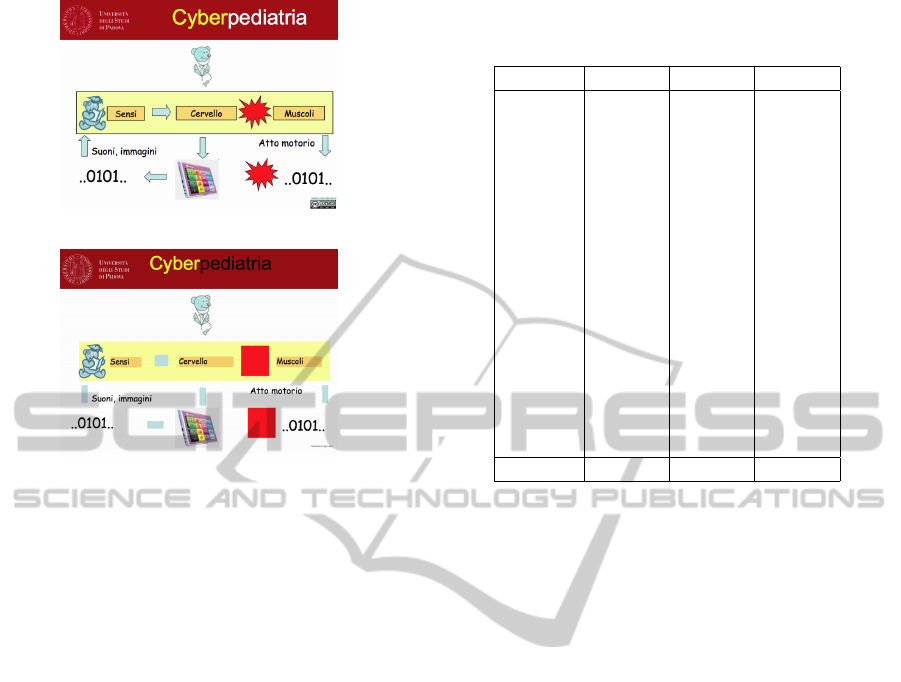
(a) Original Slide
(b) Converted Slide
Figure 6: An example of slide whose conversion contains
some errors: the font color of the title and the some shapes
(arrows and explosions) are not supported.
For each set of slides, we calculated the number
of total points available, i. e., the number of slides
multiplied by two, and the number of total points col-
lected. Our test showed that, on average, the pre-
sentations obtained 86% of available points, 78% of
the slides were fully graded, 19% of converted slides
contained some errors in the translation which can
worse the user experience and the efficacy of the pre-
sentation to convey information, and only 4% of the
converted slides were evaluated to 0. Although 19%
could seem a large percentage, we must note that a
slide was graded to 1 if it was not equal to the original
one, but it was still able to convey the whole content.
So only the 4% of slides were not able to provide all
the information to the audience. The complete results
of this test are reported in Table 2, where we can see
that two presentations were fully graded.
These results showed that, even if the coverage of
PowerPoint
r
features is not complete, but we plan
it would be in the future, it allowed to translate ef-
ficiently many presentations. As an example, text
was always completely converted, but some prob-
lems might arise when bullet lists were included in
the default layout and not explicitly defined. In this
case the tool created a list of items, without the bul-
let, therefore the content was correctly conveyed. At
the moment, the list of unsupported features contains,
among others, geometric figures (we implement only
squares and rectangles), gradients and tables. Only
Table 2: Percentuage of slides evaluated with 0 (Class 0), 1
(Class 1) or 2 (Class 2) points for each set of slides analysed
during the test phase.
Set # Class 0 Class 1 Class 2
Set 1 0% 0% 100%
Set 2 0% 28,57% 71,43%
Set 3 3,54% 23,01% 73,45%
Set 4 10,53% 36,84% 52,63%
Set 5 9,68% 16,13% 74,19%
Set 6 0% 25% 75%
Set 7 0% 13,64% 86,36%
Set 8 26,67% 13,33% 60%
Set 9 7,14% 16,67% 76,19%
Set 10 0% 26,32% 73,68%
Set 11 0% 21,5% 87,5%
Set 12 0% 20% 80%
Set 13 0% 25% 75%
Set 14 0% 22,22% 77,78%
Set 15 0% 54,55% 45,45%
Set 16 0% 0% 100%
Average 3,56% 18,71% 77,72%
some types of animation are supported, in case of un-
supported types, the converter introduces a fade in/out
according if the animation puts or removes the object
on/from the screen.
We must note here that, even if the set of presen-
tations was relatively low, 16, they covered different
authors, coming from different environment, ranging
from public universities to companies, and even the
presentations goals were very different (lessons, ad-
vertising, promulgation, etc).
5.2 Tests with Real Users
As a second test of the system, we tried to “mea-
sure”, in some way, how much the system helps to
increase users engagement and interaction. Consider-
ing that the user probably has paid attention to the talk
if he/she declare to like one or more slides and, in the
same way, the user has to pay attention to the presen-
ter to be able to answer to a questionnaire, the number
of interactions can be considered a rough “measure”
of the potential of the system to help to maintain users
attention during a presentation.
We analyzed the behavior of students of a course
of “Web Technologies” at the undergraduate program
in “Computer Science” at the University of Padua in
Italy during two lessons. Both the lessons proposed
the same topic, exercises on XML technologies (i. e.,
XMLSchema and DTD) and were organized in the
same way. The teacher proposed some exercises to
the students and their solutions. A set of eight closed
questions with a predefined set of possible answers
MaySmartPhonesHelptoMaintainAudienceAttentionDuringPresentations?
61

helped the discussion about the goodness of the pro-
posed solutions.
Since the students were the same for both the
lessons, exercises and questions were different to
avoid annoying them. In the first lesson, we used the
system described in this paper to allow the students to
answer the questions and to record data about interac-
tion. In the second lesson, the students were required
to raise their hand to answer to the question when they
agree with one of the possible answers and the teacher
counted the number of raised hands to record data.
During the first lesson, 96 users registered to the
system, 55 of them as “anonymous”. The system
recorded 215 answers to the eight questions, on aver-
age, nearly 27 answers to each question. This number
could seem low considering the number of users fol-
lowing the lesson, but we must note here that the ques-
tions were not easy for the students and they knew the
system was recording their interactions so they want
to avoid to give wrong answers. Nevertheless, con-
sidering only the authenticated students, the number
of answers per users was, on average, 2,68.
The teacher counted 94 students attending the sec-
ond lesson. In this case the number of answers to each
question was, on average, 4, 5, so the use of the sys-
tem, during this test, increased nearly six times the
number of answers. We must note here that this result
can be due to many factors as, for example, the age
and gender of the participants, but it is clear that the
use of a device to answer, instead of a raised hand,
can help to increase the number of received answers
in a very significant way.
Finally, we collected data in 37 commercial pre-
sentations, where the system was used by different
companies which aimed at increasing users engage-
ment and attention during the presentation of their
products. Five out of these 37 events were on-line
presentations, the others were on-site. During these
events, 3753 users accessed the slideshow using our
system (2372 during the two on-line events, 1381
users were following the events on-site). Unfortu-
nately, we were not always able to collect the number
of people attending the events, but in the 11 events for
which we know the number of attending people, on
average, 75% of the audience followed the slideshows
using their smartphones or tablets, with a peak of
100% for an event.
During the 37 slideshows, the users liked, on the
whole, 4842 slides; the average of like operations per
user is 1, 66. In particular an event reaches 8, 59 “like”
per user.
The users filled out 2266 questionnaires, shared
38 slides on Facebook and sent 175 slides by email.
Moreover, the system collected 920 comments.
All these data shows that the system is able to per-
suade users to interact with the presentation, and this
is an interesting result. When we can collect the num-
ber of participants, we recorded that the system has
involved, on average, 75% of the audience. More-
over, by interacting with the presentation, the users
also gave some information about themselves to the
server, e. g. the email, and this is really useful during
commercial presentation since this data can be used
to re-contact people after the event. In the same way,
information like time spent viewing each slide can be
used for commercial purpose, since it can help to un-
derstand what has most interested the user.
Since the number of interactions with the system
is only a rough measure of its ability to engage users,
at the end of the last three events we asked to the audi-
ence to answer a question about their satisfaction with
the system: 1090 users answered the question (85% of
the total audience), 63% of the users gave a very pos-
itive evaluation, 36% gave a positive evaluation and
only 1% of the users gave a negative evaluation of the
system, therefore we can state that the users liked the
proposed system.
Finally, these tests have shown that the sys-
tem is not simply a prototype but its coverage of
PowerPoint
r
features is sufficient to make it usable.
Moreover, during all these tests, both the users and
the speakers never reported problems in the synchro-
nization of the slides.
5.3 Tests with Other Formats
During the whole test phase we considered also
other format, i. e., presentation created with Ap-
ple Keynote
r
or OpenOffice. In particular, we stud-
ied the ODF format(Organization for the Advance-
ment of Structured Information Standards (OASIS),
2005), but it resulted completely different from the
OOXML format(ECMA International, 2012) used by
PowerPoint
r
, therefore our converter is currently not
able to support this format. But our system, with some
limitations, can be used also to distribute presenta-
tions created with Keynote
r
or OpenOffice, using a
converter from the output from these software to the
OOXML format.
We tested three set of slide generated by other
software and then converted to the OOXML format.
The obtained results, converted with our system, were
evaluated with the same method described above:
each slide was evaluated to 0, 1 or 2 according to
the quality of the conversion, by the same people dis-
cussed in Section 5.1.
The results shown that, on average, the presenta-
tions got 89% of the total available points. In partic-
WEBIST2015-11thInternationalConferenceonWebInformationSystemsandTechnologies
62

ular, on average, 83% of the slides were fully graded,
12% received a score of 1 point, and only 5% of the
slides were evaluated to 0. Therefore, we can assume
that even in case of presentation generated with other
software, the result of the converter is quite the same.
This means that files which use ODP format, con-
verted to the OOXML format, are usable as an input
file for our converter, thus expanding the type of sup-
ported file, and so, the number of convertible presen-
tations. However, in this case, in addition to the errors
introduced by our system, there may be additional er-
rors generated by the conversion of a presentation to
the OOXML format.
6 CONCLUSION
In this paper we propose a system to distribute pre-
sentations to smartphones and tablet to make presen-
tations more interactive, adding questionnaires and
polls, and to improve users engagement.
The main component of our system is a converter
which is able to translate PowerPoint
r
slides into
web pages using HTML5. The user may access to
the slides, comment on them, and make other social
activities. Our tests showed that the system was able
to involve, on average, 75% of the audience, and to
make users more interactive (one test reported up to
six time more interactive) with respect to presenta-
tion based only on slides. Therefore, the use of smart-
phone to distribute slides is promising.
Moreover, interaction can continue also after the
talk, using the system in the on-line mode, which
gives the possibility to navigate slides and leave com-
ments. This last mechanism can be even more useful
after the end of the talk to continue discussion with
participants/clients. We must note here that our so-
lution collect many data about the users, i. e., data
about navigation and email, therefore some privacy
issues arise. To partially solve this problem, the sys-
tem allows the user to skip the authentication step and
logs in as anonymous. In this case, the system does
not record any email, so this user cannot be contacted
in the future. However this is not a complete solution.
Future works will be investigate how to clarify to the
user that his/her activity is registered. Moreover, we
want to increase the number of supported features and
to explore the possibility to show users comments on
a slide even on the projector screen. Actually, the pro-
jector shows the number of comments per slide, but
not the comments themselves. We are currently im-
plementing a new component, the Moderator inter-
face, which can be used to select comment to display
to all the users.
REFERENCES
Barkhuus, L. and Jørgensen, T. (2008). Engaging the crowd:
Studies of audience-performer interaction. In Conf. on
Human Factors in Computing Systems, pages 2925–
2930.
ECMA International (2012). Standard ECMA-
376, Office Open XML File Formats http://
www.ecma-international.org/publications/
standards/ecma-376.htm.
Edge, D., Savage, J., and Yatani, K. (2013). Hyperslides:
Dynamic presentation prototyping. In Conf. on Hu-
man Factors in Computing Systems, pages 671–680.
Guadagno, R. E., Sundie, J. M., Hardison, T. A., and Cial-
dini, R. B. (2011). The persuasive power of pow-
erpoint presentations. In PERSUASIVE 2011, pages
2:1–2:4.
Jones, M., Marsden, G., and Gruijters, D. (2006). Using
mobile phones & pdas in ad-hoc audience response
systems. ICI Global.
Joubert, J.-P., Greyling, J., and Cilliers, C. (2011). The con-
version from powerpoint (ppt) to compressed scalable
vector graphics (svgz). In Conf. on Knowledge, Inno-
vation and Leadership in a Diverse, Multidisciplinary
Environment, pages 123–132.
Maynes-Aminzade, D., Pausch, R., and Seitz, S. (2002).
Techniques for interactive audience participation. In
ICMI ’02, pages 15–20.
Nickerson, R. (1993). Real-time wireless audience response
system. US Patent 5,226,177.
Organization for the Advancement of Structured Informa-
tion Standards (OASIS) (2005). Open Document For-
mal http://www.opendocumentformat.org/.
Snell, Yvonne Steinert, L. S. (1999). Interactive lecturing:
strategies for increasing participation in large group
presentations. Medical Teacher, pages 37–42.
Socket IO (2015). Socket IO Library http://socket.io/.
Triglianos, V. and Pautasso, C. (2013). Asq: Interactive
web presentations for hybrid moocs. In WWW ’13
Companion, pages 209–210, Republic and Canton of
Geneva, Switzerland.
MaySmartPhonesHelptoMaintainAudienceAttentionDuringPresentations?
63
