
Psychometric Study of a Questionnaire for Academic Study Processes
of Portuguese College Students
D. Oliveira
3
, G. Esgalhado
1
, D. Oliveira
3
and N. M. Garcia
2,3
1
Psychology and Education Department, University of Beira Interior, Covilhã, Portugal
2
Computer Science Department, University of Beira Interior, Covilhã, Portugal
3
Instituto de Telecomunicações, Covilhã, Portugal
Keywords: Learning Approaches, Study Processes Questionnaire, Psychometric Study.
Abstract: Background: The assessment of the study processes or approaches to learning more often used by college
students as they are understood by Biggs and his collaborators is considered fundamental in providing tools
to better understand the way students learn and how this should be taken into account by tutors and teachers.
The choice of a deep approach to learning as opposed to a surface approach is often considered connected to
a more significant learning. Aim: This research aimed to adapt and validate the Revised Two Factor Study
Process Questionnaire (R-SPQ-2F) (Biggs et al., 2001). for the Portuguese college student population.
Method: A population of 707 college students and internet users was used. From these 241 were male and
466 female. The participants’ age varied between 18 and 40 years old (M= 22.96; SD = 4.41). The inclusion
criteria used for the study was: (1) being Portuguese and studying in a Portuguese university, and (2)
willingness to participate in the study after learning its objectives. Participants were recruited through two
sampling methods: (1) Informal social networks. The eligible internet users who agreed to participate were
asked to refer their friends to participate in the study; and (2) The Internet. Material: Two instruments were
used in this assessment, a socio-demographic questionnaire to enable the characterization of the
participants’ age, gender, degree and University/college attendance and the Revised Two Factor Study
Process Questionnaire (R-SPQ-2F) (Biggs et al., 2001). Results: The final Portuguese version has a total of
16 items, instead of the 20 items proposed by the original version. A principal components factor analysis
with varimax orthogonal rotation revealed a two factor structure, consistent with other researches using the
instrument but not confirming the four factor structure found in the original version. In this version factor I -
deep approach to learning, has a 9 items scope, and includes deep motives and deep strategies (α=.783),
with an explained variance of 20.463%; factor II - surface approach to learning has a 7 items scope, includes
surface motives and surface strategies (α=.751) and an explained variance of 16.544%. Deep and surface
approaches were analysed separately in relation to age gender and academic degree, and in all cases
significant statistical differences were found. Conclusion: The study provided evidence of the reliability and
validity of the instrument, which showed good psychometric characteristics. The results indicate the
Portuguese Revised Study Processes Questionnaire is an acceptable measure of learning approaches.
Authors like [2] consider that when students are confronted with a learning task, they use the learning
strategy that corresponds with their motivation to learn, in which case, it is important to analyse whether
students are opting more frequently for deep or surface approaches and act upon that knowledge in a
continuous effort to improve the learning process.
1 INTRODUCTION
To authors such as (Biggs, 1999) the acts of
teaching or the adequacy of the learning techniques
used by a teacher depend upon what each individual,
whether a teacher, a student or someone external to
the learning process feel is appropriate. This means
that learning acquisition isn’t bereft of subjectivism;
or rather there isn’t a single formula for the
teaching-learning process that ends up invariably in
academic success. From this point of view it
becomes clear that both teacher and student are
responsible for behaviour gains, which in turn
explains the importance of researching what every
individual thinks is more adequate.
According to (Kember et al., 1994) approaches
to learning are a direct characterization of the
learning process used by students, resulting in the
85
Oliveira D., Esgalhado G., Oliveira D. and M. Garcia N..
Psychometric Study of a Questionnaire for Academic Study Processes of Portuguese College Students.
DOI: 10.5220/0005443200850092
In Proceedings of the 7th International Conference on Computer Supported Education (CSEDU-2015), pages 85-92
ISBN: 978-989-758-108-3
Copyright
c
2015 SCITEPRESS (Science and Technology Publications, Lda.)
creation of categories that classify those approaches,
which (Biggs, 1979) differentiates in relation with
the fact that some students study in order to develop
their skill, and others do it to be able to pass the year
or finish a certain academic task. These started to be
referred by [6,7] as deep learning and surface
learning, respectively, after researching done in an
academic context.
However, [1, 8] point out that the fact a student
prefers a deep or a surface approach to learning
doesn’t allow the student’s classification in a deep
learning student or a surface learning student. In this
respect, (Biggs, 1999) thinks that even though
students’ approaches to learning vary and aren’t a
stable trait of an individual, the knowledge of this
preferences might as expressed by (Alharbi et al.,
2011) help the teacher/tutor in searching and
creating study materials appropriate for every
student.
Even though both types of approach have
advantages and disadvantages, depending on the task
required, various authors suggest that the adoption
of a deep approach to learning might positively
influence academic results, because it leads to a
more meaningful learning (Gomes, 2011) and helps
develop ways of promoting the adoption of that
approach in the cases students aren’t using it
already, even though memorization and other
surface approach techniques might be adequate
when performing certain tasks, including evaluation
(Figueiredo, 2008).
Concerning the materials used to evaluate
learning conceptions and approaches to learning,
(Valadas et al., 2009) indicates that there are few
that have been normalized and validated for
Portuguese college students. The decision to use the
R-SPQ-2F (Biggs et al., 2001) derives from the fact
that this instrument was created to: (1) identify the
learning approaches preferred by students, indicating
how much a student differs from his peers in a
similar context; (2) ask students to fill a
questionnaire with questions adapted to a certain
task, which indicate how students actually perform
the task; (3) indicate the context evaluation,
providing information regarding differences between
classes or teaching environment. Furthermore, the
authors of this questionnaire believe it can be used in
different classes, institutions, and grade system
before and after introducing changes. On a last note,
the R-SPQ-2F has been used all over the world,
adapted when necessary, which renders it a natural
good choice.
2 AIM
This research aimed to adapt and validate a study
processes questionnaire for the Portuguese college
student population, while at the same time producing
comparative measurements of participants’ gender,
age, type of superior education institution of
enrolment (university or polytechnic institute),
degree of enrolment (graduate, masters, PhD) and
year of graduation participants are attending.
Various variables were studied: variables inherent to
the questionnaire, total scores and scores attributed
to the questionnaires dimensions. It was considered
that gender, age, degree and year of enrolment are
independent variables and students study processes
(deep and surface approach) are dependent variables.
3 METHOD
A population of 707 Portuguese college students
participated in this study.
3.1 Participants
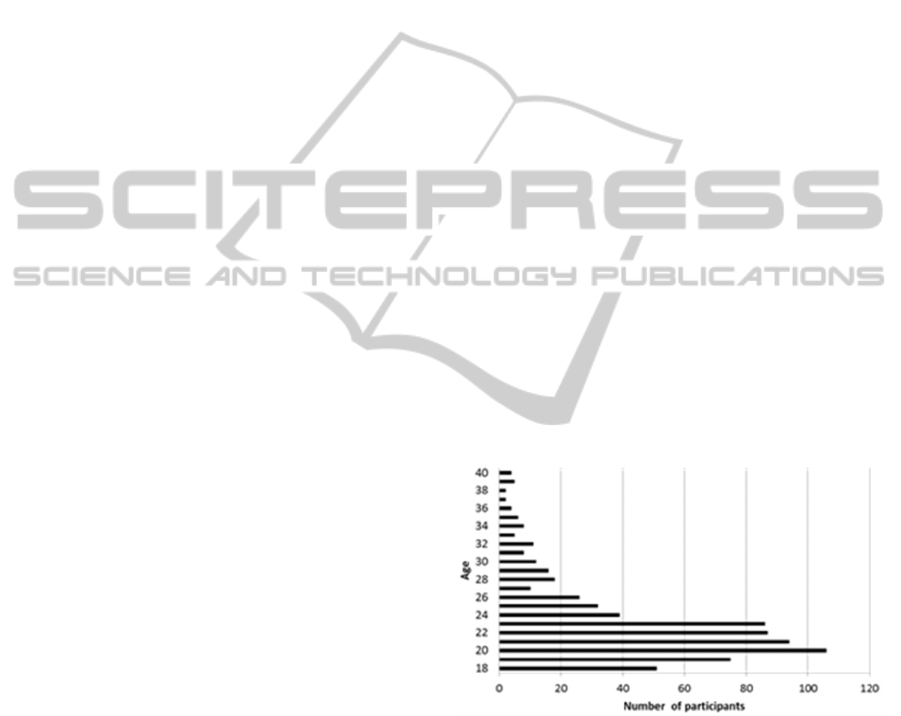
3.1.1 Age
The 707 participants’ age varies from 18 to 40 years
(M=22.96; SD=4.41), as presented in Fig. 1.
Figure 1: Frequencial distribution by age.
3.1.2 Gender
From the total of participants 466 are female and
241 are male, as shown is Fig. 2.
3.1.3 Degree
Not every participant gave information about their
degree. In fact, 8 students didn’t provide this
information. From the remaining students, 9 have a
bachelor degree, 363 a graduate degree, 263 a
CSEDU2015-7thInternationalConferenceonComputerSupportedEducation
86
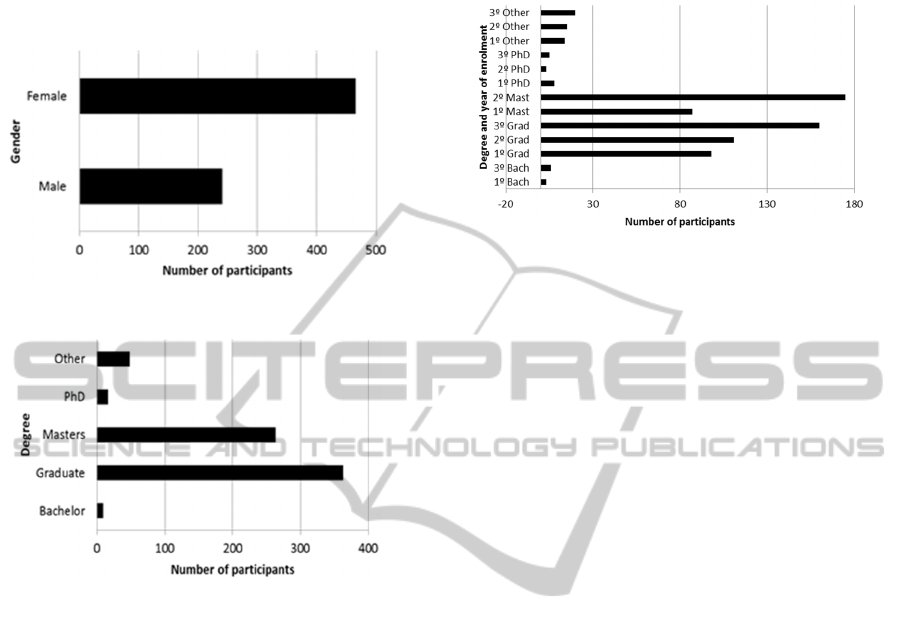
masters, 16 a PhD and 48 participants signalled the
option “other” which means that even though
there’re enrolled, they have yet to conclude any
degree, as shown in Fig. 3.
Figure 2: Frequencial distribution by gender.
Figure 3: Frequencial distribution by degree.
3.1.4 Year
Not every participant gave information about their
degree. In fact, 8 students didn’t provide this
information. From Fig. 4 presents the information
about the year the students are enrolled in or have
successfully concluded, and the year they attend of
the referred degree. For the bachelor degree 3
students referred to being enrolled in a first year and
6 in the third year. Concerning graduate studies, a
total of 369 participants indicated this degree: 98 are
enrolled in the first year, 111 in the second and 160
in the third. A total of 262 are masters students with
87 enrolled in the first year and 175 in the second
year. Only 16 students were enrolled in a PhD. From
these 8 are enrolled in the curricular year and the
other 8 are in the second or third year of their thesis.
A total of 49 participants referred to being enrolled
in years 1 to 3 of “Other” degree.
3.2 Material
In this study two instruments were used: (1) Socio-
demographic questionnaire; and (2) Revised Two
Factor Study Process Questionnaire (R-SPQ-2F)
(Biggs et al., 2001).
Figure 4: Frequencial distribution by study degree and
year of enrolment.
3.2.1 Socio-demographic Questionnaire
A socio-demographic questionnaire was built for the
study. In it the questions aimed to characterize
participants in terms of age, gender, academic
degree, year of the respective degree the participants
were enrolled at during the lective year 2013-2014,
type of establishment the participants were attending
(university or polytechnic institute) and the identity
of the referred establishment.
3.2.2 Two Factor Revised Study Processes
Questionnaire (R-SPQ-2F)
(Biggs et al., 2001)
The R-SPQ-2F is composed of 20 items that
evaluate the approaches to learning, grouping them
into two dimensions, with 10 items evaluating deep
approach and 10 items evaluating surface approach.
Each scale has two subscales measuring motivation
and strategy components. This means the subscale
that measures deep learning is composed of 5 deep
motive items and 5 deep strategies items, while the
subscale that measures surface approach has 5 items
relating to surface motives and 5 items relating to
surface strategies. All items are classified in a 5
options Likert scale, between 1 (never or rarely true)
and 5 (always or almost always true).
The total score in each scale is calculated by the
sum of the score obtained in the items relating to it,
that is, for the Deep Learning scale, the sum is
comprised of items 1+2+5+6+9+10+13+14+17+18
and for the Surface Learning scale, the sum is
comprised of 3+4+7+8+11+12+15+16+19+20. To
calculate each subscale the sum of the corresponding
items is made: Deep motive: 1+5+9+13+17; Deep
strategy: 2+6+10+14+18; Surface motive:
3+7+11+15+19 and surface strategy:
PsychometricStudyofaQuestionnaireforAcademicStudyProcessesofPortugueseCollegeStudents
87

4+8+12+16+20. For each scale the score varies
between 10 and 50 and for each subscale between 5
and 25 (Biggs et al., 2001).
In this research, between the various models to
score the questionnaire’s items found in the
literature, the one used by (Hernández et al., 2002)
was chosen. In it the higher the medium score, the
more a type of approach is being used.
Because there have been many adaptations of the
R-SPQ-2F, in different languages, the results of
those psychometric studies vary. The Cronbach’s
alpha varies between .57 in (Biggs et al., 2001) and
.78 in (Leung and Chan, 2001) in the surface
strategy subscale, for example, and other such
differences can be found for the other 3 subscales.
Additionally not all adaptations found the proposed
two scales and 4 subscales structure found in the
original questionnaire (Biggs et al., 2001). In fact,
some studies suggest solely the presence of two
factors, namely the two approaches to learning (deep
and surface) [16-18], even after performing a second
or third order factorial analysis.
On a last note it should be added that the two
types of approaches to learning reflect both the
student’s intention towards learning and the
strategies the student uses to reach that knowledge.
3.3 Procedure
Previously to the development of this research a
literature review helped choose the learning concept
to be measured and studied. Following the choice of
variable, a review of the known instruments to
measure it was undertaken. Additionally it should be
noted that permission was asked and granted by the
author of the original instrument (Biggs et al., 2001)
for it to be validated and used in a sample of
Portuguese college students.
It was necessary to translate the original
instrument from English to Portuguese. The
Portuguese version results from a formal process of
linguistic adaptation, with translation and
retroversion by specialists in the English language
and in Psychology. The specialists targeted the
creation of a version equivalent with the original,
both from a linguistic structure as from a semantic
content stand point.
After finishing this step, the formal data
collection was initiated with a pilot study that used
six participants, and aimed to guarantee that both the
instructions and the questions or items in the
instrument were clear. It was necessary to do some
small alterations to account for the observations
made in the pilot study.
The instrument was made available using Google
forms and a link for the questionnaire was
distributed by email, Facebook, and personal contact
list, to the Portuguese college institutions and
students. Additionally word of mouth was also used
to spread the request for filling the research form.
During all the process anonymity and
confidentiality were guaranteed to all participants
and the instructions held an e-mail to handle all
possible questions and doubts.
Reception of answers to the questionnaire was
available during January 2014. The answers stored
in the online database provided with Google forms
was afterwards transferred to Excel (.xls) for initial
analysis and then migrated to SPSS v.22.0 for
further and more complete analysis.
4 RESULTS
In order to assure that the Portuguese version of the
revised study processes questionnaire could be used
in the future by other researchers in other studies,
the instrument was analysed in terms of it
sensibility, reliability and factorial analysis.
4.1 Sensibility
The sensibility analysis of the items was done
through measurements of Skewness and Kurtosis.
According to (DeVellis, 1991), І2І absolute values
indicate absence of dispersion which guarantees an
instrument sensibility. All items showed a good
sensibility with the exception of item 7, which was
for this reason eliminated. In Table 1 items and
corresponding sensibility values are presented.
After analysing sensibility, internal consistence
was also analysed.
4.2 Internal Consistence
The sensibility analysis of the items was done
through measurements of Skewness and Kurtosis.
According to (DeVellis, 1991), І2І absolute values
indicate absence of dispersion which guarantees an
instrument sensibility. All items showed a good
sensibility with the exception of item 7, which was
for this reason eliminated. In Table 1 items and
corresponding sensibility values are presented.
After analysing sensibility, internal consistence
was also analysed.
CSEDU2015-7thInternationalConferenceonComputerSupportedEducation
88

4.3 Confirmatory Factor Analysis
An exploratory factor analysis was performed; that
is, without previous fixed dimensions items were
allowed to group and form dimensions. Afterwards
sample adequacy was tested through the Keiser
Meyer Olkin (KMO) test. This test whose scores
vary between 0 and 1, considers that scores close to
1 are evidence of an excellent adequacy (Marôco,
2011). For this instrument a KMO=.857 was
obtained. Furthermore, Bartlett’s test revealed an
X2=2897.626; p<.001, indicative of the adequacy of
performing the factor analysis. The principal
components method was applied to extract factors
and varimax rotation was used to arrive at the factor
solution.
Table 1: Skewness and Kurtosis values of the Portuguese
version of the items of the Revised Study Processes
questionnaire (Biggs et al., 2001).
Itens Skewness
Skewness
Std. Error
Kurtosis
Kurtosis
Std. Error
1. Studying gives me a
sense of…
-.196 .092 -.470 .184
2. I have to work or study
hard…
-.161 .092 -.609 .184
3. My objective is to pass
the year…
1.007 .092 .310 .184
4. I only study seriously
what is given…
-.413 .092 -.502 .184
5. I feel that every subject
might…
-.305 .092 -.403 .184
6. I consider the majority
of new…
.154 .092 -.469 .184
7. I don’t think my course
is very…
1.996 .092 4.107 .184
8. I learn some things by
heart…
.666 .092 -.091 .184
9. I consider that studying
academic…
-.269 .092 -.549 .184
10. I ask myself
questions…
-.485 .092 -.192 .184
11. I believe I can obtain
approval in…
.578 .092 -.237 .184
12. Generally, I just
study…
.213 .092 -.528 .184
13. I study hard
because…
-.148 .092 -.387 .184
14. I spent a fair amount
of my…
.584 .092 .044 .184
15. I don’t consider it is
useful to study…
.934 .092 .648 .184
16. I consider teachers
don’t…
.088 .092 -.867 .184
17. I go to the majority of
classes with…
.389 .092 -.428 .184
18. I make it a point of
looking at…
-.205 .092 -.681 .184
19. I don’t see any reason
in…
.508 .092 -.213 .184
20. I believe the best way
to pass…
.876 .092 .312 .184
Initially four factors were produced, with a total
explained variance of 49.991%. Factor 1 is
comprised by 7 items relating to deep motives and
strategies and explains a total variance of 17.378 %,
with an alpha of.779; factor 2 is formed by 5 items
related to surface motives and strategies, and
explains a total variance of 13.224%, with an alpha
of .703; factor 3 has 3 items related to surface
motives and strategies and explains a total variance
of 11.117%; finally, factor 4 has 3 items related to
deep motives and strategies and explains a total
variance of 8.271%, with an alpha of .449, which
justifies the elimination of this dimension and,
consequently, of items 2, 17 e 18, even though
according to authors as (Ford et al.,1986) the alpha
score should be at least .40 to be considered
acceptable. Table 2 shows the organization of the
extracted factor analysis dimensions and the factor
scores for the items.
By observing table 2, it is possible to conclude
that the factor structure found in the theoretical
design of the instrument proposed by (Biggs et al.,
2001): 4 subscales resulting in 4 different factors,
isn’t verified in the present study.
Next, Scree Plot was analysed (Fig.5), and the
pronounced curvature considered consistent with a
two factors solution. Based on this information a
new factor analysis with varimax rotation was
performed, locking two factors.
Table 2: Component matrix by principal component
analysis, and items factor value.
Items Factors
I II III IV
9. I consider that studying
academic…
.721
6. I consider the majority of new… .719
14. I spent a fair amount of my… .707
13. I study hard because… .644
1. Studying gives me a sense of… .610
10. I ask myself questions… .486
5. I feel that every subject might… .430
16. I consider teachers don’t… .727
19. I don’t see any reason in… .676
15. I don’t consider it is useful to
study…
.624
12. Generally, I just study… .598
4. I only study seriously what is
given…
.578
3. My objective is to pass the year… .495
11. I believe I can obtain approval
in…
.805
8. I learn some things by heart… .796
20. I believe the best way to pass… .708
18. I make it a point of looking at… .657
2. I have to work or study hard… .605
17. I go to the majority of classes
with…
.422
Α .779 .736 .717 .449
Fixing the two factors, the explained total
variance of the instrument becomes 37.008%, and
the instrument is now composed of 2 factors. Factor
1 has 9 items related to deep approach, including
deep motives and strategies and is denominated
“Deep Approach”. This factor explains a variance of
20.463%, and has an alpha of .783; factor 2 is
composed by 7 items, including surface motives and
strategies, and is denominated “Surface Approach”.
This factor explains a variance of 16.544% and
presents a .751 alpha, as shown in Table 3.
PsychometricStudyofaQuestionnaireforAcademicStudyProcessesofPortugueseCollegeStudents
89

Figure 5: Scree plot graphic.
Table 3: Organization of the factor analysis extracted
dimensions, fixing two factors and presenting the factor
score values for each item.
Itens
I II
1. Studying gives me… .656
5. I feel that every… .437
6. I consider the… .627
9. I consider that… .666
10. I ask myself… .532
13. I study hard because… .694
14. I spent a fair amount of my… .674
17. I go to the majority of classes with… .487
18. I make it a point of looking at… .462
8. I learn some things by heart… .661
11. I believe I can obtain approval in…… .712
12. Generally, I just study… .578
15. I don’t consider it is useful to study… .542
16. I consider teachers don’t… .482
19. I don’t see any reason in… .571
20. I believe the best way to pass… .734
α .783 .751
Table 4: Portuguese Revised Study Processes
Questionnaire (QPER) final structure.
Itens
I II
1. Studying gives me a sense of… .656
5. I feel that every subject might… .437
6. I consider the majority of new… .627
9. I consider that studying
academic…
.666
10. I ask myself questions… .532
13. I study hard because… .694
14. I spent a fair amount of my… .674
17. I go to the majority of classes
with…
.487
18. I make it a point of looking at… .462
8. I learn some things by heart… .661
11. I believe I can obtain approval
in……
.712
12. Generally, I just study… .578
15. I don’t consider it is useful to
study…
.542
16. I consider teachers don’t… .482
19. I don’t see any reason in… .571
20. I believe the best way to pass… .734
α .783 .751
Dimensions Items
Deep Approach 1, 5, 6, 9, 10, 13, 14, 17, 18
Surface Approach 8, 11, 12, 15, 16, 19, 20
The Portuguese Revised Study Processes
Questionnaire (QPER) presents a two scales factor
structure and not the 4 subscales presented in the
original instrument (Biggs et al., 2001).
Furthermore, the Portuguese questionnaire is
composed of 16 items and not the 20 items of the
original.
The structure and total score calculus
proceedings for each approach result of the total
score of the sum of the items in each respective
dimension as shown in Table 4.
Besides validating the instrument, the data
collected in this research was further analysed to
study its compliancy with proposed hypothesis on
whether gender, age and degree of scholarship might
produce statistical significant differences in one or
both of the scales.
The research found that there is a significant
statistical difference between genders. In terms of
Surface Approach male students (M=16.73;
SD=4.38) have higher scores than female students
(M=15.45; SD=4.26), with a statistical significant
difference of p<.001. When analysing Deep
Approach, results showed than female students (M=
28.03; SD= 5.34) have higher scores than male
students (M= 26.75; SD= 4.91), and there is also a
significant statistical difference between genders
(p<.005). To both genders higher scores were
obtained in the Deep Approach dimension.
When age was analysed, a significant statistical
difference was found between students with ages
between 23 and 40 years old and deemed older
students (M=28.56; SD=5.07) and students with
ages between 18 and 22 years old and deemed
younger students (M=26.91; SD=5.24), and older
students scoring higher in the Deep Approach
dimension (p<.001). In terms of the Surface
Approach dimension, a significant statistical
difference was also found (p<.05), but in this case
younger students (M=16.20; SD= 4.30) scored
higher than older students (M= 15.45; SD= 4.36).
Concerning age, both younger and older students
obtained higher scores in the Deep Approach
dimension.
Significant statistical differences were also found
between students with a higher degree and a lower
degree. In this case, for the Surface Approach
dimension, students with a higher degree (M=15.53;
SD=4.17) scored lower than students with a lower
degree (M=16.19; SD=4.47) and the statistical
significant difference is p<.05). As for the Deep
Approach, in this case students with a higher degree
(M= 28.08; SD= 5.09) scored higher than students
with a lower degree (M= 27.17; SD= 5.31), and
there’s also a significant statistical difference
(p<.05). Lastly, in what concerns students with a
higher or a lower degree, students scored higher in
the Deep Approach dimension.
CSEDU2015-7thInternationalConferenceonComputerSupportedEducation
90

5 CONCLUSIONS
According to authors such as Lublin, (2003) Pashler
et al. (2008) and de Souza et al. (2010) the need to
promote an educational context that facilitates the
students’ learning process requires a precise
diagnostic of the individual types and approaches to
learning these students use. This diagnostics is
possible by using available instruments that study
the approaches to learning adopted by students when
they’re faced with different academic tasks and how
to adapt the teaching method and techniques in
response to those findings.
In this research a particular instrument (Biggs et
al., 2001) whose characteristics and objectives were
in line with the researchers study was selected, more
so because this instrument has been adapted by
several researchers for different populations.
In the process of adapting and validating the
original instrument, the results of the Portuguese
Revised Study Processes Questionnaire were found
to not replicate the factor structure found on the
original instrument, however they were similar to
those found by other researchers when validating
and adapting the original instrument to their own
samples. The researchers concluded that the
Portuguese version of the instrument showed good
psychometric properties that make it suitable to
apply in studies using samples of Portuguese college
students.
Besides enabling the production of a validated
instrument, by analysing the data collected the
researchers acquired valuable knowledge related not
only to what approach to learning is more often
used, but also how variables like gender, age and
academic degree might influence student choices.
Knowing the choices made by students and how
those are influenced can allow teachers and tutors to
analyse how the techniques and methods they are
employing are influencing students in their choices
of approaches to learning, and also help teachers and
tutors develop ways to adapt their techniques and
methods in the hopes of providing a learning
environment that promotes the predominant use of a
deep approach to learning and therefore make sure
students have a more meaningful learning, which
authors associate with the predominant use of a deep
approach to learning.
ACKNOWLEDGMENTS
The authors would also like to acknowledge the
contribution of the COST Action IC1303 –
AAPELE.
The authors acknowledge the funding for this
research in the scope of R&D Unit 50008, financed
through the project UID/EEA/50008/2013.
REFERENCES
Biggs, J. B., Kember, D., & Leung, D. Y. P. (2001). The
Revised Two Factor Study Process Questionnaire: R-
SPQ-2F. British Journal of Educational Psychology.
71, 133-149.
Biggs, J. B. (1985). The role of metalearning in study
processes. British Journal of Educational Psychology,
55 (3), November, 185-212.
Biggs, J. (1999) What the Student Does: teaching for
enhanced learning. Higher Education Research &
Development, 18, (1), 55. Publisher: Routledge.
Kember, D., Charlesworth, M., Davies, H., McKay J. &
Stott, V. (1994). Evaluating the effectiveness of
educational innovations: using the study process
questionnaire to show that meaningful learning occurs.
Studies in Educational Evaluation, 23 (2), 141-157.
Biggs, J. (1979). Individual differences in study processes
and the quality of learning outcomes. Higher education
8. Springer Magazine. Elsevier scientific publishing
company. Amsterdam, 381-394.
Marton, F., & Saljö, R. (1976a). On qualitative differences
in learning: I - outcome and process. British Journal of
Psychology, 46(4), 4-11.
Marton, F., & Saljö, R. (1976b). On qualitative differences
in learning: II - outcome as a function of the learners
conception of the task. British Journal of Psychology,
46(4), 115-127.
Hamm, S. & Robertson, I. (2010). Preferences for deep-
surface learning: A vocational education case study
using a multimedia assessment activity. Australasian
Journal of Educational Technology, 26 (7), 951-965.
Biggs, J. (1999) Teaching for quality learning at
university. Buckingham: Society for Research into
Higher Education and Open University Press.
Alharbi, A., Paul, D., Henskens, F. & Hannaford, M.
(2011). An Investigation into the Learning Styles and
Self- Regulated Learning Strategies for Computer
Science Students. In Proceedings of ASCILITE -
Australian Society for Computers in Learning in
Tertiary Education Annual Conference, 36-46.
Gomes, C. M. A. (2011). Abordagem profunda e
abordagem superficial à aprendizagem: diferentes
perspectivas do rendimento escolar. Psicologia:
reflexão e crítica. 24(3), 479-488.
Figueiredo, F. J. C. (2008). Como ajudar os alunos a
estudar e a pensar?: Auto-regulação da aprendizagem.
Educação, Ciência e Tecnologia, RE, 34, Ed. Instituto
Politécnico de Viseu, Abril, 233-258.
Valadas, S. T., Gonçalves, F. R., & Faísca, L. (2009).
Estudo de tradução, adaptação e validação do ASSIST
numa amostra de estudantes universitários
PsychometricStudyofaQuestionnaireforAcademicStudyProcessesofPortugueseCollegeStudents
91

portugueses. Revista Portuguesa de Educação, 22 (2),
191-217.
Hernández Pina F., Sanz, M. P. G., Martínez, P. C.,
Hervás, R. M. A. & Maquilón, J. S. (2002).
Consistencia entre motivos y estrategias de
aprendizaje en estudantes universitários. Revista de
Investigación Educativa, 20 (2), 487-510.
Leung, M.-T. & Chan, K.-W. (2001) Construct validity
and psychometric properties of the Revised Two-
factor Study Process Questionnaire (R-SPQ-2F) in the
Hong Kong context. Melbourne Australian
Association for Research in Education. Paper
presented at the AARE 2001 conference, 2-6
December, 2001 at the Notre Dame University, Perth,
Australia. URL: http://www.aare.edu.au/01pap/
cha01708.htm. Consultado a 30/07/2014.
Gargallo, B., Garfella, P.R. & Pérez, C. (2006). Enfoques
de aprendizaje y rendimento académico en estudiantes
universitarios. Bordón. Revista de Pedagogía, 58 (3),
45-57.
Phan, H. P. (2006). Examination of Student Learning
Approaches, Reflective Thinking, and Epistemological
Beliefs: A Latent Variables Approach. Journal of
Research in Educational Psychology, 10 (4 (3)), 577-
610.
Phan, H. P. & Deo, B. (2008). Revisiting the South Pacific
approaches to learning: a confirmatory factor analysis
study. Higher Education Research & Development, 27
(4), 371-383.
DeVellis, R. F. (1991). Scale Development: Theory and
Applications. Journal of Educational Measurement, 31
(1), Spring, 1994, 79-82.
Marôco, J. (2011). Análise Estatística com o SPSS
Statistics 5ª edição.
Ford, J. K., MacCallum, R. C. & Tait, M. (1986). The
application of exploratory factor analysis in applied
psychology: a critical review and analysis. Personnel
Psychology, 39 (2), June, 291-314.
Lublin, J. (2003). Deep, surface and strategic approaches
to learning. Centre for Teaching and Learning - Good
Practice in Teaching and Learning. Dublin.
Pashler, H., McDaniel, M., Rohrer, D. & Bjork, R. (2008).
Learning Styles: Concepts and Evidence.
Psychological Science In The Public Interest. A
journal of the association for psychological science, 9
(3), December, 106-116.
de Souza, R. B. de L. & de Souza, L. N. (2010) Um
mergulho nos aspectos da aprendizagem profunda nos
cursos de ciências contábeis do brasil. Revista de
negócios – Business review, 9, March.
CSEDU2015-7thInternationalConferenceonComputerSupportedEducation
92
