
Analysis and Modeling of a Platform with Cantilever Beam using
SMA Actuator
Experimental Tests based on Computer Supported Education
Leandro Maciel Rodrigues
1
, Thamiles Rodrigues de Melo¹, Jaidilson Jó da Silva
2
, Angelo Perkusich
2
and José Sérgio da Rocha Neto
2
1
Post-Graduate in Electrical Engineering - PPgEE – COPELE, Campina Grande-PB, Brazil
2
Electrical Engineering Department (DEE), Federal University of Campina Grande, Aprígio Veloso Street, 882, Campina
Grande-PB, Brazil
Keywords: Modeling, Platform with Cantilever Beam, Shape Memory Alloy, Computer Supported Education.
Abstract: This paper presents a test platform with cantilever beam that uses a SMA (Shape Memory Alloy) as actuator
and strain gauges as sensors to study of the beam deformation. From the data acquired by means of heating
and cooling processes, the engineering students can observe the hysteresis behavior of the SMA wire.
Besides, the study of this platform provide to the students can put in practice their knowledge about data
acquisition, system identification, modeling and programming based on computer supported education.
1 INTRODUCTION
Mechanical systems, such as industrial machinery,
civil construction and transport vehicles are often
subject to internal and external excitations, which
result in undesirable vibrations, disturbing operators
and in some cases, putting at risk the structural
integrity of the system. This phenomenon has
mobilized a significant number of researchers and
there are numerous specialized publications in this
area (Li et al, 2014).
The vibration control of flexible structures has
been the subject of studies by many researchers.
According to these studies, the integrated use of
sensors, actuators and controllers would enable a
system to respond in a controlled manner to external
excitations, looking for the effects that would lead
the response amplitude levels to deviate from
acceptable levels (Schmidt, 2014).
Shape Memory Alloys (SMA) have been
considered as one of the most interesting smart
material systems, and they have great potential for
applications in modern active structures, mainly as
electrical or thermal actuators. Previously, strained
SMA actuators recover their original shape when
heated above a critical temperature. In the case of
SMA actuators type wire under uniaxial tensile
mechanical load, this shape recovery corresponds to
a contraction, and the actuator provides useful
external mechanical work (Nascimento et al, 2008).
Due to this phenomenon, the SMA can be used
as sensors and/or actuators in aerospace, oil and
automotive industries, in orthodontic, orthopedic and
robotic applications, or vibration and shape control.
When used as thermomechanical actuators, in which
heating is performed by Joule effect resulting from
the application of a certain intensity of current, SMA
become an attractive alternative due to its large
deformation and good recovery in systems where
great strengths, large deformation and low
frequencies are required (Lima et al, 2010), (Suzuki
and Kagawa, 2010).
Modeling is the process of obtaining equations or
graphs to represent, as closely as possible the
characteristics or behavior of a real system. The
importance of modeling real systems is evidence
when the results can be used to provide a better
understanding of the system (Ljung, 1999).
System identification is an alternative procedure
that aims to build a model to explain, at least in part
and approximately, the relationship of cause and
effect present in a database without the need for
prior knowledge of the physics of the process
(Ljung, 1999).
In this context, this work presents an
experimental methodology for engineering students
perform the modeling of a test platform with
238
Rodrigues L., Rodrigues de Melo T., Jó da Silva J., Perkusich A. and da Rocha Neto J..
Analysis and Modeling of a Platform with Cantilever Beam using SMA Actuator - Experimental Tests based on Computer Supported Education.
DOI: 10.5220/0005443902380243
In Proceedings of the 7th International Conference on Computer Supported Education (CSEDU-2015), pages 238-243
ISBN: 978-989-758-108-3
Copyright
c
2015 SCITEPRESS (Science and Technology Publications, Lda.)
cantilever beam dedicated to the deformation study.
From the data acquired, the students can obtain a
relationship between the voltage applied in the SMA
actuator type wire (which provocate deformation on
the beam) and the deformation measured by a strain
gauge sensor on the platform. Besides, the students
can observe the hysteresis behavior of the SMA
wire.
Using the MATLAB tool for system
identification, the students can generate
mathematical models for the test platform and
posteriorly, to implement a control strategy to
control the beam deformation.
2 MATERIALS AND METHODS
2.1 Test Platform
The measuring system implemented for study of the
platform with cantilever beam is constituted by: the
physical structure of the test platform; two strain
gauge sensors; a SMA wire; a set of connector
blocks to make the connection between a PC and the
platform; and an Human Machine Interface (HMI),
developed in LabVIEW software, for monitoring of
the beam deformation and sending commands to the
SMA actuator.
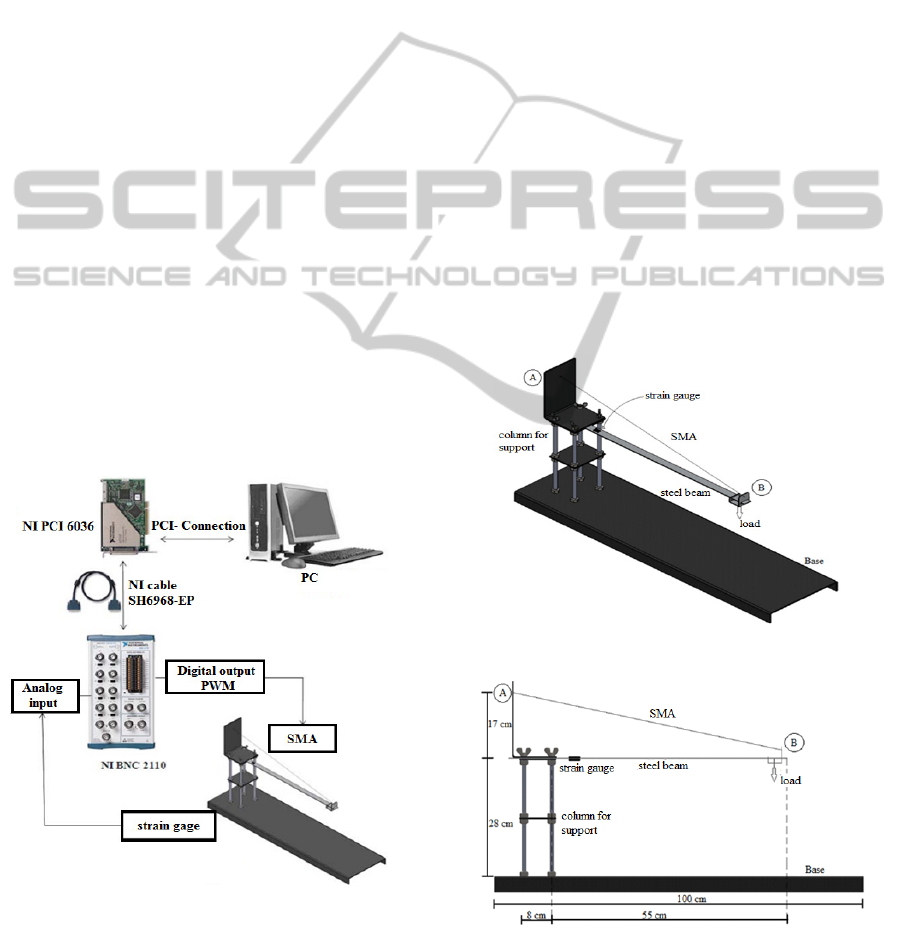
The complete measuring system can be seen in
Figure 1.
Figure 1: Scheme of the measuring system implemeted for
data acquisition and acting of the SMA actuator.
The physical structure of the test platform shown
in Figure 2 is composed by three parts:
• Base: A flat rectangular base, made of iron, and
with dimensions: 100 cm x 25.7 cm x 3.5 cm (L
x W x H);
• Support Column: A column built on the base,
consisting of four screws 28 cm long and 1 cm in
diameter, arranged in a spaced manner to form a
rectangle; two rectangular fastening plates
measuring 10 cm x 12 cm; and a third plate of 22
cm, positioned vertically for attachment of the
SMA wire (detail A of Figure 2);
• Beam: A steel beam 55 cm long, 2.6 cm wide and
2 mm thickness. One of the ends of the beam is
clamped to the support column by means of two
clamping plates and the other end is free, but
connected to the actuator of SMA through a
small metal piece (detail B of Figure 2).
The strain gauges sensors are glued on the top
and bottom faces of the beam, in order to obtain data
on the deformation of the beam. The SMA actuator
type wire can pull the beam or release it. At the ends
of the SMA wire, the electrical terminals are
connected, which provide the electrical signal
activation, making electric current pass through the
wire and by Joule effect making it to contract more
or less depending on the current intensity.
(a) Isometric view.
(b)
Side view
Figure 2: The physical structure of the test platform:
Isometric (a) and Side (b) view of the platform.
AnalysisandModelingofaPlatformwithCantileverBeamusingSMAActuator-ExperimentalTestsbasedonComputer
SupportedEducation
239
The sensors and the SMA actuator are connected
to the PC via a BNC connector block manufactured
by National Instruments, named as NI BNC 2110
model. This connector is linked to the PC via an
internal PCI card model, named as NI PCI 6036-E
(NATIONAL INSTRUMENTS, 2010).
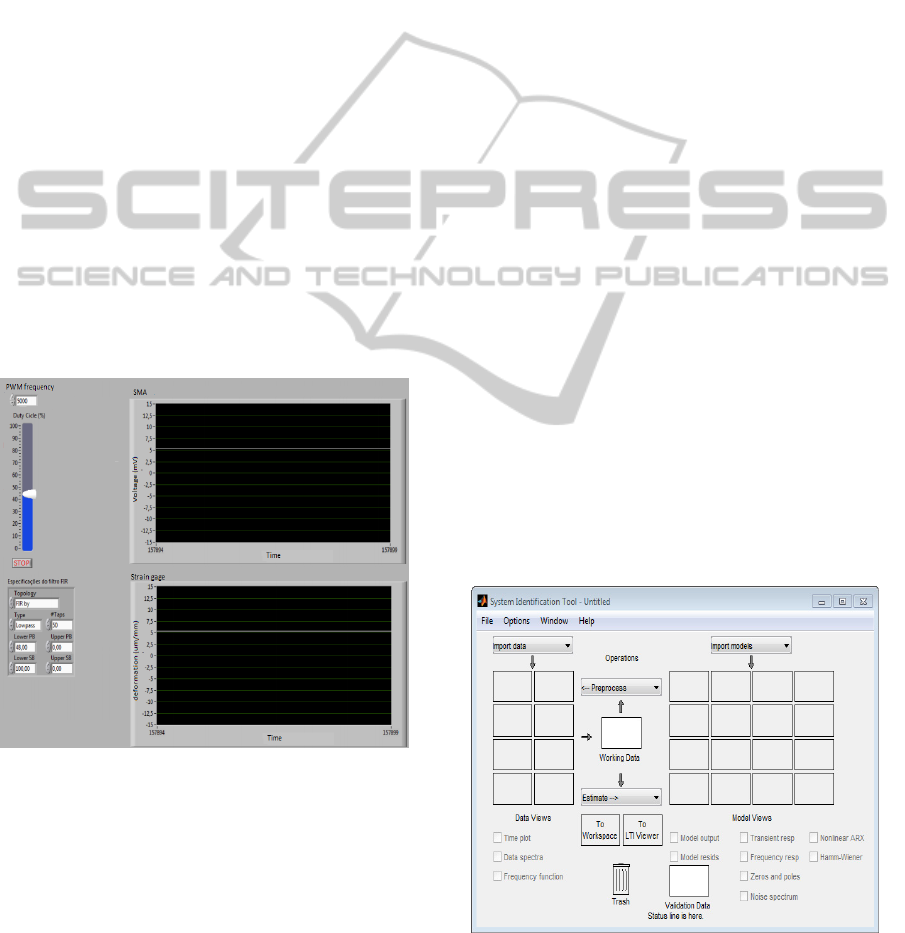
From the PC, the informations about the test
platform can be seen by means of the HMI
implemented via LabVIEW software, as observed in
Figure 3. On the HMI, the engineering students can
view in the graphical boxes the deformation of the
beam in μ/ (micrometer per milimeter) and a
sample of the RMS voltage that is applied on the
SMA. The signal that is sent to the SMA is a PWM
(Pulse Width Modulation), in which the students can
choose the frequency and the duty cycle of the
PWM.
After being performed the test, the data
collected during the experiment can be stored for
later viewing. This is done using a LabVIEW tool
that allows integration of this software with
MATLAB. The block in LabVIEW that makes the
interaction with the MATLAB is the “MATLAB
Script”. When the student stops the test pressing the
STOP button in the software interface, then the data
is sent to MATLAB and stored in variables.
Figure 3: The screen of the HMI implemented in
LabVIEW software for monitoring of the beam
deformation.
2.2 Experimental Methodology
To observe the hysteresis behavior of the SMA wire
in study, it is necessary to plot the heating and
cooling curves of this actuator. These curves can be
obtained by means of the relationship between the
voltage applied on the SMA (a sample of the RMS
voltage) and the deformation suffered by the beam
when the SMA is heated or cooled.
Hence, a set of measurements are realized and a
statistical treatment is made, in order to calculate the
arithmetical average and the standard deviation and
then to verify a confidence interval.
The heating curve is generated applying on the
SMA a PWM signal with 1 kHz of frequency and
10% of duty cycle, and after 25 seconds, the duty
cycle is increased in 10%. This action is repeated
until it reaches a duty cycle of 100%. The same
process is made to obtain the cooling curve, but with
decreasing duty cycle of 10% until it reaches 10% of
duty cycle.
2.3 Mathematical Models
Due to the actuator has different behaviors when
occour the heating and cooling processes, then it is
interesting that students obtained different models
for each process.
To identify and generate a model for the test
platform, the engineering students use a MATLAB
tool called ident, as shown in Figure 4. From the
data obtained in the tests, models of different orders
are generated by clicking in “Estimate -> Process
models” in the window.
Using the ident, the students can also to validate
the models, to compare the output model generated
and the output measured, and to qualify with an
index how they fit.
Thus, the validation of the models are done by
means of a set of measurements does not used for
modeling. These measures are imported in the
“Validation Data” box, also present in the window.
Figure 4: Interface of the System Identification toolbox
(ident) of the MATLAB.
CSEDU2015-7thInternationalConferenceonComputerSupportedEducation
240
Two models are used for modeling of the
platform with cantilever beam: First Order with
Dead Time (FOPDT) model and Second Order with
Dead Time (SOPDT) model, which are shown in
Equation (1) and (2), respectively:
(
)
=
+1
(1)
where: G(s) is the transfer function of the system in
study, the steady-state gain,
the transport delay
and
the time constant.
(
)
=
+1(
+1)
(2)
where:
is the first time constant and
is the
second time constant of the system in study.
3 RESULTS
3.1 Hysteresis Behavior
After to acquire the measurements, the engineering
students realized the statistical analysis, in which
calculated the arithmetical average and the standard
deviation of the data.
In Table 1 is shown the relationship between a
set of the RMS voltage measured in the SMA and
the deformation of the beam measured with the
strain gauges sensors, when the SMA is heated.
Table 1: Average values and standard deviation when
SMA is heated.
Voltage (V) Deformation (/)
Standard
deviation
0.38 2.87 0.21
0.62 5.60 0.59
0.88 8.50 0.27
1.12 11.65 0.31
1.36 18.27 0.18
1.60 45.43 0.31
1.84 68.14 0.54
2.08 87.18 0.90
2.32 97.02 0.36
2.44 101.78 0.68
In Table 2 is shown the relationship between a
set of the RMS voltage measured in the SMA and
the deformation of the beam measured with the
strain gauges sensors, when the SMA is cooled.
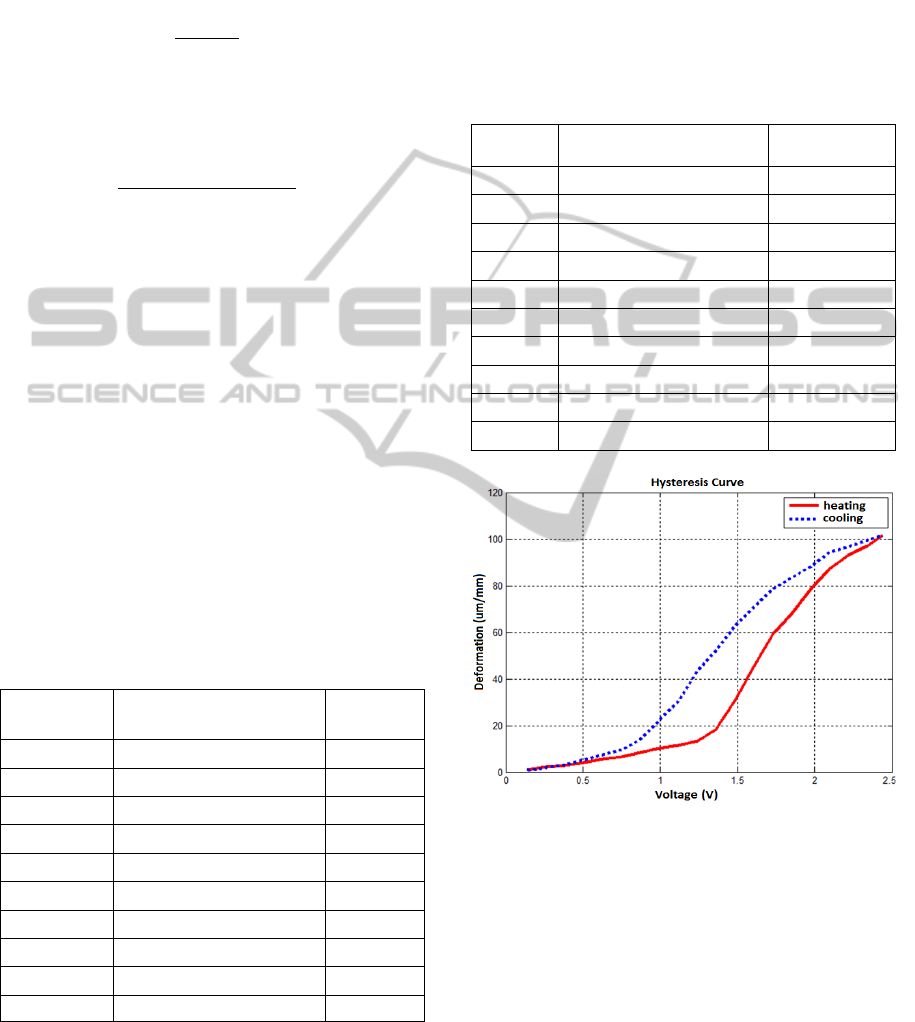
From the data of Voltage and Deformation
presented both the tables, the students can plotted
the heating and cooling curves and consequently,
can observed the hysteresis behavior of SMA
actuator, as shown in Figure 5. The solid line
represents the heating process and the dotted line
represents the cooling process.
Table 2: Average values and standard deviation when
SMA is cooled.
Voltage
Deformation (/)
Standard
deviation
2.44 101.78 0.68
2.21 96.77 0.75
1.97 88.27 0.21
1.72 78.54 0.75
1.48 62.47 0.75
1.23 43.61 0.68
0.99 22.29 0.95
0.75 9.76 0.21
0.50 5.28 0.61
0.26 1.85 0.36
Figure 5: Graphic of hysteresis of the SMA actuator
obtained by engineering students from the experimental
methodology adopted.
3.2 Modeling and Validation
Using as input the data of a set of the RMS voltage
measured in the SMA and as output the data of the
deformation of the beam measured with the strain
gauge, were generated FOPDT and SOPDT models
in MATLAB tool for heating and cooling of the
SMA wire.
AnalysisandModelingofaPlatformwithCantileverBeamusingSMAActuator-ExperimentalTestsbasedonComputer
SupportedEducation
241
In Equations (3) and (4) are presented the
FOPDT and SOPDT models, respectively, obtained
by students for heating process:
(
)
=
41.68
.
2.63 + 1
(3)
(
)
=
36.85
.
(
1.78 + 1
)
(1.49 + 1)
(4)
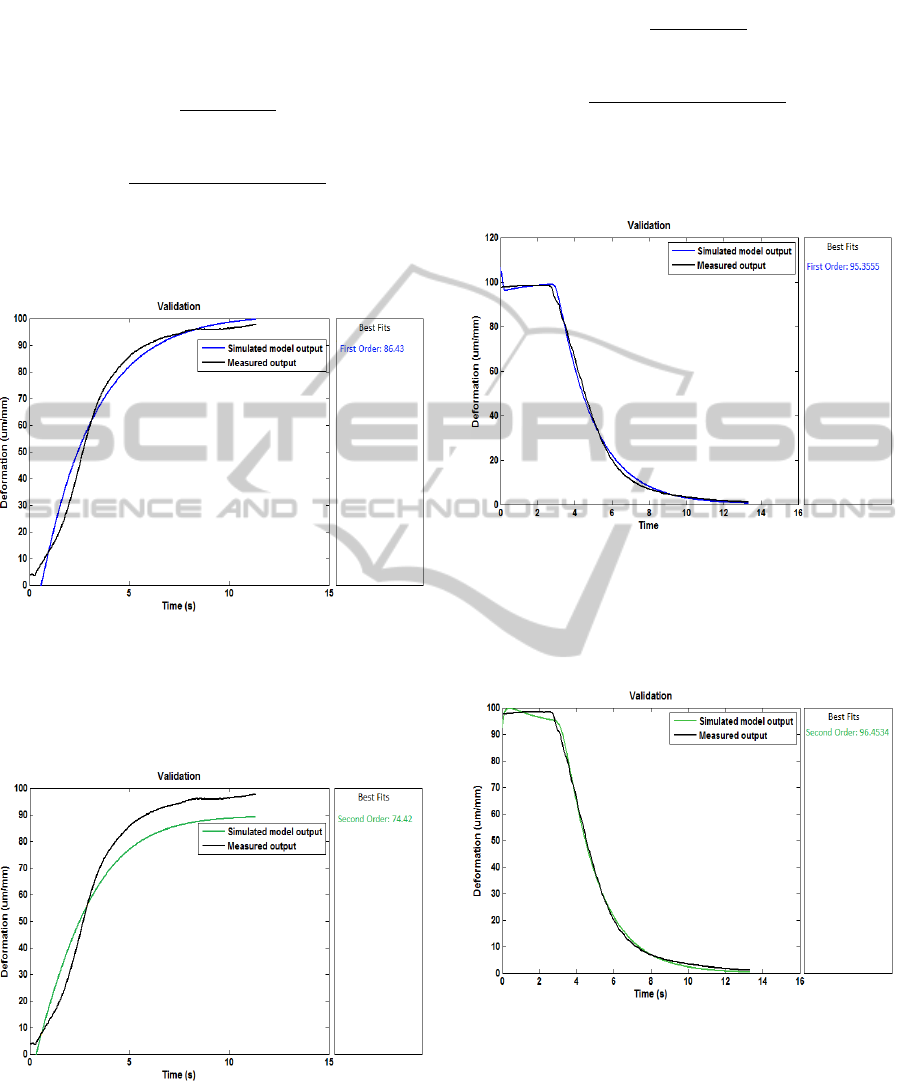
The FOPDT model curve obtained for heating
process can be seen in the Figure 6. The model fits
the output measured 86.43%.
Figure 6: Validation FOPDT model curve obtained for
heating process.
The SOPDT model curve obtained for heating
process can be seen in the Figure 7. The model fits
the output measured 74.42%
Figure 7: Validation SOPDT model curve obtained for
heating process.
Similarly, in Equations (5) and (6) are presented
the FOPDT and SOPDT models, respectively,
obtained by students for cooling process:
(
)
=
41.05
.
0.98 + 1
(5)
(
)
38.22
.
(
0.89 + 1
)
(0.13 + 1)
(6)
The FOPDT model curve obtained for cooling
can be seen in the Figure 8. The model fits the
output measured 95.35%.
Figure 8: Validation FOPDT model curve obtained for
cooling process.
The SOPDT model curve obtained for cooling
process can be seen in the Figure 8. The model fits
the output measured 96.45%.
Figure 9: Validation SOPDT model curve obtained for
cooling process.
The four models generated for the test platform
fits with the output measured more than 74% based
on ident index.
Comparing the two models obtained for heating
process based on ident index, the students
considered the FOPDT model a better model than a
SOPDT model.
CSEDU2015-7thInternationalConferenceonComputerSupportedEducation
242

Likewise, comparing the two models obtained
for cooling process, the students consider both types
of models as good, because the FOPDT and SOPDT
models have almost the same value of index.
4 CONCLUSIONS
In this work, it was presented an experimental
methodology for engineering students performed the
modeling of a test platform with cantilever beam
that uses a SMA wire as actuator. By means of the
MATLAB tool for system identification, the
students could obtain the mathematical models and
to make the validation of them.
Furthermore, the students observed that the
hysteresis behavior of the SMA wire is associated to
the beam deformation, verifing the importance of
generating different models for heating process (by
Joule effect, increasing the current in the SMA) and
cooling process (decreasing the current in the SMA)
of the actuator.
From the FOPDT and SOPDT models, the
students can implement a control strategy, for
example using a PID control, to control the beam
deformation, in order to reduce or eliminate
disturbances, such as vibrations, on the physical
structure of the test platform.
Other possibility was the students used the data
acquired and the models obtained for developing of
a soft sensor, i.e., in case of fail of the real sensor,
the measures can be estimated by means of data
stored on the PC.
Therefore, the study of the platform with
cantilever beam provide to the engineering students
a way for putting in practice its knowledge about
system identification and modeling, data acquisition
and programming based on computer supported
education.
ACKNOWLEDGEMENTS
The authors would like to thank CAPES and PPgEE-
COPELE for financial support.
REFERENCES
Li, S., Li, J., Mo, Y., 2014. Piezoelectric Multimode
Vibration Control for Stiffened Plate Using ADRC-
Based Acceleration Compensation. IEEE Transactions
on Industrial Electronics; 61(12):6892-6902.
Lima W. M., Araujo, C. J., Valenzuela, W. A. V, Rocha
Neto, J. S., 2010. Deformation Control of a Flexible
Beam under Low Frequency Loading using Ni-Ti-Cu
SMA Wire Actuator. ABCM Symposium Series in
Mechatronics - Vol. 4 - pp.110-119.
Ljung, L., 1999. System Identification: Theory for the
User. Prentice Hall, 2
nd
Edition.
Nascimento, M. M. S. F., Araújo, C. J., Almeida L. A. L.,
Rocha Neto, J. S., Lima, A. M. N., 2008. A
Mathematical Model for the Strain–Temperature
Hysteresis of Shape Memory Alloy Actuators. In
Materials and Design, vol. 30, pp. 551-556.
NATIONAL INSTRUMENTS, 2010. MultiFunction DAQ
Accessories Datasheet.
Schmidt, R., 2014. Smart Structures - Modelling and
Simulation. 11th World Congress on Computational
Mechanics (WCCM2014). July 20 - 25, Barcelona,
Spain.
Suzuki, Y., Kagawa, Y., 2010. Active Vibration Control
of a Flexible Cantilever Beam Using Shape Memory
Alloy Actuators. Smart Materials and Structures.
AnalysisandModelingofaPlatformwithCantileverBeamusingSMAActuator-ExperimentalTestsbasedonComputer
SupportedEducation
243
