
Analysing Online Education-based Asynchronous Communication Tools
to Detect Students’ Roles
Mohammad Jaber
1
, Panagiotis Papapetrou
2
, Ana Gonz
´
alez-Marcos
3
and Peter T. Wood
1
1
Department of Comp. Sci. and Info. Systems, Birkbeck, University of London, London, U.K.
2
Department of Computer and Systems Sciences, Stockholm University, Stockholm, Sweden
3
Department of Mechanical Engineering, Universidad de La Rioja, La Rioja, Spain
Keywords:
Project Management, Asynchronous Communication, Educational Data Mining, Social Network Analysis.
Abstract:
This paper studies the application of Educational Data Mining to examine the online communication behaviour
of students working together on the same project in order to identify the different roles played by the students.
Analysis was carried out using real data from students’ participation in project communication tools. Several
sets of features including individual attributes and information about the interactions between the project
members were used to train different classification algorithms. The results show that considering the individual
attributes of students provided regular classification performance. The inclusion of information about the
reply relationships among the project members generally improved mapping students to their roles. However,
“time-based” features were necessary to achieve the best classification results, which showed both precision
and recall of over 95% for a number of algorithms. Most of these “time-based” features coincided with the
first weeks of the experience, which indicates the importance of initial interactions between project members.
1 INTRODUCTION
The teaching of Project Management traditionally fol-
lowed a paradigm of knowledge transmission rather
than knowledge creation. In such environments,
courses are usually organised along teacher-centered
approaches in which the students act as passive recep-
tacles. However, within a changing European higher
education landscape, the teaching process must be
organised in a more learner-centered approach than
classical lectures offer.
Since project management is inherently an experi-
ential form of learning, the learning process requires
an environment where students can act as project
managers executing a project. A practical approach
that is specifically designed to facilitate the learn-
ing of project management for engineering students is
presented in (Alba-El
´
ıas et al., 2014). The proposed
framework is tailored to the “Project-Based Learning”
(PjBL) method and uses the Project Management In-
stitute (PMI) standard (PMI, 2008) as the methodol-
ogy to be learned and applied by students. Despite the
usefulness of this framework in promoting the learn-
ing of project management among geographically-
dispersed students, the authors in (Alba-El
´
ıas et al.,
2013) found that concentrating on the products to be
developed, instead of a methodology that requires a
great deal of effort, is of most help to the learning
process. Thus, they propose a shift towards a more
product-oriented methodology, such as PRINCE2
TM
(Projects IN a Controlled Environment) (OGC, 2009).
Furthermore, a PRINCE2
TM
project has an explicit
project management team structure consisting of de-
fined and agreed roles — not jobs — and responsi-
bilities for the people involved in the project (OGC,
2009). This project structure facilitates the students’
learning process because it clarifies the differences
between the different roles of persons who work to-
gether on the same project, but with very different re-
sponsibilities.
A project team can be seen as a social group where
team members are involved in social interactions with
each other, share interests and have the common goal
of completing the project. Thus, based on the learning
framework presented in (Alba-El
´
ıas et al., 2013), the
overall objective of this study is to examine the rela-
tionships between students through their online asyn-
chronous conversations (discussion posts and blogs).
More specifically, this work analyses the capability
of Educational Data Mining (EDM) to identify pat-
terns of interaction between students that are directly
related to their position in the project:
416
Jaber M., Papapetrou P., González-Marcos A. and Wood P..
Analysing Online Education-based Asynchronous Communication Tools to Detect Students’ Roles.
DOI: 10.5220/0005445604160424
In Proceedings of the 7th International Conference on Computer Supported Education (CSEDU-2015), pages 416-424
ISBN: 978-989-758-108-3
Copyright
c
2015 SCITEPRESS (Science and Technology Publications, Lda.)

• EX: Executive. This role is charged with effec-
tive management of the project. Each project is
managed by a team of three to five EXs.
• PM: Project Manager. On behalf of the EX, the
PMs have the authority to run the project on a day-
to-day basis. Each project is managed by a team
of ten to twelve PMs.
• TM: Team member, with engineering tasks de-
velopment responsibilities. Each project is com-
posed of seven to eleven TMs.
The number of students playing each role was de-
termined by both the necessity to satisfy the objec-
tives of the different curricula of each degree and
the total number of students involved in the learn-
ing experience. Thus, M.Sc. students are more ori-
ented to project management (EX, PM) and B.Sc. stu-
dents are more focused to the technological aspects
of the project (TM). However, the flexibility of the
PRINCE2
TM
methodology allows for allocating roles
with different numbers of participants. Moreover,
this project structure could be applied to all types
of projects without any modification. The generic
nature of the PRINCE2
TM
organisational structure
might suggest that the conclusions of this work could
be applied to any type of project.
The structure of the remainder of the paper is as
follows: Section 2 presents a brief review of related
work. Section 3 provides an overview of the prob-
lem setting. Section 4 is dedicated to presenting the
approach proposed to identify the project team struc-
ture. Section 5 presents the results and discusses the
main findings of the study. Finally, Section 6 presents
general conclusions and discusses future work.
2 RELATED WORK
The EDM process converts raw data from educational
systems into useful information that could have a sig-
nificant impact on educational research and practice.
This process does not differ much from other areas
of application of Data Mining (DM), because it fol-
lows the same steps as the general DM process: pre-
processing, DM techniques (classification, clustering,
association-rule mining, sequential mining, and text
mining, as well as regression, correlation and visuali-
sation), and post-processing.
In this particular application of EDM, we are inter-
ested in identifying patterns that emerge from the on-
line interactions between students according to their
role in a project. This is valuable information because
patterns of interaction and connectivity can indicate
an evolving social structure within the project team.
Different studies have explored the learners’ so-
cial behaviour during computer-mediated commu-
nication (Choa et al., 2007; George and Leroux,
2002).Large-scale studies identified few significant
differences between asynchronous and synchronous
communication, which seem to be subtle and were
mainly found when conducting qualitative content
analyses in smaller groups (Hrastinski, 2008):
• Asynchronous communication was preferable
when the purpose was to discuss complex ideas.
• On the other hand, e-learners enjoyed syn-
chronous discussions because they were more so-
cial, though several studies found that participa-
tion was more concise and less deep.
This work is focused on asynchronous conversa-
tions because they tend to be better structured and de-
veloped than synchronous communication (Girasoli
and Hannafin, 2008) and they provide project mem-
bers time to examine and reflect on a topic before they
formalize their contribution or provide feedback re-
lated to a piece of performed work.
Traditional methods of data analysis usually con-
sider individual attributes from all observations in or-
der to analyze the information available. However,
although individual attributes are important, the in-
formation about the relations among the individu-
als within a social network is usually more relevant
to understand individual and group behaviour and/or
attitudes (Pinheiro, 2011). Social network analysis
(SNA) is a set of theories, models, and applications
that are expressed in terms of relational concepts and
processes.
One of the key applications in SNA is to identify
the most important or central nodes in the network.
The measure of centrality is thus used to give a rough
indication of the social power of a node based on
how well they connect the network (Chen and Yang,
2010). The two most famous representatives using
centrality for ranking (PageRank (Page et al., 1999)
and HITs (Hyperlink-Induced Topic Search) (Klein-
berg, 1999)) are used in this work in order to extract
information from the associations between students.
3 PROBLEM SETTING
The problem we wish to solve is as follows. We
are given a set of students V who have interacted
via a set of interactions I, through the use of
any of the following asynchronous communication
tools provided by the project portfolio management
(PPM) software used during the learning experience
(http://www.project.net) :
AnalysingOnlineEducation-basedAsynchronousCommunicationToolstoDetectStudents'Roles
417

• Blogs. Blog posts can be created either globally
for the project or tied to specific tasks, keeping
a complete record of activity associated with that
item easily accessible. Thus, blogs allow to:
– Record recent activities or completed work and
general comments.
– View a log of all work activity for a project.
– Facilitate two-way communication between
management and team members.
• Discussion groups. Project members can establish
threaded discussions. In this experience, discus-
sion posts were also used to inform those project
members responsible for a deliverable that the re-
quested work had been done. Thus, the person
responsible for that deliverable replied in order to
provide feedback to the performed work in a pos-
itive (acceptance) or negative (request changes)
way. In summary, a project member can:
– Hold discussions around specific deliver-
ables/documents.
– Track who has viewed each message.
From these interactions we derive a number of
features. These features might be simple, such as the
total number of messages posted by each student, or
more complex, such as the page-rank score of each
student derived from a graph representing I. Given
this information as input, we want to find a way to
infer the different roles students play in the project
conversations. For example, in a discussion post, one
role might be project manager, while another might
be team member. Input to the method includes the
number of roles; the output should be a classification
of each student to a role.
We represent the input to the role-inference prob-
lem by the model M = (V, R, I, F, M
F
) where:
• V = {v
1
, . . . , v
n
} is the set of n students participat-
ing in the communication tools. We sometimes
refer to individual students as u and v.
• R = {R
1
, . . . , R
m
} is the set of m possible roles
played by the students.
• I is the set of messages students submitted
through the communication tools. Each message
is represented by a tuple (s, time, type, r), where
s ∈ V is the sender of the message, time is the
message timestamp, and type is the message type
which takes its value from a known finite set of
types. If the message is not a reply to a previous
message, then r is zero; otherwise, r is the stu-
dent who sent or posted the message to which the
current message is a reply.
• F = { f
1
, f
2
, . . . , f
k
} is a set of k features derived
from I.
• M
F
is an n × k matrix mapping students to their
feature values. For example, M
F
(1, 2) = 10
means that the first student has value 10 for the
second feature.
Given the above model M as input, we want to
infer the n-dimensional vector M
R
which maps each
student to his or her role in the conversation. For ex-
ample, M
R
(3) = 2 would mean that the third student
has role 2.
4 PROPOSED APPROACH
The approach we used to detect the students’ roles
from the online communication tools consists of four
stages as shown in Figure 1. Firstly, we collected the
message data we used to test our approach. Then,
we pre-processed the collected data to transform it
into the format needed for building the classification
model. Next, different data mining approaches (su-
pervised learning) were applied to build the models
which classify the students according to their roles.
In this stage, all models were trained using different
groups of features. Here, we applied a number of
feature-selection algorithms to find the best features
to be selected. Finally, the results of detecting stu-
dents roles using the obtained models were compared
according to recall, precision and F-measure.
4.1 Collecting Data
The dataset we used is from online asynchronous
communication tools belonging to Universidad de la
Rioja and Universidad Polit
´
ecnica de Madrid. These
tools are based on the PPM software used to support
the learning experience and are used as a tool for co-
ordinating groups of students in order to accomplish
and complete the projects they are working on. We
gathered the usage data for 141 students organised in
6 different projects. In each project, there are about 25
students. All projects started in October and finished
at the end of December.
Three different roles could be played by the stu-
dents in the projects: students in Role-1 are executives
(EX), those in Role-2 are project managers (PM), and
those in Role-3 are team members (TM). The students
interact by submitting messages to the communica-
tion tools that can be read by all students involved
in the same project. Each interaction activity (send-
ing/viewing message) has a timestamp which indi-
cates when the interaction took place. The submitted
messages can be blogs or discussion posts (see section
3). Blogs and discussion posts and can be categorised
as follows:
CSEDU2015-7thInternationalConferenceonComputerSupportedEducation
418
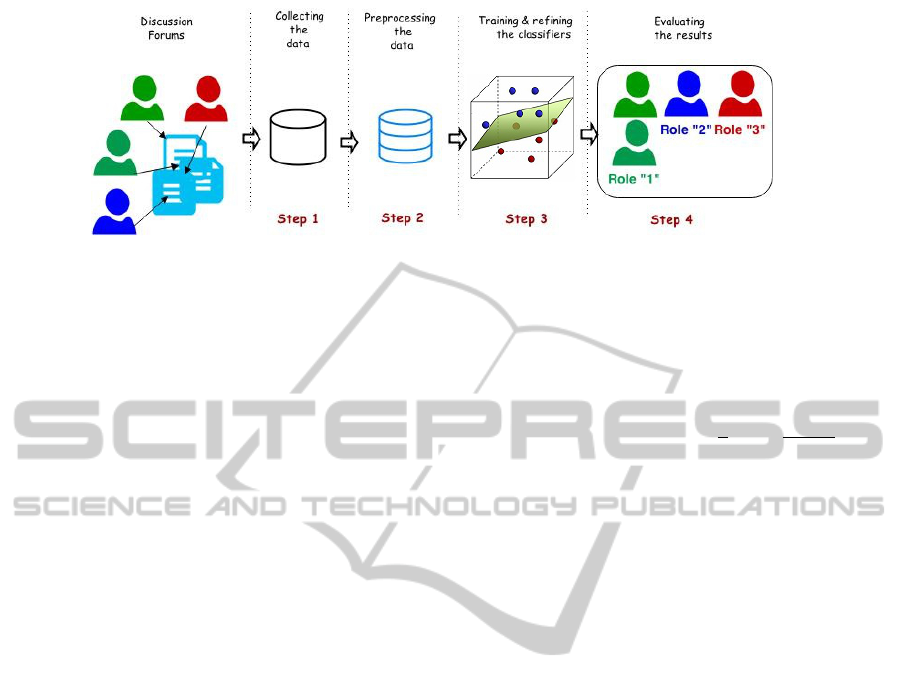
Figure 1: Processing stages.
• blog-1: blog entry related to reported work.
• blog-2: blog entry related to a task. This can be
used to ask something about the work to be done.
• blog-3: blog entry related to anything else.
• blog-4: reply to a blog entry.
• post-1: post entry.
• post-2: reply to a post.
In the case of post/blog reply, the message to which
the post/blog is replying, is known in the data. Table 1
lists the full statistics of the collected data.
4.2 Pre-processing Data
In this step, a set of features is generated for each stu-
dent. These features are used to train the classification
models. The generated features can be organised into
four different categories as described below.
4.2.1 Quantitative Features
These features are based on the statistical information
of student activities within the communication tools.
They include:
• total-sent: the total number of messages sent by
the student over the full period.
• total-viewed: the total number of messages
viewed by the student over the full period.
• total-blog1, total-blog2, total-blog3, total-blog4,
total-post1, and total-post2: These are the total
numbers of messages of different types sent by the
student over the full period.
4.2.2 Frequency-based Feature
We use a feature, which we call viewingCommitment,
to measure a student’s commitment in viewing the
messages sent by other students in their project. We
refer to this feature as “viewing” instead of “reading”
because we can be sure that a message has been dis-
played to the student but it is not possible to know if
the student has effectively read it. In spite of this un-
certainty, we think that this feature can provide useful
information about the students’ interest in the project.
This feature is defined as:
viewingCommitment(v) =
1
t
×
t
∑
d=1
S(v, d)
A(d)
where d is the day index, t is the total number of
project days, S(v, d) is the total number of messages
the student v has viewed from the first day up until
day d, and A(d) is the total number of messages that
have been viewed by at least one student in the project
from the first day until day d.
The motivation behind defining the function in
this way is that we want to measure the viewing activ-
ity of a student relative to the other students who are
working on the same project. A student v may view
a message only a few days after the same message
has been viewed by another student. The definition
penalises the student for each day of delay in which
the student defers viewing messages that have been
viewed previously by others. Defining the function
in this cumulative way captures the student’s viewing
pattern. Moreover, this definition avoids “division by
zero” when none of the students view any messages
on a particular day.
From the definition, viewingCommitment(v) ∈
[0, 1], where a higher score means that student v is
more active in viewing messages relative to other stu-
dents’ viewing activities.
4.2.3 Interaction-based Features
These features capture the interactions between stu-
dents who are working on the same project. Firstly,
we need to generate the reply-graph G
reply
(V
i
, E
i
),
where V
i
is the set of students who are working on
project i, and (v, u) ∈ E if u and v ∈ V and v replied
to one of u’s messages. Having built the reply-graph,
we run two known algorithms, PageRank (Page et al.,
1999) and HITs (Kleinberg, 1999), in order to gener-
ate the interaction-based features as follows:
AnalysingOnlineEducation-basedAsynchronousCommunicationToolstoDetectStudents'Roles
419

Table 1: Statistics about students and messages for each project.
Numbers of students Numbers of messages
Project Role-1 Role-2 Role-3 total blog-1 blog-2 blog-3 blog-4 post-1 post-2 total
1 3 12 11 26 641 18 39 92 57 374 1227
2 3 11 10 24 475 49 87 54 35 509 1209
3 3 11 10 24 401 43 97 39 54 741 1375
4 4 10 8 22 484 32 223 259 68 580 1646
5 4 10 9 23 426 9 190 182 38 746 1591
6 5 10 7 22 440 59 34 72 42 669 1316
All 22 64 55 141 3399 254 1010 857 351 4372 10243
• PageRank-feature: this is the PageRank score that
the student achieved when we run PageRank on
the reply-graph.
• Authority-feature and Hub-feature: these are the
authority and hub scores that the student achieved
when we run HITs on the reply-graph.
4.2.4 Time-based Features
These features capture the dynamics of the quanti-
tative features and how they change over the time.
We divided the project period into n equal time-slots,
and experimented with different numbers of time-
slots (n = 5, 10, 20, 25). In this paper we only report
the best results which were obtained for n = 20. In
this case, each time-slot represents about 3 days of the
project period. For each time slot, we calculate the to-
tal number of messages sent by each student for each
message type individually and for all types together.
The result of this process is 140 time-based features
(7 features over 20 time-slots). Each of these features
relates to one time-slot. For example, total-sent(3)
is the total number of messages sent by the student
within the third time-slot. Similarly, total-blog2(5) is
the total number of type “blog2” messages sent within
the fifth slot by the student.
4.3 Training and Refining the
Classifiers
The aim of this step is to build a classification model
that is able to detect each student’s role from their on-
line activities. We used different classification algo-
rithms that belong to different categories, based on
those available in Weka (Witten et al., 2011):
• Bayes-based Algorithms are probabilistic clas-
sifiers based on Bayes theorem. We tried both
“Bayes Net”, which uses a Bayes Network classi-
fier like K2 and B (Bouckaert, 2007), and “Naive-
Bayes”, which uses a simple Naive Bayes classi-
fier in which numeric attributes are modelled by a
normal distribution (Duda et al., 2000).
• Function-based Algorithms try to fit a function
to the data. “Logistic” builds and uses a multi-
nomial logistic regression model with a ridge es-
timator (le Cessie and van Houwelingen, 1992).
“MultilayerPerceptron” uses a back-propagation
network to classify instances (Ruck et al., 1990).
“RBFNetwork” implements a normalised Gaus-
sian radial basis function network (Park and Sand-
berg, 1991). “SMO” implements a specific se-
quential minimal optimisation algorithm for train-
ing a support vector classifier (Platt, 1998).
• Rules-based Algorithms learn classification
rules. DTNB builds a decision table/naive Bayes
hybrid classifier (Hall and Frank, 2008). JRip
implements a propositional rule learner as an
optimised version of the IREP algorithm (Co-
hen, 1995). NNge is a nearest-neighbour-like al-
gorithm using non-nested generalised exemplars
which are hyperrectangles that can be viewed as
rules (Martin, 1995). Ridor is the implementa-
tion of a Ripple-Down Rule learner (Gaines and
Compton, 1995).
• Tree-based Algorithms build decision trees.
BFTree uses binary split for both nominal and nu-
meric attributes (Friedman et al., 2000). J48 is
an optimized version of C4.5 decision tree (Quin-
lan, 1993). LADTree generates a multiclass al-
ternating decision tree using the LogitBoost strat-
egy (Holmes et al., 2001). RandomForest con-
structs random forests based on Breiman’s algo-
rithm (Breiman, 2001).
In order to find the best classification model, we
considered different groups of features in building the
models. For each group of features explained be-
low, we trained all the aforementioned algorithms and
compared their results with the results obtained by us-
ing the other groups. The following three sets of fea-
tures were used to train the classification models:
• Basic Set: This set represents the basic features
relating to student activities: (1) total-sent, (2)
total-viewed and (3) viewingCommitment.
• Basic
+
Set: In addition to the features included
CSEDU2015-7thInternationalConferenceonComputerSupportedEducation
420
in the Basic set, this set includes the features re-
lated to each message type, i.e. total-blog1, total-
blog2, total-blog3, total-blog4, total-post1, and
total-post2. Moreover, the three interaction-based
features, i.e. PageRank-feature, authority-feature
and hub-feature, were also included.
• Filtered Set: As the time-based features and the
“Basic
+
” features consist of a large number of
features (152 features), it is likely that not all
these features are relevant for detecting students’
roles. If we use all features, some of these
features may cause noise in the results. We used
a subset of features by filtering out the ones that
are not discriminative in detecting student roles.
In order to select the most relevant time-based
features, we applied an approach similar to that
used by (Yoo and Kim, 2012) and (Lopez et al.,
2012), using the following ten feature-selection
algorithms: CfsSubsetEval,ConsistencySubset-
Eval, ChiSquaredAttributeEval, SignificanceAt-
tributeEval, SymmetricalUncertAttributeEval,
GainRatio-AttributeEval, InfoGainAttributeEval,
OneRAttributeEval, ReliefFAttributeEval, and
SVMAttributeEval.
The first two algorithms return a subset of rele-
vant features. However, the remaining algorithms
return a ranked list of all features. In these cases,
we considered only the top 10 features returned.
The final set of features consists of those selected
by at least one algorithm, giving rise to 20 selected
features out of 152 possible features. The selected
features are shown in Tables 2 and 3.
4.4 Evaluating the Results
In order to evaluate the classification performance, we
use the three scores: precision, recall and F-measure.
First, we calculate these three scores for each role
individually. Then, the weighted average is used to
evaluate the overall results. This is computed by
weighting the measures of role (precision, recall, F-
Measure) by the proportion of students there are in
that role.
5 RESULTS AND ANALYSIS
All the experiments were run using the Weka
tool (Witten et al., 2011). In order to estimate how
accurately the obtained models work, we use 10-fold
cross validation in all executions. The model is built
by partitioning the dataset into 10 equal subsets. Then
each algorithm is executed 10 times. Each time, one
subset is used as the testing set, while the other 9 form
the training set. The final evaluation is based on the
mean of all runs. As we mentioned before, we ap-
plied several supervised algorithms to build the clas-
sification models for detecting students’ roles. For
each algorithm, we used three groups of features, as
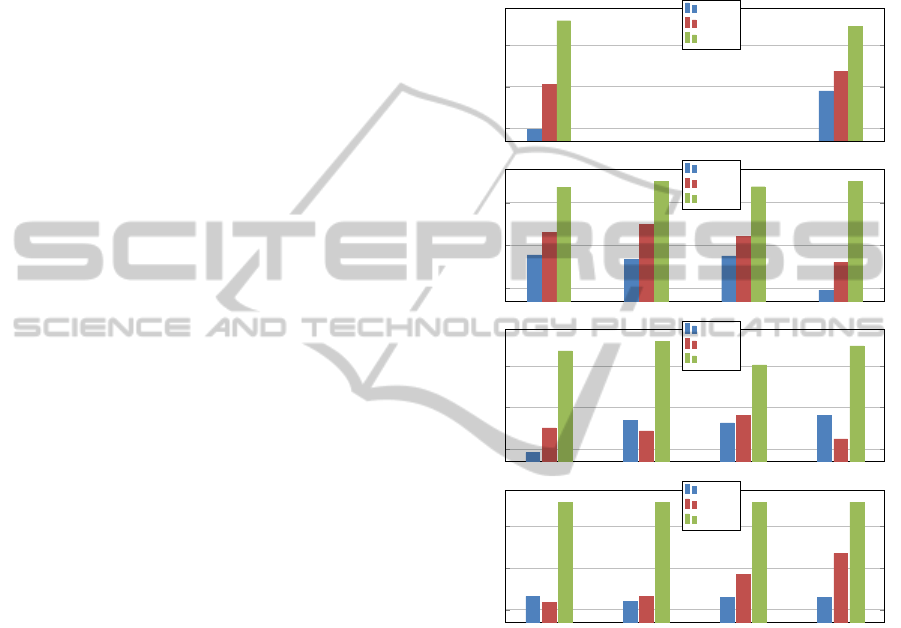
described in Section 4.3. Results are summarized in
Figure 2 where the F-measure scores are shown.
BayesNet
NaiveBayes
0.7
0.8
0.9
F-Measure
Basic
Basic
+
Filtered
Logistic
MLPerceptron
RBFNetwork SMO
0.7
0.8
0.9
F-Measure
Basic
Basic
+
Filtered
DTNB
JRip
NNge
Ridor
0.7
0.8
0.9
F-Measure
Basic
Basic
+
Filtered
BFTree
J48
LADTree
RandomForest
0.7
0.8
0.9
F-Measure
Basic
Basic
+
Filtered
Figure 2: F-measure scores for each classifier using the Ba-
sic, Basic
+
and Filtered sets of features.
For the “Basic” features, the best classification
was generated by the NaiveBayes algorithm. The re-
sults of all algorithms ranged between 0.69 and 0.8
for precision, recall and F-measure. On the other
hand, the results were better for all algorithms when
we used the “Basic
+
” group of features. This means
that including the “interaction-based” features as well
as the total count of each message type improves
the classification of roles. This is clear for all the
function-based algorithms particularly. For exam-
ple, the best model was built by MultilayerPerceptron
(MLPerceptron in Figure 2) which achieved around
0.85 for precision, recall and F-measure.
As mentioned previously, the complete set of fea-
tures includes a large number of features (152). In
order to reduce the number of features and remove
AnalysingOnlineEducation-basedAsynchronousCommunicationToolstoDetectStudents'Roles
421

Table 2: Frequency of appearance of time-based features using 10 feature-selection algorithms.
Type
Time-slots
1 2 3 4 5 6 7 8 9 10 11 12 13 14 15 16 17 18 19 20
blog-1 6 3 2 9 1 1
blog-2 1
blog-3
blog-4 1
post-1
post-2 2
All-types 2 7 8 1 9
Table 3: Frequency of appearance of Basic and Basic
+
features using 10 feature-selection algorithms.
Basic and Basic
+
Features
total total total total total total total total viewing PageRank Authority Hub
blog1 blog2 blog3 blog4 post1 post2 sent view commitment feature feature feature
6 5 9 7 9 6
irrelevant ones, we produced a “Filtered” set of fea-
tures by keeping only those selected within the top 10
features by at least one of the ten feature-selection al-
gorithms we used. In all algorithms, the performance
of the models trained by the “Filtered” set of features
was substantially superior to those obtained using the
“Basic” or “Basic
+
” sets. For example, the SMO
algorithm achieved an F-measure of 0.95 compared
to only 0.69 and 0.76 obtained for the “Basic” and
“Basic
+
” sets respectively.
In general, in 13 out of the 14 algorithms the
achieved F-measure was above 0.93 for the “Filtered”
set. The best F-measure obtained using the “Filtered”
set was 0.958 for each of BayesNet, JRip and all
Tree-based models.
Main Findings
As expected, individual attributes (“Basic” features)
were partially useful to correctly classify the students’
roles in the project. Quantitative and frequency-based
features alone do not provide a complete picture of
the interactions between project members.
On the other hand, although the information cap-
tured from the social network analysis (“interaction-
based” features) generally improved mapping stu-
dents to their roles, the use of “time-based” features
was crucial to correctly identify students’ roles. It
must be noted that the complete set of these “time-
based” features was not necessary to achieve good
classification performances: by using the top 10% of
the “time-based” features — 14 variables — it was
possible to achieve an F-measure above 0.95. Further-
more, most of the selected “time-based” features co-
incide with the first weeks of working on the project,
which indicates the importance of initial interactions
between project members.
The good classification results illustrate that most
students act as expected according to the roles that
are initially given for the project. Asynchronous con-
versations have proven to be useful in identifying the
project roles defined in PRINCE2
TM
.
6 CONCLUSIONS
This paper has presented an application of EDM to the
detection of students’ roles in a project according to
their use of online communication tools (discussion
posts and blogs). The analysed data included indi-
vidual attributes related to messages sent and viewed,
as well as information about the interactions between
the project members provided by two social network
analysis measures (PageRank (Page et al., 1999) and
HITs (Kleinberg, 1999)).
Based on the results obtained using several sets of
features and classification algorithms, it is possible to
confirm the usefulness of EDM to analyze the online
interactions between students working together in a
project. Moreover, it has been shown that consider-
ing information about the reply relations among the
project members is more relevant than the individual
attributes of students. Another interesting result is the
selection of “time-based” features as relevant to iden-
tify the students’ roles. Taking into account that most
of these features coincide with the first weeks of the
experience, it seems that students are able to act ac-
cording to their assigned PRINCE2
TM
role since the
beginning of the project.
It must be noted that despite the formal project
organisation, different roles could emerge during
project activities. Thus, certain team members (TM)
could emerge informally as leaders and act as infor-
CSEDU2015-7thInternationalConferenceonComputerSupportedEducation
422

mal project managers (PM) in the day-to-day activi-
ties. Although the analysis of these project team dy-
namics have not been the main goal of the present
work, the authors are considering the idea of de-
termining the social behavioural profiles of project
members beyond their formal given roles.
For the future, the authors plan to validate the ob-
tained results using different datasets. They also in-
tend to use the communication data of the projects in
order to try to predict the final marks of students. Fi-
nally, it would be interesting to analyse message con-
tent as a way to improve the prediction of team mem-
ber roles.
ACKNOWLEDGEMENTS
The authors wish to recognise the financial support
of the “Vicerrectorado de Profesorado, Planificaci
´
on
e Innovaci
´
on Docente” of the University of La Rioja,
through the “Direcci
´
on Acadmica de Formaci
´
on e In-
novaci
´
on Docente” (APIDUR 2014).
REFERENCES
Alba-El
´
ıas, F., Gonz
´
alez-Marcos, A., and Ordieres-Mer
´
e,
J. (2013). An ict based project management learning
framework. In EUROCON, 2013 IEEE, pages 300–
306.
Alba-El
´
ıas, F., Gonz
´
alez-Marcos, A., and Ordieres-Mer
´
e, J.
(2014). An active project management framework for
professional skills development. International Jour-
nal of Engineering Education, 30(5):1242–1253.
Bouckaert, R. (2007). Bayesian Network Classifiers in
Weka for Version 3-5-6. The University of Waikato.
Breiman, L. (2001). Random forests. Machine Learning,
45(1):5–32.
Chen, I.-X. and Yang, C.-Z. (2010). Handbook of So-
cial Network Technologies and Applications, chap-
ter Visualization of Social Networks, pages 585–610.
Springer, Florida, USA.
Choa, H., Gayb, G., Davidsonc, B., and Ingraffe, A. (2007).
Social networks, communication styles, and learning
performance in a cscl community. Computers & Edu-
cation, 49(2):309–329.
Cohen, W. W. (1995). Fast effective rule induction. In
Twelfth International Conference on Machine Learn-
ing, pages 115–123. Morgan Kaufmann.
Duda, R. O., Hart, P. E., and Stork, D. G. (2000). Pattern
Classification. Wiley Interscience, 2 edition.
Friedman, J., Hastie, T., and Tibshirani, R. (2000). Addi-
tive logistic regression : A statistical view of boosting.
Annals of statistics, 28(2):337–407.
Gaines, B. and Compton, P. (1995). Induction of ripple-
down rules applied to modeling large databases. Jour-
nal of Intelligent Information Systems, 5(3):211–228.
George, S. and Leroux, P. (2002). An approach to automatic
analysis of learners’ social behavior during computer-
mediated synchronous conversations. In Cerri, S.,
Gouard
`
eres, G., and Paraguau, F., editors, Intelligent
Tutoring Systems, volume 2363 of Lecture Notes in
Computer Science, pages 630–640. Springer Berlin
Heidelberg.
Girasoli, A. J. and Hannafin, R. D. (2008). Using
asynchronous av communication tools to increase
academic self-efficacy. Computers & Education,
51(4):1676–1682.
Hall, M. and Frank, E. (2008). Combining naive bayes and
decision tables. In Proceedings of the 21st Florida
Artificial Intelligence Society Conference (FLAIRS),
pages 318–319. AAAI press.
Holmes, G., Pfahringer, B., Kirkby, R., Frank, E., and Hall,
M. (2001). Multiclass alternating decision trees. In
ECML, pages 161–172. Springer.
Hrastinski, S. (2008). The potential of synchronous com-
munication to enhance participation in online discus-
sions: A case study of two e-learning courses. Infor-
mation & Management, 45(7):499–506.
Kleinberg, J. M. (1999). Authoritative sources in a hyper-
linked environment. Journal of the ACM, 46(5):604–
632.
le Cessie, S. and van Houwelingen, J. (1992). Ridge es-
timators in logistic regression. Applied Statistics,
41(1):191–201.
Lopez, M. I., Romero, C., Ventura, S., and Luna, J. M.
(2012). Classification via clustering for predicting fi-
nal marks starting from the student participation in fo-
rums. In EDM’12, pages 148–151.
Martin, B. (1995). Instance-based learning : Nearest neigh-
bor with generalization. Technical report, University
of Waikato.
OGC (2009). Managing Successful Projects with
PRINCE2
TM
. Office Of Government Commerce.
Page, L., Brin, S., Motwani, R., and Winograd, T. (1999).
The pagerank citation ranking: Bringing order to the
web. Technical Report 1999-66, Stanford InfoLab.
Park, J. and Sandberg, I. W. (1991). Universal approxi-
mation using radial-basis-function networks. Neural
Comput., 3(2):246–257.
Pinheiro, C. A. R. (2011). Social Network Analysis in
Telecommunications. John Wiley & Sons, Hoboken,
New Jersey.
Platt, J. C. (1998). Fast training of support vector machines
using sequential minimal optimization. In Advances
in Kernel Methods - Support Vector Learning. MIT
Press.
PMI (2008). A Guide to the Project Management Body
of Knowledge (PMBOK Guide). Project Management
Institute, Newtown Square, PA, USA, 4th edition.
Quinlan, R. (1993). C4.5: Programs for Machine Learning.
Morgan Kaufmann Publishers, San Mateo, CA.
Ruck, D. W., Rogers, S. K., Kabrisky, M., Oxley, M. E.,
and Suter, B. W. (1990). The multilayer perceptron
as an approximation to a Bayes optimal discriminant
function. IEEE Transactions on Neural Networks,
1(4):296–298.
AnalysingOnlineEducation-basedAsynchronousCommunicationToolstoDetectStudents'Roles
423

Witten, I. H., Frank, E., and Hall, M. A. (2011). Data
Mining: Practical Machine Learning Tools and Tech-
niques. Morgan Kaufmann Publishers Inc., San Fran-
cisco, CA, USA, 3rd edition.
Yoo, J. and Kim, J. (2012). Predicting learners project per-
formance with dialogue features in online q&a discus-
sions. In Intelligent Tutoring Systems, volume 7315 of
Lecture Notes in Computer Science, pages 570–575.
Springer Berlin Heidelberg.
CSEDU2015-7thInternationalConferenceonComputerSupportedEducation
424
