
Power Theft Detection in Microgrids
Aryadevi Remanidevi Devidas and Maneesha Vinodini Ramesh
Amrita Center for Wireless Networks & Applications, AMRITA Vishwa Vidyapeetham (Amrita University), Kerala, India
Keywords: Electrical Grid, Micro-grid, Power Theft, Wireless Networks.
Abstract: Theft of electricity amounts to 1.5% GDP, of most of the developing nations like India. Hence there is a
great need to detect power thefts in developing nations. In this paper, we have proposed a wireless network
based infrastructure for power theft detection which caters to other functional requirements of the microgrid
such as renewable energy integration, automatic meter reading etc. Algorithm for power theft detection
(PTDA) which is proposed in this paper, works in the distributed intelligent devices of the microgrid
infrastructure for power theft detection. The coordinated action of intelligent devices with PTDA in the
microgrid infrastructure enables not only the detection of power theft, but the localization of power theft in
the micro-grid. PTDA increases the 1) cost of communication 2) energy consumption of intelligent devices
3) packet latency, if any critical data is piggy backed with power theft data in micro-grid. To solve these
issues, we have proposed EPTDNA (Efficient Power Theft Data Networking Algorithm) which uses the
frequency of power theft detection and average power draw for power theft, for the efficient routing of
power theft. The performance analysis and results given in this paper shows how EPTDNA solves the major
issues with PTDA.
1 INTRODUCTION
Smart Grid is the new generation electric grid
technology whose pivotal network is a wireless
network (Amin and Wollenberg, 2005). Microgrids
are small smart power grids, which is a part of smart
distribution grid, that can operate in islanded mode
or in grid-connected mode. The existing grid system
in developing nations is suffering due to a lot of
problems which affects the country’s economic
growth, one of which is power theft (Farhangi,
2010). The microgrid technology solves all these
problems to some extent. The features of microgrid
include, distributed generation of electricity,
integration of renewable energy source, power theft
detection, line fault detection, self-healing, advanced
metering infrastructure, and automated billing and
controlling (Hartono, Budiyanto and Setiabudy,
2013). The research paper (Myoung, Kim and Lee,
2010) introduces KEPCO's field area network
(FAN) architecture and research for smart
distribution automation system (DAS) and advanced
metering infrastructure (AMI). However, the current
research work in the smart grid or microgrid area
does not fully support real-time, reliable
communications and necessary smart grid services.
Power theft is considered as a bane of the power
grid in most of the developing nations. Nearly, 30%
of the generated electricity has not been billed in
these nations because of the power theft losses and
transmission losses. Hence there is an urgent need
from the utility side to detect and locate the power
theft. In this paper, we have proposed a wireless
based microgrid infrastructure for power theft
detection. The power theft detection algorithms
(PTDA) inside the intelligent devices in the
microgrid infrastructure detect and localize the
power theft in the grid. In PTDA, the messages
regarding the current draw or injection at each
intelligent device are transmitted to next nearby
node very often. This introduces three issues
namely, 1) cost of communication increases with
increase in number of message transfer, if the
communication module is not using ISM band, 2)
even if, SMs and SDNs are low powered devices,
full time switch on of these devices may contribute
to the un-sustainability of the microgrid in terms of
energy, since they are powered by micro-grid, 3) if
the energy consumption data from the consumers are
piggy backed with the multi-hop current flow data
for power theft detection, then it may introduce large
latency and will affect the billing process. To solve
342
Remanidevi Devidas A. and Vinodini Ramesh M..
Power Theft Detection in Microgrids.
DOI: 10.5220/0005446703420349
In Proceedings of the 4th International Conference on Smart Cities and Green ICT Systems (SMARTGREENS-2015), pages 342-349
ISBN: 978-989-758-105-2
Copyright
c
2015 SCITEPRESS (Science and Technology Publications, Lda.)

these issues we have proposed an algorithm called
Efficient Power Theft Data Networking Algorithm
(EPTDNA) which works with PTDA.
The major contributions of this research paper
are:
1. Microgrid infrastructure for power theft
detection which caters to other functional
requirements of micro-grid.
2. Power theft detection algorithm (PTDA)
which uses Kirchhoff’s Current Law (KCL), for the
detection and localization of power theft.
3. Efficient Power Theft Data Networking
Algorithm (EPTDNA) for efficient routing of power
theft data, which solves three issues of PTDA.
The rest of the paper is organized as follows:
Section 2 discusses the related works and Section 3
gives a wireless networks based microgrid
infrastructure for power theft detection. Section 4
describes the power theft detection algorithm
(PTDA). Section 5 describes the problems of PTDA
and Efficient Power Theft Data Networking
Algorithm (EPTDNA) which solves the issues of
PTDA. Section 6 describes the performance
evaluation and results which shows how EPTDNA
solves the issues with PTDA which follows
conclusion in section 7.
2 RELATED WORKS
In most of the developing nations power theft is
happened by drawing power from the overhead grid
lines which are bare conductors. Usually, the
unauthorized consumers who are committing the
theft may not have a smart meter associated to them.
Most of the research papers addressed the power
theft committed by several cyber attacks.
The reference publication (Mashima and
Cardenas, 2012), the authors proposes the first threat
model for the use of data analytics, to detect the
anomalies of the data received from advanced
metering infrastructure. The reference paper
(Nikovski, Wang, Esenther, Sun, Sugiura, Muso and
Tsuru, 2013) proposes a method for power theft
detection based on the data collected by the smart
meters in the smart grid. They used predictive
models for calculating the technical losses in
electrical distribution networks and used these
models for power theft detection. The dissertation
(Depru, 2012) presents an encoding and
classification scheme that simplifies the energy
consumption pattern and maps them to the
corresponding irregularities in the consumption. The
reference paper (Devidas and Ramesh, 2010)
describes the method for detection and localization
of power theft in smart grids. But it has not
considered the bidirectional electricity flow in
microgrids. In this paper, we have proposed
algorithms for power theft detection in micro-grids
and for efficient routing of power theft data.
The research papers (Salinas, Li and Li, 2012),
(Weckx, Gonzalez, Tant, Rybel, Driesen, 2012) and
(McLaughlin, Holbert, Zonouz and Berthier, 2012)
deals with the power theft created due to several
cyber attacks. Solving of power theft by placing
intelligent devices throughout the power grid and by
computerised billing systems is explained in the
reference paper (Amarnath, Kalaivani and Priyanka,
2013). It deals with the power theft due to smart
meter tampering whereas our work deals with the
power theft due to distribution line tampering, the
kind of power theft that experiencing in developing
nations.
3 MICROGRID
INFRASTRUCTURE FOR
POWER THEFT DETECTION
Figure 1: Microgrid infrastructure for power theft
detection.
Microgrid infrastructure for power theft detection
involves power grid and an overlay communication
network. The detection of power theft is possible by
integrating intelligent communication agents at
different locations of the power grid. For power theft
detection intelligent communication infrastructure
are placed near all consumers and also on top of
each and every pole. Such a microgrid is shown in
the figure 1. Point of Common Coupling (PCC) is
the point in the power grid at which the microgrid is
PowerTheftDetectioninMicrogrids
343
connected to the main grid.
The intelligent devices near the consumers are
called Smart Meters (SMs), the intelligent devices
on top of all the poles are called Smart Distribution
Nodes (SDNs) and the intelligent devices associated
to the renewable energy sources are called
Renewable Energy Intelligent Device (REID).
Microgrid Control Station (MCS) is the main control
station of the micro-grid. SMs and SDNs measure
the current flow towards or away from each
consumer and distribution pole. SMs and SDNs have
the capability to send data to other SMs or SDNs or
MCS. These intelligent communication agents
consists of the current sensors for measuring
bidirectional current flow, microcontroller for
processing data and communication module for
sending the data to other intelligent agents. The
MCS controls all the intelligent agents and takes
care of the energy management inside the micro-
grid.
The communication technology used for the
transmission of data mainly depends on the
transmission range, data rate and transmission cost.
In India the maximum distance allowed between two
transmission line posts in a secondary distribution
grid is in the range of 40 to 50meters and the power
theft data is not a huge sized data. Hence the
recommended communication technologies for the
intelligent agents for power theft detection are
Zigbee or Wifi (Agarwal, Agarwal, Vyas and
Sharma, 2013) (Datar, 2008). Even though, these are
the recommended technologies for power theft
detection functionally of microgrid, depending on
other functionality of micro-grid, there can be a
change in the communication technologies used by
intelligent agents in the micro-grid.
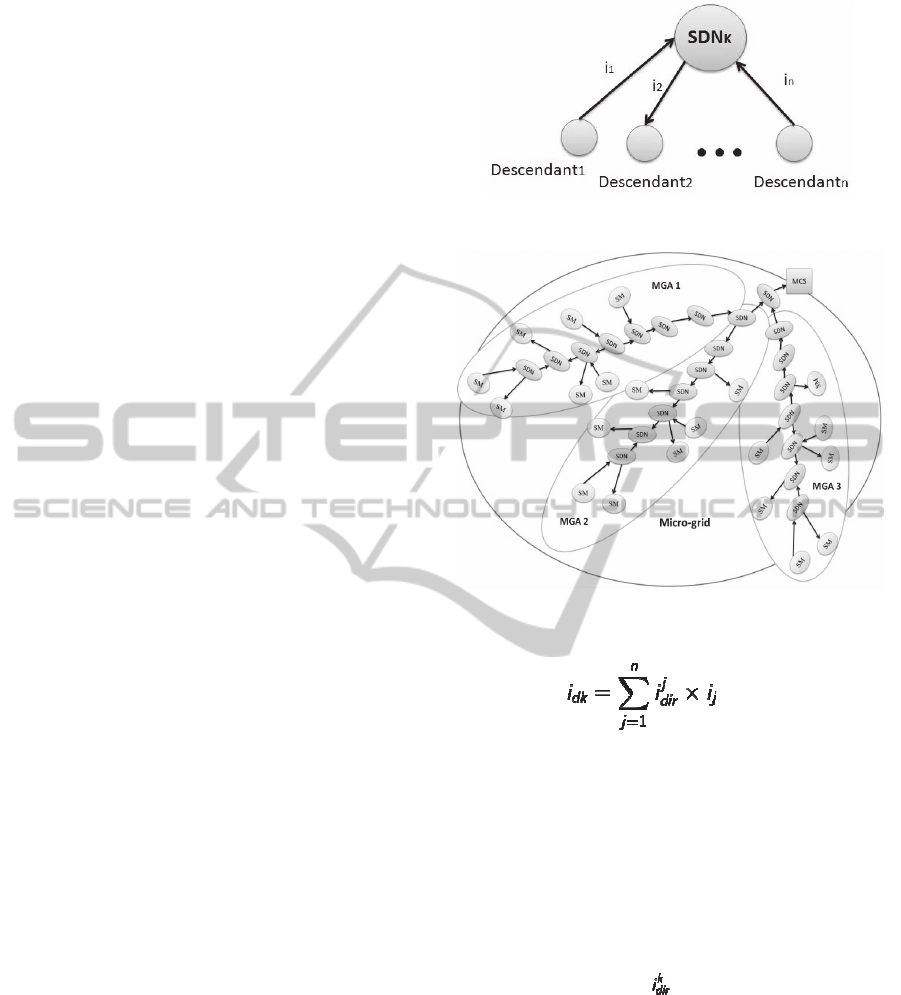
4 POWER THEFT DETECTION
ALGORITHM (PTDA)
The SMs and SDNs in the microgrid infrastructure
are responsible for the detection of power theft in a
microgrid. Assume ‘SDN
K
’ is the k
th
SDN in the
microgrid ‘M’. Let ‘n’ be the number of direct
descendants (SMs and SDNs) of ‘SDN
K
’ as shown in
figure 2(a). ‘SDN
K
’ measures the current flow
through it using Kirchhoff’s Current Law (KCL).
Let ‘i
k
’ be the measured current by ‘SDN
K
’.
‘SDN
K
’ will also receives the current values with
the direction information from all its descendants. It
will sum all the current values got from its
descendants. Let ‘i
dk
’ be the summation of
descendants current values.
Figure 2(a): ‘n’ descendants connected to the SDN ‘K’.
Figure 2(b): Tree-like topology of microgrid and MGAs
inside the micro-grid.
(1)
If i
k
≠i
dk
, then ‘SDN
K
’ decide a power theft has
occurred and send the power theft information to the
MCS. The Power Theft flag (PT
flag
) will set True or
False based on the detection of power theft in the
line segment between ‘SDN
K
’ and its descendants.
CP and PT represents data packets with current
value and the power theft values respectively. The
algorithm for detecting the power theft in ‘SDN
K
’ is
as follows:
1. Measure i
k
using KCL.
2. Send CPmsg{src
ID
, ,i
k
, time_stamp,dst
ID
}
to next intelligent device.
3. Wait(t<T
sec
) until
4. ReceiveCP
1
,CP
2
,...,CP
n
5. if(!ReceiveCP
1
,CP
2
,...,CP
n
&&t>T
sec
)
6. Discard the CP
1
,CP
2
,...,CP
n
7. After ‘m’ number of rejection of CPs,
8. Send message to MCS
9. Initiate communication network
reorganization
10. Go to step2.
11. end if
SMARTGREENS2015-4thInternationalConferenceonSmartCitiesandGreenICTSystems
344
12. else if((ReceiveCP
1
,CP
2
,...,CP
n
&&t<T
sec
)
13. Extract current values i
1
, i
2
….i
n
.
14. Insert sign according to the direction
information,
.
15. i
dk
=
16. Compare(i
k
, i
dk
).
17. if(i
k
==i
dk
-Tx
loss
Err
val
)
18. PT
flag
= false
19. end if
20. elseif(i
k
!= i
dk
-Tx
loss
Err
val
)
21. PT
flag
= true
22. Send PTmsg{src
ID
,i
dir
,i
PT
, PT
flag
= true,
time_stamp,mcs
ID
} to MCS.
23. end if
24. end if
The SDN measures the current flow through it
and wait T
sec
until it receives the current values of its
‘n’ descendants. If the current values from all ‘n’ are
not received till the time T
sec
, then the SDN discards
all the values and measures again the current value.
After certain number of such rejection of data, SDN
realizes a failure in the communication link or in the
descendant node. Then SDN will either initiate
reorganization of communication network or send a
message to MCS regarding the issue. When the
electric current travels through the distribution line,
it experiences some loss due to heat which is termed
as copper loss. The Tx
loss
represents this copper loss.
The current value that receives can be erroneous due
to electromagnetic interference. The maximum
allowed error is
Err
val
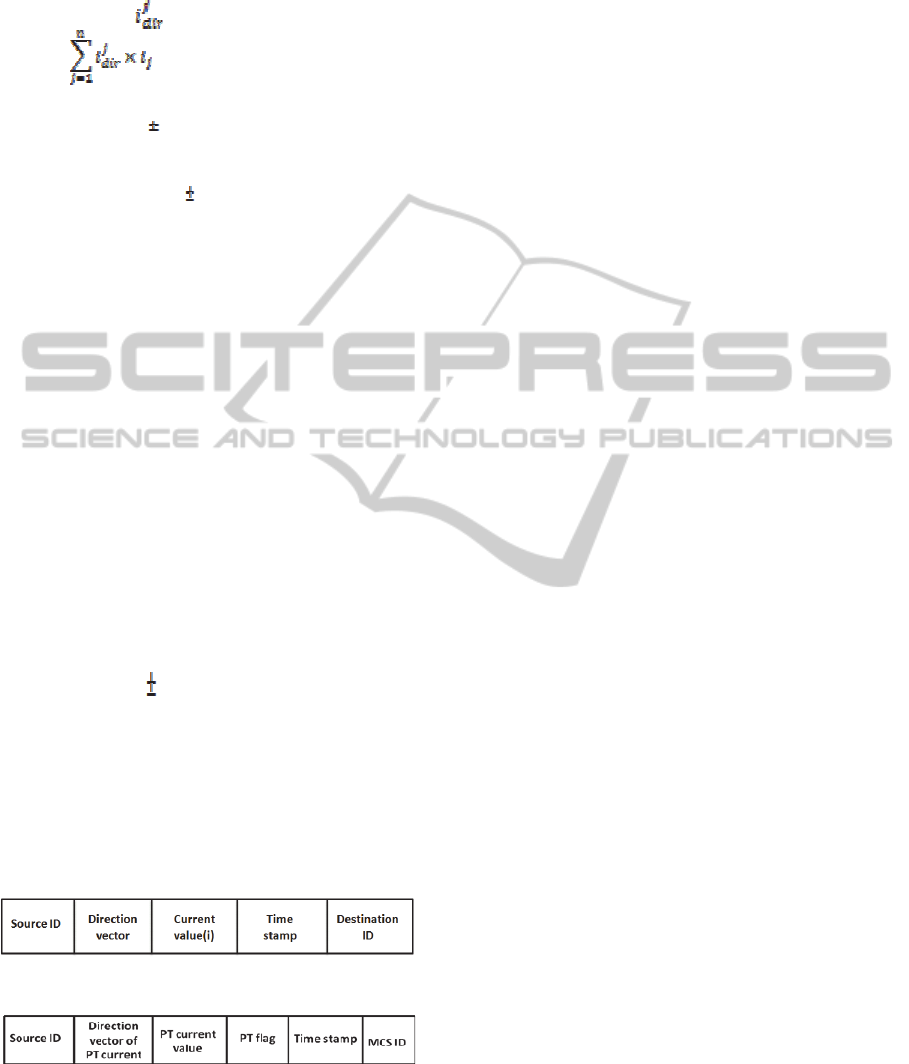
. CP is the current data
packet which contains the source ID, direction
vector, current value, time stamp and destination ID.
PT is the power theft data packet which contains
source ID, direction vector of power theft current
(i
dir
), power theft current value (i
PT
), power theft
flag, time stamp and the ID of MCS. The packet
structures of CP and PT messages are shown in
figure 3(a) and figure 3(b).
Figure 3(a): Structure of current packet.
Figure 3(b): Structure of power theft packet.
5 EFFICIENT NETWORKING OF
POWER THEFT DATA
In the power theft detection method (PTDA)
described in section 4, the messages regarding the
current draw or injection at each node are
transmitted to next nearby node very often. This
introduces three issues namely, 1) cost of
communication increases with increase in number of
message transfer, if the communication module is
not using ISM band (Baker, King and Welch, 2004),
2) even if, SMs and SDNs are low powered devices,
full time switch on of these devices may contribute
to the un-sustainability of the microgrid in terms of
energy, since they are powered by microgrid, 3) if
the energy consumption data from the consumers are
piggy backed with the multi-hop current flow data
for power theft detection, then it may introduce large
latency and will affect the billing process. To solve
these issues two questions need to be answered,
a) How often we need to check for power theft
inside a microgrid?
b) How to determine whether the data has to hop
through each and every intelligent device?
We propose an algorithm called Efficient Power
Theft Data Networking Algorithm (EPTDNA)
which works with PTDA to solve the above
mentioned issues.
For the efficient networking, assume the
microgrid has a tree-like topology as shown in figure
2(b), in which SMs and SDN are considered as
nodes in the topology. The independent sub-
branches of the microgrid tree are identified as
different Microgrid Areas (MGAs) such as
Frequently Identified MGA (FMGA), Occasionally
Identified MGA (OMGA) and Extremely Unlikely
Identified MGA (EUMGA) based on the full load in
the sub-branches, total generation capacity in the
sub-branches and the geographical terrain as shown
in figure 2(b). The Microgrid Controlling Station
(MCS) will find out the critical microgrid areas from
the identified MGAs based on the frequency of the
power theft detection data and the average theft
current. Once the critical grid area is identified, then
MCS decides the hop count (H) for the multi-hop
transmission and the periodicity of the power theft
check, based on the measure of criticality.
Let there are ‘m’ number of MGAs in a
microgrid. The EPTDNA for efficient networking of
power theft data in MCS of the microgrid is as
follows:
1. Phase I:
2. Collect the power theft data from MGA
1
,
MGA
2
….MGA
m
using the power theft detection
PowerTheftDetectioninMicrogrids
345

algorithm for T
c
(in the order of days or weeks)
time duration.
3. Phase II:
4. Calculate {F, Avg(i
PT
)}for each MGA.
5. Classify MGAs based on {F, Avg(i
PT
)} using
algorithms such as medoid or k- means.
6. Get three classes namely FMGA, OMGA and
EUMGA.
7. for(class 1 to class 3)
8. Calculate {Avg(F
cl
), Avg(i
cl
)}
9. T
cl
(unit is same as T
c
) = 1/Avg(F
cl
)
10. Calculate r = Avg(Max(i
con
))/Avg(i
PT
)
11. if(r≥1 )
12. τ
cl
= T
cl
13. Set h
cout
= [(N
tot
/k)-1]
14. else
15. τ
cl
= T
cl
×r
16. Set h
cout
= [N
tot
-1]
17. end if
18. Send T
PT
msg{MCS
ID
, τ
cl
, h
cout
, MGA
ID
,
time_stamp} to MGAs in three classes.
19. end
In EPTDNA, MCS will collect the power theft
data from all the MGAs under the control of the
MCS using the power theft detection algorithm for
T
c
duration. The MCS calculates the frequency of
data on power theft detection(F) of power theft
detection and average power theft current value for
each MGA. On this two-dimensional data, MCS run
any classification algorithm and classify the MGAs
into three classes. The three classes are Frequently
Identified MGA (FMGA), Occasionally Identified
MGA (OMGA) and Extremely Unlikely Identified
MGA (EUMGA). Then for each derived class, the
MCS again computes the average frequency of data
on power theft detection(F
cl
) and the average power
theft current (i
cl
). MCS finds T
cl
using average of
F
cl
. For finding the ratio ‘r’, the MCS calculates the
average current draw of the maximum power
drawing consumers for MGAs. After computing the
ratio ‘r’, it sets the time duration for power theft
check (τ
cl
) and the hop count (h
cout
) for the power
theft data for the MGAs in each class. N
tot
is the
total number of SDNs in the MGA and the factor ‘k’
depends on the maximum communication range of
the SDNs.
After finding out the τ
cl
and h
cout
for each class,
the MCS will send this information to the MGAs in
each class. Then the MGAs set the new values for τ
cl
and h
cout
and those values persist the next T
c
duration. If τ
cl
is too large, then random power theft
check will be introduced for the MGAs. The next
EPTDNA Phase II initiation happens in two cases:
1) After T
c
duration 2) After the power theft
detection in random power theft check. Table 1
shows the description of notations used in this
research work.
Table 1: Description of notations used in this research
paper.
Notations Description
i
k
The current flow
measured b
y
K
th
SDN.
i
kdir
Direction vector of the
current flowing through K
th
SDN.
i
dir
Direction vector of the
p
ower theft current.
i
dk
Sum of the current
flowing through all the
descendants of K
th
SDN.
Tx
loss
Transmission loss due to
heat.
Er
r
val
Tolerance limit for the
error in the received current
value at SDN.
i
PT
Power theft current.
T
c
Time duration for power
theft data collection for
EPTDNA-Phase I.
F Frequency of data on
power theft detection for T
c
duration.
F
cl
Frequency of data on
power theft detection for T
c
duration in a class.
i
cl
Power theft current in a
class.
i
con
Current draw by the
consumer.
τ
cl
Time duration after which
periodic power theft check
happens.
h
cout
Hop count of data
transmission for power theft
check.
N
tot
Total number of SDNs in
a MGA.
k
Factor that determines the
h
cout
and depends on the
maximum communication
ran
g
e of SDNs
6 PERFORMANCE ANALYSIS
AND RESULTS
To show how EPTDNA with PTDA gives better
SMARTGREENS2015-4thInternationalConferenceonSmartCitiesandGreenICTSystems
346

performance than PTDA alone, we assume the
microgrid has fourteen MGAs with ‘F’ and average
of ‘i
PT
’ for 30 days as shown in table 2. We have
applied k-means classification algorithm on the 2-D
data in table 2 (Wilkin and Huang, 2007). The
results of the classification algorithm are shown in
figure 4 and table 3. Five MGAs are identified as
FMGA, six MGAs are identified as EUMGA and
three MGAs are identified as OMGA using k-means
algorithm.
Table 2: Microgrid Areas in a microgrid with ‘F’ and
‘Avg(i
PT
)’used for the analysis.
MGA F Av
g
(i
PT
)
in Amperes
1 15 19
2 20 18
3 17 16
4 18 17
5 2 8
6 1 6
7 4 10
8 3 7
9 13 5
10 16 10
11 12 8
12 5 15
13 8 17
14 6 14
The ‘Avg(F
cl
)’ and ‘Avg(i
cl
)’values are shown in
table 4. From those values, ‘T
cl
’, ‘r’ and ‘τ
cl
’ values
are calculated for the three classes as shown in table
5. The τ
cl
values are derived based on the ‘Avg(F
cl
)’
and ‘r’ values. The Avg(Max(i
con
)) value for the
microgrid is assumed as 15A.
In this case, the hop count (h
cout
) for transmitting
the data for PT check for MGAs inside the classes
EUMGA depends on the factor ‘k’, which again
depends on the communication range of SDNs used
in the microgrid infrastructure. The ‘h
cout
’ for FMGA
and OMGA, depend on the total number of SDNs in
those MGAs.
If in PTDA, the power theft check is done in
every 15minutes for the whole micro-grid, then after
every 15minutes the SDAs and SMs have to transmit
the data through each and every node. Also the sleep
duration for the nodes should be less than
15minutes. By using PTDA with EPTDNA, from the
table 5, it is clear that the sleep duration of the nodes
increases and the message complexity reduces
Figure 4: K-means plot using ‘F’ and ‘Avg(i
PT
)’ from table
2.
Table 3: Microgrid areas (MGAs) in the identified classes.
MGA F Avg(i
PT
)
in Amperes
Class 3 - FMGA
MGA -1 15 19
MGA -2 20 18
MGA -3 17 16
MGA -4 18 17
MGA -10 16 10
Class 2 - EUMGA
MGA -5 2 8
MGA -6 1 6
MGA -7 4 10
MGA -8 3 7
MGA -9 13 5
MGA -11 12 8
Class 1 - OMGA
MGA -12 5 15
MGA -13 8 17
MGA -14 6 14
Table 4: Avg(F
cl
) and Avg(i
cl
) values for the three classes.
Classes Avg(F
cl
) Avg(i
cl
) in
Amperes
Class 3 -
FMGA
17.2 16
Class 2 -
EUMGA
5.83 7.3
Class 1 -
OMGA
6.3 15.33
relative to the PTDA without EPTDNA. As the cost
for communication is directly proportional to the
message complexity, by using EPTDNA along with
PTDA, the cost for communication can be reduced.
Increased sleep duration of the nodes implies the
reduced energy consumption. Thus the effect of
PowerTheftDetectioninMicrogrids
347

Table 5: T
cl,
r and τ
cl
values for the three classes.
Classes T
cl
(in
days)
r τ
cl
(i
n days)
Class 3 -
FMGA
1.74 0.94 1.63
Class 2 -
EUMGA
5.14 2.05 5.14
Class 1 -
OMGA
4.74 0.98 4.63
energy consumption by SDNs or SMs in the un-
sustainability of microgrid can be reduced. In PTDA
with EPTDNA, the example case shows that the hop
count is reduced in MGAs under EUMGA category.
Thus the data latency is reduced in parts of the
micro-grid, if the consumption data is piggy backed
with the power theft detection data. Thus the three
issues of PTDA without EPTDNA mentioned in
section 4 are solved using EPTDNA.
7 CONCLUSIONS
In this paper we have proposed wireless network
based solution for power theft, which is considered
as a bane of power grid in most of the developing
nations. We have proposed power theft detection
algorithm (PTDA) which uses Kirchhoff’s Current
Law (KCL). We have identified three issues of
PTDA when it will be used for micro-grids. To solve
those issues with PTDA, we have proposed another
algorithm called EPTDNA (Efficient Power Theft
Data Networking Algorithm). The performance
analysis and results given in section 6 shows how
EPTDNA solves the issues with PTDA. In future,
we are planning for a real-world deployment of
microgrid infrastructure that enables efficient power
theft detection and localization using EPTDNA
together with PTDA.
ACKNOWLEDGEMENTS
The authors would like to express gratitude for the
immense amount of motivation and research
solutions provided by Sri. Mata Amritanandamayi
Devi, The Chancellor, Amrita University. The
authors would also like to acknowledge Dr. P.
Venkat Rangan for providing valuable suggestions
to improvise this research work.
This work was supported by TATA Consultancy
Services under TCS Research Scholar Program.
REFERENCES
Amin, M., Wollenberg, S., “Toward a smart grid:Power
delivery for the 21
st
century,”IEEE Power Energy
Mag.,vol.3,no. 5, pp. 34-41, sept.-Oct.2005.
Farhangi, H., “The Path of the Smart Grid”, IEEE Power
&Energy Magazine, vol. 8, no. 1, Jan. 2010, pp. 18-
28.
Hartono, B. S., Budiyanto, Y., Setiabudy, R., “Review of
microgrid technology” International Conference on
Quality in Research, June 2013, pp. 127-132, doi:
10.1109/QiR.2013.6632550.
Myoung, N., Kim, Y., Lee, S., “The Design of
Communication Infrastructures for Smart DAS and
AMI”, International Conference on information and
Communication Technology Convergence, 2010,
pp.461–462, doi:10.1109/ICTC.2010.5674796.
Mashima, D., Cardenas, A. A., ,“Evaluating Electricity
Theft Detectors in Smart Grid networks”, RAID 2012,
LNCS 7462, pp 210-229, 2012, Springer.
Nikovski, D., Wang, Z., Esenther, A., Sun, H., Sugiura,
K., Muso, T., Tsuru, K., “Smart Meter Data Analysis
of Power Theft Detection”, Technical Report-TR2013-
065, Mitsubishi Electric Research Laboratories, July
2013.
Depru, S,“ Modeling, Detection, and Prevention of
Electricity Theft for Enhanced Performance and
Security of Power Theft”, Doctoral Thesis, The
University of Toledo, August 2012.
Devidas, A. R., Ramesh, M. V., “Wireless Smart Grid
Design for Monitoring and Optimizing Electric
Transmission in India,” Fourth International
Conference on Sensor Technologies and Applications,
July 2010, pp. 637–640, doi: 10.1109/
SENSORCOMM.2010.100.
Salinas, S., Li, M., Li, P., “Privacy-Preserving Energy
Theft Detection in Smart Grids”, Nineth Annual IEEE
Communications Society Conference on Sensor, Mesh
and Ad Hoc Communications and Networks, June
2012, pp. 605-613, doi: 10.1109/
SECON.2012.6275834.
Weckx, S., Gonzalez, C., Tant, J., Rybel, T. D., Driesen,
J., “Parameter Identification of Unknown Radial Grids
for Theft Detection”, Third IEEE PES International
Conference and Exhibition on Innovative Smart Grid
Technologies, October 2012, pp. 1-6, doi:
10.1109/ISGTEurope.2012.6465644.
McLaughlin, S., Holbert, B., Zonouz, S., Berthier, R.,
“AMIDS: A Multi-Sensor Energy Theft Detection
Framework for Advanced Metering Infrastructures”,
Third IEEE International Conference on Smart Grid
Communications, November 2012, pp. 354-359, doi:
10.1109/SmartGridComm.2012.6486009.
Amarnath, R., Kalaivani, N., Priyanka, V., “Prevention of
Power Blackout and Power Theft using IED”, IEEE
Global Humanitarian Technology Conference,
October 2013, pp. 82-86, doi: 10.1109/
GHTC.2013.6713659.
Agarwal, A., Agarwal, M., Vyas, M., Sharma, R., “A
Study of Zigbee Technology”, International Journal
SMARTGREENS2015-4thInternationalConferenceonSmartCitiesandGreenICTSystems
348

on Recent Innovation Trends in Computing and
Communication, vol. 1, pp. 287-292, April 2013.
Datar, R. V., “WiFi and WiMAX-break through in
wireless access technologies”, IET International
Conference on Wireless, Mobile and Multimedia
Networks, pp-141-145, January 2008.
Baker, S. D., King, S. W., Welch, J. P., “Performance
measures of ISM-band and conventional telemetry”,
IEEE Engineering in Medicine and Biology Magazine,
vol. 23, pp. 27-36, May-June 2004.
Wilkin, G. A., Huang, X., “K-Means Clustering
Algorithms: Implementation and Comparison”,
Second International Multi-Symposiums on Computer
and Computational Sciences, August 2007, pp. 133-
136, doi: 10.1109/IMSCCS.2007.51.
PowerTheftDetectioninMicrogrids
349
