
Faster, Cheaper, Cleaner
Assessing Urban Mobility
Gonc¸alo Salazar
1
, Jo˜ao Pedro Silva
2
and Bernardo Ribeiro
1
1
CEiiA - Centro de Excelˆencia e Inovac¸˜ao na Ind´ustria Autom´ovel, Rua Engenheiro Frederico Ulrich, 2650, Maia, Portugal
2
IN+ Center for Innovation, Technology and Policy Research, Instituto Superior T´ecnico,
Av. Rovisco Pais, 1049-001 Lisboa, Portugal
Keywords:
Urban Mobility, Portugal, Emissions, Cost, Time, Mobility Index.
Abstract:
This work aims at systematically characterizing urban mobility. There are several possible approaches to the
problem but this work focus on reducing commuting times and emissions using the current infrastructures and
without increasing the cost to the end user and doing so in an effective and sustainable way. A set of pairs of
destinations and origins was chosen to represent usual commutes and cover a significant area of a city. These
locations were connected by car, motorcycle, public transportation, cycling and walking. The routes were
performed in both directions at three different times of day which allowed for a better understanding of daily
traffic variations. For each route and for each mode of transportation the route and time taken were collected
and the emissions and cost were estimated . The data was treated to adjust the route and gradient difference
between the collected data and actual roads. Measurements and estimates were compared and averaged for
all the routes and for each means of transportation providing an overall view of the commutes. The different
means of transportation were compared and the limit to which one mode has the advantage over another was
evaluated, this advantage is however dependent on the chosen route.
1 INTRODUCTION
The current fast growth of urban population is likely
to lead to an unsustainable situation if not handled
properly. This increase creates multiple problems not
seen before, being mobility one of the most affected
areas.
New emerging urban mobility problems cannot be
tackled effectively using traditional solutions. Inno-
vative approaches and creative solutions are needed
to tackle this ever increasing problem.
This paper aims at analysing one such approach
and present some preliminary results and findings.
The focus was mainly on the analysis of soft and
shared means of transport and how could they be ben-
eficial to the population in three different areas: time,
cost and emissions.
2 MOTIVATION
Historically, the solution to urban mobility problems
are based in the construction of more roads, bigger
infrastructures and the displacement of industries and
services to unused areas close to the cities. However
with the fast growth of the urban population (World
Health Organisation, 2010) and the increasing cost of
land these solutions are no longer efficient.
However, to tackle this new problem, one must
first have the means to analyse and quantify it. While
several methodologies exist (Tomtom, 2013; Gabi-
nete de Estudos e Planeamento and Direcc¸˜ao Munic-
ipal da Via P´ublica, 2007) to evaluate mobility in ur-
ban areas they do not consider nor optimize for an
intermodal route calculation with different weights
of cost, emissions, distance travelled and commuting
time.
The proposal for this project was to try to develop
an index that included considerations for time, emis-
sions and cost for a certain route travelled in urban
areas. The methodology could then be used to evalu-
ate and compare urban mobility in different areas of
the city and different cities.
3 METHODOLOGY
To ensure the coherence of the results and their ap-
43
Salazar G., Silva J. and Ribeiro B..
Faster, Cheaper, Cleaner - Assessing Urban Mobility.
DOI: 10.5220/0005446900430048
In Proceedings of the 4th International Conference on Smart Cities and Green ICT Systems (SMARTGREENS-2015), pages 43-48
ISBN: 978-989-758-105-2
Copyright
c
2015 SCITEPRESS (Science and Technology Publications, Lda.)
plicability to other cities and to different contexts,
a structured approach was defined. These methods
could then be used to analyse and then compare dif-
ferent cities.
Due to geographical proximity and presence of
multiple modes of transport the city of Porto was cho-
sen as a testbed for the pilot. Several routes were se-
lected and analysed using the different available trans-
port modes.
The gathered data was analysed using available
web tools, some of the data was estimated using val-
ues from available sources.
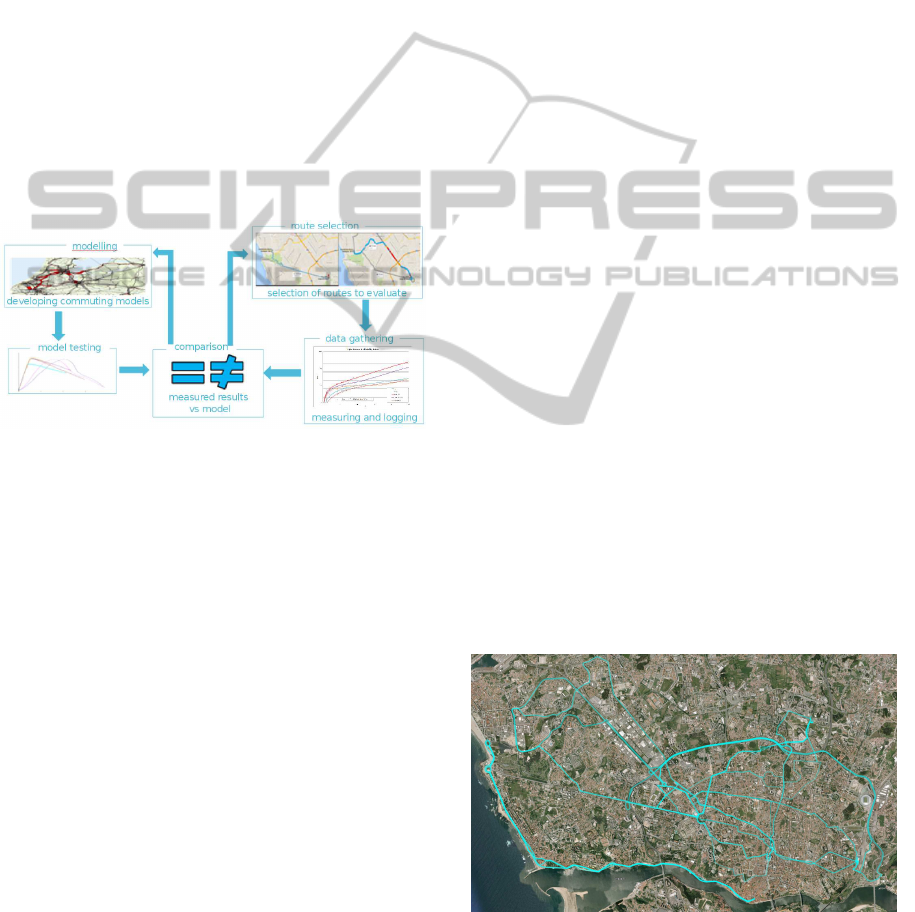
The overall methodology (cf. Figure ??) consists
of a first selection routes and gathering of data fol-
lowed by the definition of mobility models that would
allow to expand the analysis to other areas and there-
fore validate the models. The process would be con-
tinuous and cyclic to improve the model as well as
evaluate the mobility within the city.
Figure 1: Methodology overview.
3.1 Modes of Transport
The project considered multiple means of transport
within the city of Porto. The modes of transport
should represent the most commonly used and allow
for different scenarios to be evaluated.
The evaluated modes of transport were:
• Car;
• Motorcycle;
• Public Transport (Rail and Road based);
• Bicycle;
• Pedestrian.
Using these different modes of transport allows
for a greater understanding of the mobility in the city
and considers most of the available options to the cit-
izens.
3.2 Route Selection
In order to have a pilot for the methodology different
pairs of origins and destinations within the urban area
of the city of Porto were selected. The different pairs
should be connected by public transport and have
access by the other means of transport.
The criterion for selection of routes was as fol-
lows:
• The routes should cover the biggest area possible;
• The routes should have connections by public
transport;
• The routes should connect the most travelled from
and to areas of the city.
After an analysis with the municipality of Porto,
the selected routes were as follows:
• From the city hall to CEiiA’s building in Matosin-
hos
– Connects the city center to an important adja-
cent city. Multiple interfaces exist between the
two cities. It is an important connection for the
two cities
• From Casa da M´usica to the Faculty of Engineer-
ing
– Connects an important multimodal interface
and entry point of the city with a widely used
area close to the outskirts of the city and to one
of the most important hospital of the city
• From Campanh˜a’s train station to the hotel area
near Avenida da Boavista
– Connects one of the major entry points to the
city with a area with good access near the city
center and good opportunities for visitors
• From Anemona’s Roundabout to Ribeira
– Connects two areas on the outside of the city
bypassing the center. Usual route for tourists
and citizens going to the riverside area
Figure 2: City of Porto with routes connecting origins and
destinations highlighted.
Using the modes of transport defined in chapter
3.1 and the selected pairs of origins and destinations,
SMARTGREENS2015-4thInternationalConferenceonSmartCitiesandGreenICTSystems
44

a total of 320 km within 20 unique routes were iden-
tified (cf. Figure 2). Figure 2 shows that the almost
totality of the city area is covered providing a testbed
extensive enough for the purpose of this work.
3.3 Data Collection
To evaluate the parameters considered for this paper
GPS data for all routes was collected.
3.3.1 GPS Data
The GPS data was collected using GPS Logger for
Android, a smartphone application (cf. Figure 3).
This application records points along the route in
CSV (Comma Separated Values) format.
The recorded GPS data is extensive, however,
within the scope of the project only some information
was used. Table 1 describes the data collected with
the GPS application.
Table 1: Data collected from the GPS Logger.
Data type Units
Time Hours,Minutes,Seconds
Latitude Degrees
Longitude Degrees
Altitude m
Speed m/s
Figure 3: Screenshot from the GPSLogger Application.
The data collected will allow to define the exact
route used to connect the origin to the destination and
the time taken to travel such route.
3.4 Estimates
Some of the parameters could not be directly mea-
sured and were therefore estimated or used from other
sources.
The use of estimated values for part of the results
is needed due to the constraints of the problem and the
high complexity required to measure some values.
This is acceptable because the project focuses not
on a particular type of displacement but tries to aver-
age and create an approximate model for cost, time
and emissions. However to ensure the validity of the
results the number of sources was kept to a minimum.
3.4.1 Costs
Within the scope of this paper the cost estimation con-
sidered those that directly affect the user and were cal-
culated as a function of distance. Public transport was
the exception as the costs for the user are not a func-
tion of distance but depend on the number of travels
necessary to take. This would give an approximate
value for each mean of transport that could be used
for comparison along their route.
For car the cost per kilometre was obtained from
the Portuguese legislation (Portugal, 2012) since it
defines the value that should be paid by companies to
their employees when using the private car for work
related travels. It was considered that during the mak-
ing of the law an extensive study was done so as to
define a fair value that included not only gas, but also
vehicle maintenance, wear, insurance and taxes. The
value should reflect the average cost per kilometre of
the global Portuguese car fleet (Balsa, 2013).
For motorcycle the value was also obtained from
the Portuguese Legislation (Portugal, 2010) due to the
reasons presented above.
For public transport the cost is not a function of
distance but instead depends on the number of trips.
Both rail and road based transport in the city of Porto
have the same cost and use the same tickets. One
single-use trip in the city of Porto has a cost of 1.20
euros. However, considering a daily commute with
two trips (home-work and back) for 22 days of work
per month and a public transport card costing 30.10
euros per month would result in a cost of 0.64 euros
per trip.
Cycling has a cost of 0.03 euros per kilometre
considering maintenance for a lifetime of 10 years
according to the working paper on the Costs and
Benefits of Cycling (Belter et al., 2013).
The cost of walking is negligible and considered
to be zero. Although one could argue shoes and
clothes are deteriorated while walking, their cost
cannot be attributed to the activity itself as people
Faster,Cheaper,Cleaner-AssessingUrbanMobility
45

have to buy clothing and shoes anyway. Recent
reports (Fundac¸˜ao Calouste Gulbenkian, 2014) have
shown there are even potential savings in terms of
healthcare costs, as walking regularly does reduce
the risk of cardiovascular diseases and diabetes, for
instance. However, it is difficult to quantify direct
savings and for the purpose of this study the authors
decided not to consider them.
Overall the obtained estimated cost values for
each mode of transport were:
Table 2: Cost estimation per mode of transport.
Transport Cost
Car 0.36AC per km
Motorcycle 0.14AC per km
Public Transport 0.64AC per trip
Bicycle 0.03AC per km
Pedestrian 0AC per km
3.4.2 Emissions
For this project emissions were not measured due to
the granularity of data required and the project times-
pan. To ensure that the model represented the actual
Portuguese car fleet (Balsa, 2013) extensive measure-
ments had to be made and those would produce results
highly dependent on the driving style (Panis et al.,
2006).
More comprehensive models like the COPERT
and MOVES were not used due to some problems,
the MOVES model does not represent the Portuguese
car fleet (Duarte and Costa, 2010) while the COPERT
model does not have a data set representing Portugal
individually, only as part of the EU (Emisia, 2014).
Furthermore emission estimation can introduce a
great overhead if not properly evaluated, therefore,
within the scope of the work only the equivalent CO2
emissions for each mode of transport were consid-
ered.
Car emissions were obtained from the Carbon
Footprint Calculator (Carbon Footprint, 2012) for a
EU average petrol car with an engine up to 1.4L. The
value obtained was of 160.61 grams of CO
2
per km.
It is considered that this value reflects the average car
from the Portuguese fleet and therefore is adequate.
Motorcycle emissions were obtained from the
same source as the car ones (Carbon Footprint, 2012)
and the value obtained is 106.21 grams of CO
2
per
km.
Public transport emissions need to consider both
road based and rail based public transport. A previ-
ous work done by Quercus (Portuguese Environmen-
tal Agency), with results available online (Ecocasa,
2012). For road based public transport the value is
82 grams of CO
2
per km while for Portos rail based
transport system is 63 grams of CO
2
per km.
The European Cyclist Federation (European Cy-
clist Federation, 2012) states that cycling emissions
are around 21 grams of CO
2
per km.
For this paper it was considered that walking pro-
duced no emissions.
Overall the obtained estimated emission values for
each mode of transport were:
Table 3: Emission estimation per mode of transport.
Transport Emissions
Car 160.61 gCO
2
per km
Motorcycle 106.21 gCO
2
per km
Road-based Public Transport 82 gCO
2
per km
Rail-based Public Transport 63 gCO
2
per km
Bicycle 21 gCO
2
per km
Pedestrian 0 gCO
2
per km
4 DATA ANALYSIS
Using the collected and estimated values for each
mode of transport and pair of source and destination
the data was analysed to perceive patterns that would
allow to generate a model that could be extended to
other routes with different characteristics. The col-
lected GPS data was converted from CVS to GPX
format to be easier to interpret with mapping appli-
cations.
Due to errors induced by the measurements the
data points were fitted to the road to more correctly
represent reality. For each pair of source and destina-
tion the time taken and estimated cost and emissions
were evaluated for each mode of transportation. The
results were then averaged for all routes to give an
overall vision of the city along those 3 vectors.
The obtained results were extended to a model
where the cost, emission and time can by evaluated
for each mode of transport over distance (cf Figures
4,5, and 6)
Using the results obtained and the analysis along
each individual vector, an index that comprehends the
three parameters was developed. This index considers
different weights for time, emissions and cost that can
be tuned for different values (cf. Equation 1).
Index = Average(Time × Weight,
Distance× Emission× Weight,
Distance× Cost× Weight)
(1)
SMARTGREENS2015-4thInternationalConferenceonSmartCitiesandGreenICTSystems
46
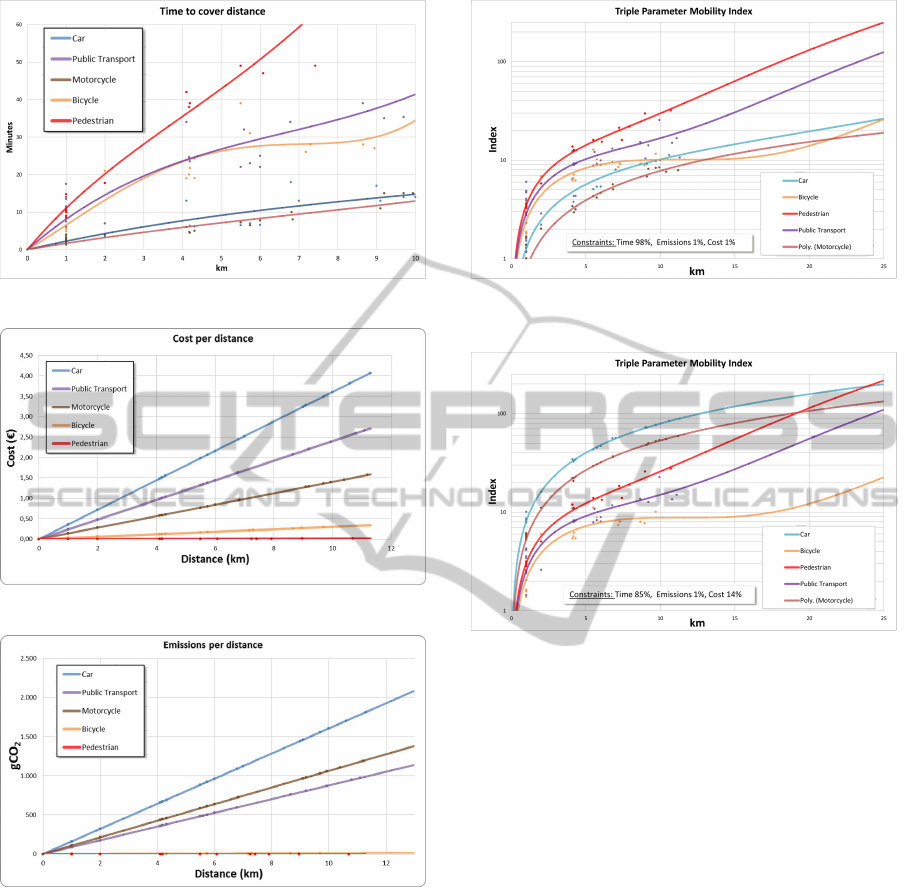
Figure 4: Time over distance.
Figure 5: Cost over distance.
Figure 6: Emissions over distance.
With this index value for each distance the results
can be extrapolated and values for all distances can be
obtained.
A urban commuter such as a businessman will
make the mode of transport choice with most of the
weight on time. A possible weight distribution for
such user would be: 98% for time, 1% for emissions
and 1% for costs. With this distribution, car and mo-
torcycle are the best options up to 10 km. After that,
cycling is the best option, due to the small accumulat-
ing effects of cost and emissions in the index, never-
theless these results are based on trend lines and can
be change once further data gathering is done. After
Figure 7: Triple Parameter Mobility Index versus distance
(lower is better) for 98% time, 1% emissions and 1% costs.
Figure 8: Triple Parameter Mobility Index versus distance
(lower is better) for 85% time, 1% emissions and 14% costs.
20 km motorcycle becomes the best option. Public
transport is one of the worst options for the evaluated
distances.
A typical middle class worker will consider that
time is of importance but cost will also be an impor-
tant factor therefore the weight distribution will be:
85% for time, 1% for emissions and 14% for costs. In
this case, cycling is always the best option while the
car is the worst. Cycling is almost two times better
than a car for the evaluated distances. Public trans-
port is, again, worse than cycling. Walking, although
worst than cycling is still better than driving up to 20
km, without considering other external factors, as fa-
tigue for instance.
An urban commuter with great environmental
conscience would consider emissions to be the top
priority. A possible weight distribution for such com-
muter would be: 25% for time, 50% for emissions and
25% for costs. In this situation, bicycle and walking
are always the best option. Due to the high weight for
emissions all other modes of transport are worst. Pub-
lic transport is again the least desirable mode of trans-
port. However, when considering a zero emission ve-
hicle, such as an electric vehicle, the car is again the
Faster,Cheaper,Cleaner-AssessingUrbanMobility
47
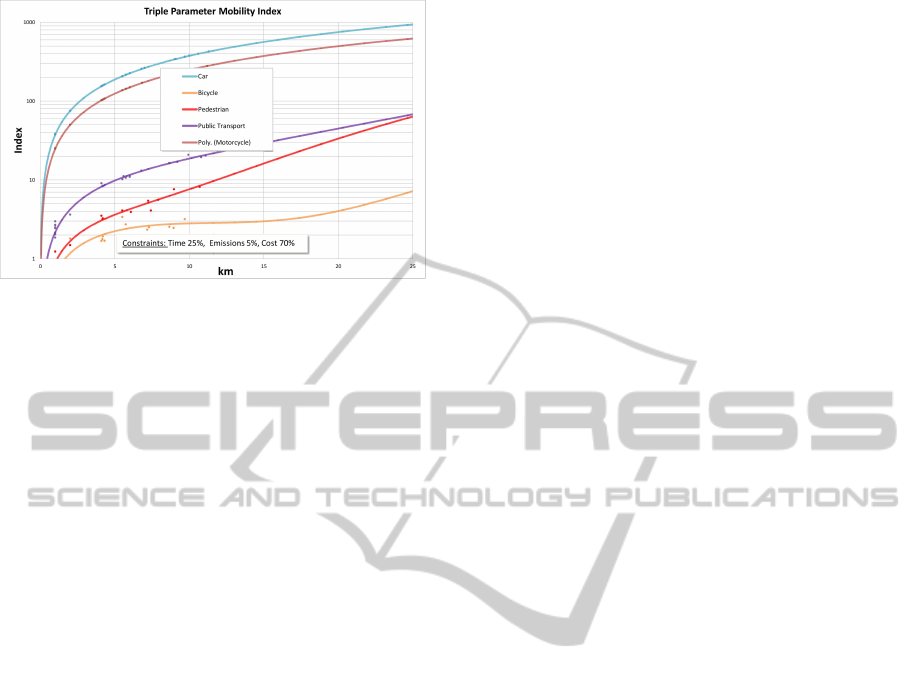
Figure 9: Triple Parameter Mobility Index versus distance
(lower is better) for 25% time, 5% emissions and 70% costs.
best option, since not only the emissions will be re-
duced but the costs as well.
5 CONCLUSIONS
After evaluating the obtained results it can be seen
that cycling, contrary, to what was expected is faster
than public transport while being cheaper and less
pollutant.
Car is one of the fastest modes of transport, how-
ever is the most pollutant and expensive. However
this only considers one occupant per car, a higher
number of occupants per vehicle could make car a
better option. This opens the possibility for further
studies considering the impact of urban car-pooling
schemes in commutes.
The index shows that without a considerable
weight for time, car is never the best option. Cost
has a great influence on the index. Public transport is
rarely the best option, it is however a valid mode of
transport if one cannot walk or cycle over long dis-
tances.
Public transport might have a bad performance
due to the lack of dedicated lanes for road based pub-
lic transport. While rail-based public transport is not
affected by traffic and has a better performance than
cycling the overall results of public transport are neg-
atively affected by the poor results of the road based
counterpart. In further studies, rail and road based
public transport modes should be analysed separately.
It might be possible that electric assist bicycles
could further improve the advantages of cycling over
public transport. However further studies need to be
made.
While the selection of the city of Porto as a case
study provides an insight on the methodology to eval-
uate the urban mobility, however further studies in
different cities are recommended as a validation tool
for the methodology.
REFERENCES
Balsa, J. (2013). Avaliac¸˜ao do impacto da introduc¸˜ao de
ve´ıculos el´etricos na procura de combust´ıveis em por-
tugal. Master’s thesis, Universidade de Coimbra.
Belter, T., Harten, M., and Sorof, S. (2013). Working paper
on the costs and benefits of cycling. SustraMM.
Carbon Footprint (2012). Carbon footprint cal-
culator. Available from: http://calculator.
carbonfootprint.com/calculator.aspx. Last accessed:
04/12/2014.
Duarte, I. and Costa, G. (2010). An´alise do modelo MOVES
como ferramenta de c´alculo de emiss˜oes. Master’s
thesis, Universidade de Aveiro.
Ecocasa (2012). Simulador emiss˜oes. Available
from: http://www.ecocasa.pt/simuladores/Simulador
EmissoesCO2/simuladorEmissoesCO2.php. Last ac-
cessed: 04/12/2014.
Emisia (2014). Copert. Available from: http://
www.emisia.com/copert-shop. Last accessed:
06/01/2015.
European Cyclist Federation (2012). Cycle more often 2
cool down the planet. European Cyclist Federation.
Fundac¸˜ao Calouste Gulbenkian (2014). Um futuro para a
sa´ude. Fundac¸˜ao Calouste Gulbenkian.
Gabinete de Estudos e Planeamento and Direcc¸˜ao Munici-
pal da Via P´ublica (2007). Mobilidade na cidade do
porto - an´alise das deslocac¸˜oes em transporte individ-
ual.
Haan, P. and Keller, M. (2000). Emission factors for passen-
ger cars: application of instantaneous emission mod-
eling. Atmospheric Environment, 34.
Panis, L., Broekx, S., and Liu, R. (2006). Modelling in-
stantaneous traffic emission and the influence of traffic
speed limits. Science of the Total Environment, 371.
Portugal (2010). Decreto-Lei n. 137/2010 de 28 de Dezem-
bro. Lisbon, DGCI.
Portugal (2012). Circular da DGCI n19/93 de 20 de Agosto.
Lisbon, Di´ario da R´epublica.
Tomtom (2013). TomTom European Traffic Index.
World Health Organisation (2010). Bulletin of the world
health organisation.
SMARTGREENS2015-4thInternationalConferenceonSmartCitiesandGreenICTSystems
48
