
Knowing the past to Plan for the Future
An In-depth Analysis of the First 10 Editions of the WEBIST Conference
Giseli Rabello Lopes
1
, Bernardo Pereira Nunes
2
, Luiz Andr
´
e P. Paes Leme
3
,
Terhi Nurmikko-Fuller
4
and Marco A. Casanova
2
1
Computer Science Department, Federal University of Rio de Janeiro, Rio de Janeiro, RJ, Brazil
2
Department of Informatics, Pontifical Catholic University of Rio de Janeiro, Rio de Janeiro, RJ, Brazil
3
Computer Science Institute, Fluminense Federal University, Niter
´
oi, RJ, Brazil
4
Oxford e-Research Centre, Oxford University, Oxford/OX1 3QG, U.K.
Keywords:
Conference Analysis, Statistical Analysis, Bibliometrics, Social Network Analysis, WEBIST Analysis,
Linked Data.
Abstract:
Over the last ten years, members of the WEBIST community have dedicated their time and efforts to face
a number of research challenges, making significant advances in Information Systems and pointing to new
directions for innovation and learning. After ten successful WEBIST conferences and several scientific pub-
lications, an extensive analysis of the WEBIST conferences has been carried out (involving authors, publi-
cations, conference impact, topics coverage, community analysis and other aspects) to possibly assist us to
further advance Information Systems. Thus, in this paper, we present an in-depth analysis of the last ten
WEBIST conferences based on social network analysis, bibliometrics and statistical measures and describe a
Web-based application built on top of triplified datasets to interactively explore the findings and possibly assist
the Information Systems community to reveal new directions.
1 INTRODUCTION
Data analysis has shown its utility for conferences,
detecting related research groups, topics of interest,
impact of authors and publications in a given field,
among others. An example of this is the analy-
sis of a group of four conferences in the field of
Human-Computer Interaction (HCI), conducted by
Henry et al. (2007). It was based solely on meta-
data information of publications (such as authors and
keywords) and was capable of providing valuable in-
sights into authors’ behaviours and research topics
investigated in HCI in the last two decades. Blan-
chard (2012) presented a ten-year longitudinal study
over Intelligent Tutoring Systems (ITS) and Artifi-
cial Intelligence in Education (AIED) fields. He fo-
cused on the analysis of potential cultural biases of
the American Psychology Association (APA) in the
ITS and AIED fields. Chen et al. (2009) presented
a visual analytic approach to the study of scientific
discoveries and knowledge diffusion. Their analysis
focused on the identification of co-citations clusters
where they were classified and used to understand
how astronomical research evolved between 1994 and
1998. Another example following the same line was
conducted by Gasparini et al. (2013). In their study,
they were able to identify central authors and institu-
tions in the HCI field, as well as important trends and
topics. As for the Information System (IS), Posada
and Baranauskas (2014) analysed a sister event called
International Conference on Enterprise Information
Systems (ICEIS). They built a roadmap of the IS field
based on paper titles and authors from the last three
years in ICEIS, and for the last eight years of selected
papers published in a Springer series on IS. Chen et al.
(2007) performed citation analysis of all papers pub-
lished in the International Conference on Conceptual
Modeling (ER) between 1979 and 2005. The anal-
ysis conducted by the aforementioned communities
opened up a wide range of opportunities for research
agendas and trends as well as supporting the domains
introspective analysis.
This paper aims at extending previous analyti-
cal methods and providing a comprehensive social
analysis of the community of WEBIST. Recently,
Zervas et al. (2014) presented a study on research
collaboration patterns via co-authorship analysis re-
garding Technology-enhanced Learning fields. Sim-
431
Rabello Lopes G., Pereira Nunes B., P. Paes Leme L., Nurmikko-Fuller T. and A. Casanova M..
Knowing the past to Plan for the Future - An In-depth Analysis of the First 10 Editions of the WEBIST Conference.
DOI: 10.5220/0005447704310442
In Proceedings of the 11th International Conference on Web Information Systems and Technologies (WEBIST-2015), pages 431-442
ISBN: 978-989-758-106-9
Copyright
c
2015 SCITEPRESS (Science and Technology Publications, Lda.)

ilar analyses were conducted by Procopio Jr. et al.
(2011) regarding Databases fields and by Cheong and
Corbitt (2009) regarding Information Systems fields
(analysing the Pacific Asia Conference on Informa-
tion Systems). The analysis of co-authorships in re-
search communities can reveal strong research groups
in the area and also enable the creation of links over-
time between different groups. Apart from presenting
the analysis of the last ten editions of WEBIST, we are
also concerned with the publication of the results in a
format where they can be replicated and reused in fur-
ther analysis. For this, we have borrowed Batista and
Loscio’s approach (Batista and Loscio, 2013) where
they used Linked Data (LD) principles to publish con-
ference data.
In this paper we present an in-depth and thor-
ough analysis of the first ten editions (2005-2014)
of the WEBIST conference. To briefly summarise,
WEBIST has brought together researchers and pro-
fessionals to develop and advance the IS field. So
far, it has already attracted 2,867 researchers and pro-
fessionals from several institutions as well as pub-
lished 1,449 papers, which in turn are being cited
by other researchers in IS and other fields. More-
over, the conference currently has five main tracks
that cover a wide range of aspects involving IS: Inter-
net Technology, Web Interfaces and Applications, So-
ciety, e-Business and e-Government, Web Intelligence
and Mobile Information Systems.
The analysis presented in this paper relies on
techniques borrowed from social network analysis
(Wasserman and Faust, 1994), bibliometrics and tra-
ditional statistical measures. We also created a Web-
based application that enables users to interactively
explore WEBIST data. As the WEBIST data is pub-
lished following LD principles (Berners-Lee, 2006),
we also provide a SPARQL endpoint where other re-
searchers can extend our analysis. The importance
of such analysis goes beyond the analysis and possi-
ble interpretation of data and represents a milestone
achieved by the IS and WEBIST community so far.
The remainder of this paper is organised as fol-
lows. Section 2 overviews metrics and measures used
in the analysis of the last ten WEBIST conferences.
Section 3 details the extraction, enrichment and pub-
lication process of raw WEBIST data into RDF data
and presents a visualisation tool specifically created to
manipulate and possibly assist users in finding new re-
search groups, topics and insights. Section 4 presents
several analysis conducted with the WEBIST tool. Fi-
nally, Section 5 concludes the work with remarks and
future directions.
2 BACKGROUND
This section provides the necessary background infor-
mation required to understand the analysis conducted
with the data produced over the last decade by the
WEBIST community. We review metrics and meth-
ods of statistical analysis, social network analysis and
bibliometric indices.
2.1 Classical Statistical Measures
Pearson’s Correlation Coefficient (Rodgers and
Nicewander, 1988), often denoted by the letter r, mea-
sures the strength and direction of the linear correla-
tion between two variables X and Y . Pearson’s coef-
ficient (see Equation 1) can be defined as the covari-
ance of the variables divided by the product of their
standard deviations to measure their dependence:
r =
∑
N
i=1
(x
i
−
¯
X)(y
i
−
¯
Y )
q
∑
N
i=1
(x
i
−
¯
X)
2
q
∑
N
i=1
(y
i
−
¯
Y )
2
(1)
An r value between +1 and -1 indicates the degree
of linear dependence between X and Y , r=1 indicates
a total positive correlation between the two variables
and, finally, r=-1 indicates a total negative (inverse)
correlation. For instance, as X values increase, Y val-
ues linearly decrease.
Lorenz Curve (Gini, 1912) represents the cumulative
distribution of a probability density function. Such
a function is built as a ranking of the members of
the population disposed in ascending order of the
amount being studied. The percentage of individu-
als is plotted on the x-axis and the percentage of the
variable values on the y-axis. The distribution is per-
fectly equalitarian when every individual has the same
variable value; a 45-degree line represents the per-
fect equality. On the other hand, the perfectly un-
equal distribution is the one in which only one in-
dividual has all the variable value, the curve is y=0
for all x<100%, and y=100% when x=100%, known
as the perfect inequality line. This curve was ini-
tially created to study the social inequality of wealth
and income distributions for a population, but can be
applied to analyse other distributions (Lopes et al.,
2012). We used the Lorenz curve (Section 4) to study
the distribution of papers by author.
Gini Coefficient (Gini, 1912) is a measure of statisti-
cal dispersion indicating the inequality among values
of a frequency distribution. It is graphically repre-
sented as the area between the perfect equality line
and the observed Lorenz curve.
WEBIST2015-11thInternationalConferenceonWebInformationSystemsandTechnologies
432

Robin Hood Index (Hoover, 1941), also called
Hoover index, is used to measure the fraction of the
total variable value that must be redistributed over
the population to become a uniform distribution. It
is graphically represented as the longest vertical dis-
tance between the Lorenz curve and the perfect equal-
ity line.
2.2 Social Network Analysis
Before introducing social network metrics and con-
cepts (Wasserman and Faust, 1994; Freeman, 1979;
Hoser et al., 2006; Marsden, 2002; Newman, 2001,
2003), it is convenient to represent a social network
as a graph structure G = (N, E), where N is the set
of nodes, where n
i
∈ N represents an actor of the net-
work, and E is the set of edges, where e
i
∈ E repre-
sents a relational tie between a pair of actors.
Density is calculated as the number of the actual ex-
isting edges of a graph, divided by the maximum
number of edges the graph can have. A density value
equal to 1 indicates an entirely connected network
while 0 indicates a disconnected network. Consider-
ing an undirected graph where the possible number of
connections between each two nodes is 1, the density
can be calculated as:
D =
2|E|
|N|(|N| − 1)
(2)
where |E| is the cardinality of the set of edges and |N|
is the cardinality of the set of nodes.
Modularity is a measure of the structure of networks
and estimates the strength of division of a network
into communities (groups). It is often used in optimi-
sation methods for detecting community structure in
networks. A high modularity value indicates a net-
work having dense connections between the nodes
within the communities, but sparse connections be-
tween nodes in different communities. Modularity
can be calculated as (Newman and Girvan, 2004):
Q =
∑
i
(e
ii
− a
2
i
) (3)
where e
i j
is the portion of edges connecting nodes
from the community i to nodes from the community
j; a
i
=
∑
j
e
i j
is the portion of edges with at least one
node from the community i. Each edge contributes
once in the count (the contribution must be divided
by half, each halve for e
i j
and the other for e
ji
).
Giant Component (also named main component) is
the connected component which contains most of the
nodes in the graph.
Giant Coefficient is based on the size of the giant
component G
0
of a graph G. It is calculated as the
number of nodes N
0
in the giant component divided
by the total number of nodes N in the entire graph:
GC =
|N
0
|
|N|
, where N
0
⊆ N (4)
Diameter is associated with graph distance. It is
calculated as the maximum value among all shortest
paths between two nodes of the graph (i.e., the longest
distance between any pair of nodes belonging to the
graph).
Average Clustering Coefficient is a measure of the
degree to which nodes in a graph tend to cluster to-
gether (connectivity of neighbours). It is calculated
as the average of the clustering coefficients of all the
nodes in the graph:
¯
C =
1
|N|
|N|
∑
i=1
C
i
(5)
where C
i
is the clustering coefficient of a node n
i
and
is calculated as the number of existing edges between
the direct neighbours of n
i
divided by the total number
of possible edges directly connecting all neighbours
of n
i
.
2.3 Bibliometric Indices
This section introduces two common bibliometric in-
dices often used to measure the impact, in terms
of popularity, of researchers, scientific publications,
conferences and journals.
h-index was proposed to measure both the number
of publications and the number of citations per pub-
lication of a scientist. According to Hirsch (2005), a
scientist has index h if h of his/her N
p
papers have
at least h citations each, and the other (N
p
− h) pa-
pers have no more than h citations each. This index
is also applied to estimate the productivity and impact
of conferences.
i10-index indicates the number of publications of a
scientist having at least ten citations
1
.
3 WEBIST WORKFLOW - FROM
RAW TO RDF DATA
3.1 Overview of the Process
This section overviews the process of data acquisi-
tion involving extraction, enrichment, preparation and
consolidation to create the WEBIST Dataset and to
1
http://googlescholar.blogspot.com.br/2011/
KnowingthepasttoPlanfortheFuture-AnIn-depthAnalysisoftheFirst10EditionsoftheWEBISTConference
433
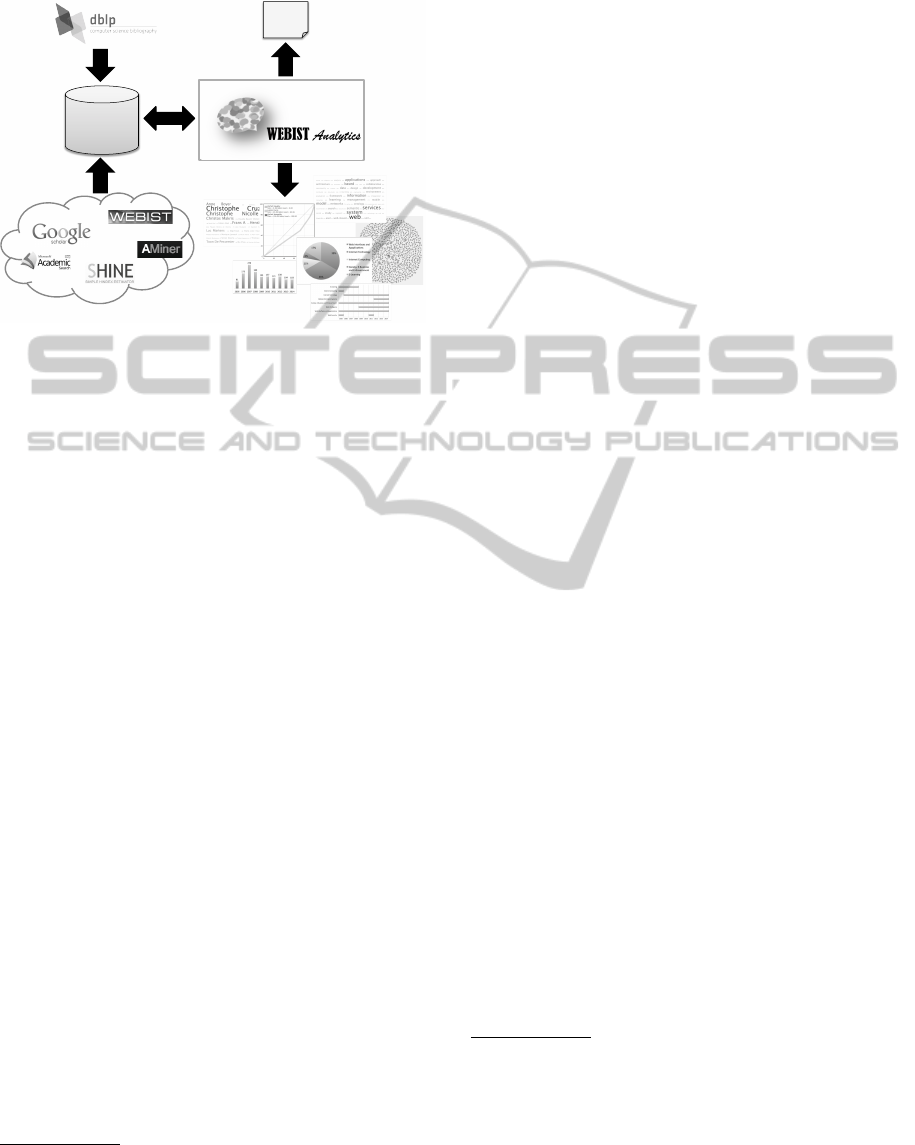
use it by the WEBIST Analytics. Figure 1 depicts the
whole process.
WEBIST'
Dataset'
…
RDF'
dump'
(1)'
(2)'
(3)'
(5)'
(4)'
Figure 1: WEBIST workflow.
Initially, we created an interlinked open dataset,
named WEBIST Dataset, available in RDF, follow-
ing the Linked Data principles (Berners-Lee, 2006),
about the 10 editions of WEBIST conference. This
dataset was created by aggregating data extracted
from different data sources. The initial core of the
data about WEBIST was extracted from DBLP (Dig-
ital Bibliography & Library Project)
2
(Step 1). Then,
the data was enriched using data crawled from differ-
ent Web sources such as Google Scholar Citations
3
(Step 2).
Based on the information loaded in the WEBIST
Dataset (Step 3), the proposed Web application pro-
vides different functionalities as exploratory search
and several analysis over the data presented through
different graphical visualisations (Step 4).
Moreover, through the WEBIST Analytics inter-
face, the RDF dump of the WEBIST Dataset is avail-
able for download (Step 5). WEBIST Dataset creation
and WEBIST Analytics functionalities are detailed in
the next subsections.
3.2 WEBIST Dataset
Data Acquisition. Over the last ten years a huge
amount of data has been generated on the Web in
different formats. This also happened with WEBIST
conferences, where information about the conference,
such as paper acceptance or organisation committee
has been published. Thus, to create a tool to seam-
lessly make sense of the data, we aggregated data ex-
tracted from different data sources, being aware of the
2
http://www.informatik.uni-trier.de/˜ley/db/
3
http://scholar.google.com/citations
possible necessity of initially preparing the data for
deduplication (Elmagarmid et al., 2007) techniques.
The initial core of the data about WEBIST was
extracted, in December 2014, from DBLP a digital li-
brary about computer science publications. We were
not able to find an updated source of DBLP data in
RDF format (containing all editions of WEBIST con-
ference). Thus, we had to extract the data directly
from the XML version of DBLP available. This XML
data also contained information about the name dis-
ambiguation of the authors (different spellings of the
name representing the same author in XML version
of DBLP). Thus, the authors name disambiguation
(Borges et al., 2011) was facilitated in this initial core.
In summary, we collected information about the pub-
lished papers and authors of WEBIST, reaching a total
of 1,449 papers and 2,867 authors.
Data Enrichment. Data enrichment serves as a
means to extending the initial data from additional
data sources. For this, we developed a focused
crawler to obtain this complementary information.
In this step, information from Google Scholar Cita-
tions
4
and Google Scholar were used to obtain bib-
liometric indices of WEBIST authors. Specifically,
the key of authors in Google Scholar Citations and
the authors indices (h-index, i10-index and number of
citations) were extracted from Google Scholar
5
and
Google Scholar Citations, respectively. The crawl-
ing process used the name of the authors to perform
the searches. Using this strategy, 748 authors pro-
files were found in Google Scholar Citations, repre-
senting 26.09% of the total WEBIST authors. Other
complementary information about some publications
citations was crawled from Google Scholar. We col-
lected the number of citations for the assumed most
cited papers: the candidates to be most cited papers
were obtained by the topmost ranked WEBIST pa-
pers presented in SHINE (Simple H-INdex Estima-
tor)
6
, Arnetminer
7
and Microsoft Academic Search
8
.
Additional information about the main research areas
of each edition of WEBIST were extracted from each
conference Web site
9
.
Data Transformation. Another crucial step is data
transformation, carried out after data acquisition in-
volving the preparation and enrichment steps, requir-
ing a common format for the data. For this, we fol-
lowed the Linked Data principles (Berners-Lee, 2006)
4
http://scholar.google.com/citations
5
http://scholar.google.com
6
http://shine.icomp.ufam.edu.br
7
http://arnetminer.org/
8
http://academic.research.microsoft.com/
9
2005-2011: http://www.webist.org/WEBIST$year$ ;
2012-2014: http://www.webist.org/?y=$year$
WEBIST2015-11thInternationalConferenceonWebInformationSystemsandTechnologies
434
that encourage data publishers to expose their data
through HTTP mechanism and to use RDF as the
data description language. According to this guide
lines, the publishers should name things using HTTP
URIs and provide appropriate clipping of data in RDF
when users follow the URIs. We used a relational-to-
RDF framework (D2RQ) (Bizer and Seaborne, 2004)
that dinamically transforms relational data into RDF
graphs. It provides an HTML browser for relational
databases as well as a SPARQL interface to query the
database. This framework also provides a mapping
language to define rules for transforming relational
data and schema into RDF graphs.
Data Publication. The successful completion of
these previous steps ensured that the dataset was
available to others (both in terms of users and/or ap-
plications) that want to use it for a myriad of different
purposes. The RDF dump of the WEBIST dataset is
available for download from the WEBIST Analytics
interface.
3.3 WEBIST Analytics Application
WEBIST Analytics, a Web-based application, was cre-
ated to provide multiple perspectives of the data pro-
duced by WEBIST conferences over the 10 editions.
The proposed application is composed of analytics
tools, graphical visualisations and a simple search en-
gine that assists users in finding, uncovering and mak-
ing sense of the information available. WEBIST Ana-
lytics application can be accessed at:
http://lab.ccead.puc-rio.br/webist analytics/.
Based on the information loaded in the WEBIST
Dataset, the proposed Web application provides dif-
ferent functionalities as both exploratory search and
several analyses over the data, presented through dif-
ferent graphical visualisations. Free text search is
available over two different WEBIST graphs, the co-
authorships graph (among authors) and a more com-
plete graph composed by co-authorships and author-
ing relations (among authors and publications). It al-
lows users to search and retrieve related information
about WEBIST conferences, including an interactive
visualisation of networks. Other exploratory search is
allowed via tag cloud visualisations. In this case, the
terms in the tag cloud can be selected and the associ-
ated publications retrieved, this in turn assisting users
in finding papers related to each research topic. De-
tails about the different analyses available and their
results discussions are presented in Section 4.
4 ANALYSIS AND RESULTS
This section presents and discusses the results of the
analysis available in WEBIST Analytics. Note that the
outcomes obtained in this section were computed us-
ing the methods and metrics presented in Section 2.
4.1 General Analysis
An initial analysis of all WEBIST conferences was
conducted with regard to its authors and publications.
In this analysis we gathered 1,449 publications, which
included all full papers, short papers, posters and se-
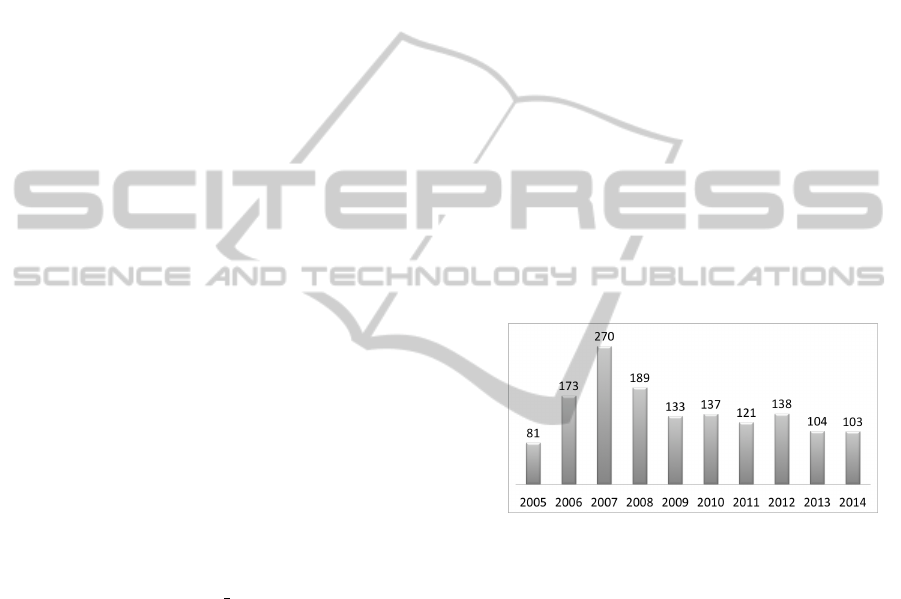
lected papers. Figure 2 depicts the distribution of the
papers over the conference editions. The number of
accepted papers reaches its peak in 2007, where 270
papers were accepted to a single conference, a fig-
ure almost twice the average number of papers ac-
cepted to other editions. This peak number of pub-
lications may be an indication of the rapid increase in
the popularity of WEBIST, and its reaching a certain
level of maturity over the years, settling on a stable
conference-size and community.
Number of papers
Conference year
Figure 2: Number of papers published per year.
A rough analysis of the community can be carried
out based on the number of authors of a scientific pub-
lication. The number of authors of a paper gives us a
hint of the average size of the community and research
groups. Across the 10 editions of WEBIST, there have
been contributions from 2,867 authors, which gives an
average of 2.91 authors per publication (with a stan-
dard deviation (σ) of 1.35, the maximum number of
authors being 14 per paper and the minimum 1). Fig-
ure 3 shows the distribution of the average number of
authors per year.
The list of topmost authors of WEBIST may re-
veal not only prolific authors, but possible experts and
supporters for future editions of the conference. The
engagement of researchers in a specific community
could be initially measured with the number of pa-
pers they have had accepted in the earlier editions of
the conference. The assumption is that if they had
over a specific number of papers, they might be eli-
KnowingthepasttoPlanfortheFuture-AnIn-depthAnalysisoftheFirst10EditionsoftheWEBISTConference
435
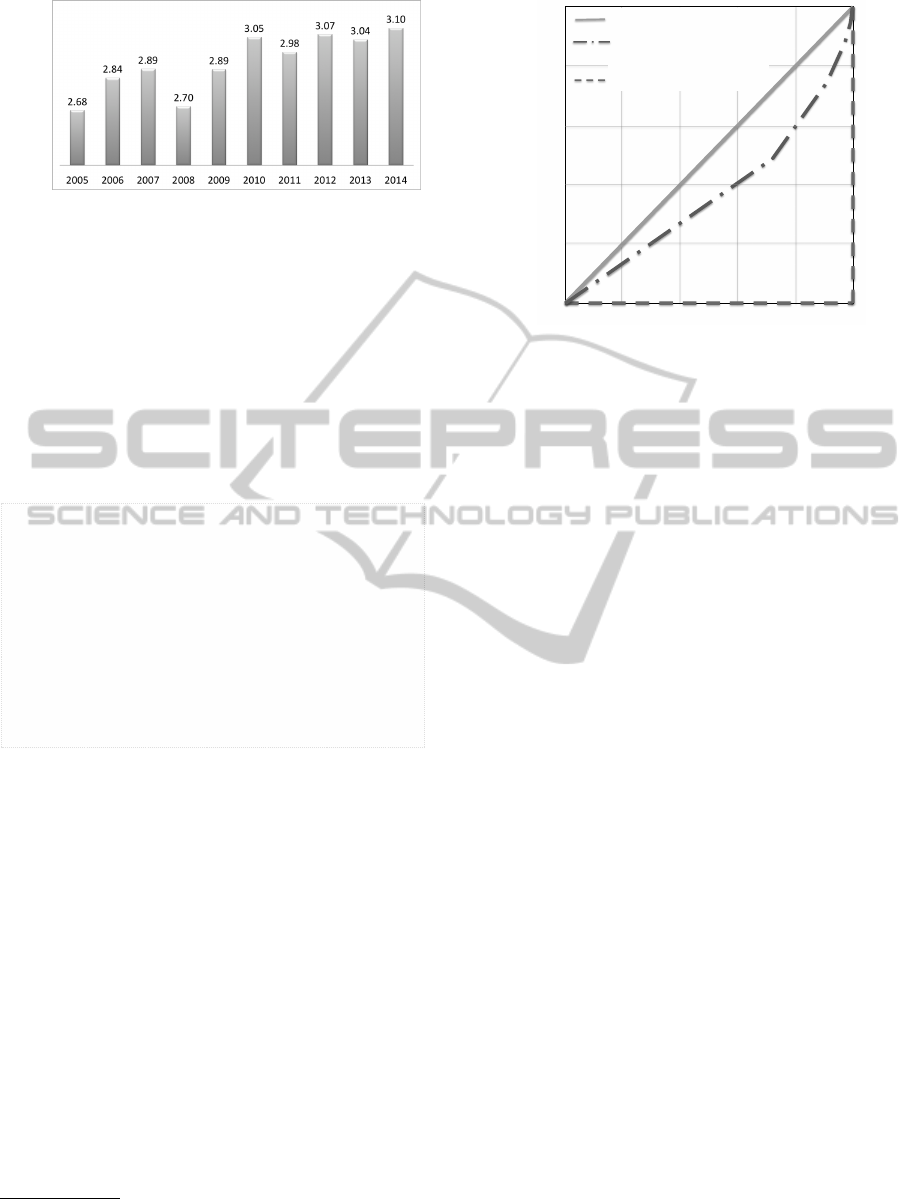
Number of (co)authors
Conference year
Figure 3: Average number of (co)authors per paper over the
conference years.
gible to make part of the program committee. After
10 editions, a total of 29 authors had more than six
papers. The most active researcher had 15 published
papers and the second had 12 papers. Figure 4 shows
the top authors as a tag cloud
10
. The size of the names
represents how active a research is in the WEBIST
conference.
08/01/15 17:24TagCrowd: make your own tag cloud from any text
Página 1 de 1http://tagcrowd.com/
Here is your PDF download link.
« Go back to edit your cloud
Christophe Cruz (15)
Christophe Nicolle (12)
Anne Boyer (10)
Christos Makris (10)
Frans A Henskens (10)
Luc Martens (9)
Toon De Pessemier (9)
Claudia Bauzer Medeiros (8) Daniel Krause (8)
Fabian Abel (8)
Li Li (8)
Maria Jose Escalona Cuaresma (8)
Monique Janneck (8)
Simon Dooms (8) Thomas Ze!erer (8) Tim A Majchrzak (8)
Wu Chou (8)
Antonia Bertolino (7)
David Paul (7)
Jose Palazzo Moreira de Oliveira (7) Juha Puustjarvi (7) Kazunori Sugahara (7)
Michael Hannaford (7)
Nicola Henze (7) Petri Vuorimaa (7) Ricardo Kawase (7) Shinichi Motomura (7)
Takao Kawamura (7)
Yamine Ait Ameur (7)
Figure 4: Top authors with more than 6 papers.
Figure 5 presents the Lorenz curve
11
along with an
analysis based on the Gini coefficient and the Robin
Hood Index (see Section 2). The Gini coefficient re-
sulted in 25.99% of inequality, while the Robin Hood
Index was 23.06%. The results show that the Lorenz
Curve is closer to the equality than to the inequality
line. This is an expected result for peer-reviewed con-
ferences, where only high quality papers are accepted
for publication. Although a few authors have 6 or
more papers in WEBIST editions, the Lorenz Curve
and the Robin Hood Index show that no redistribution
is necessary, i.e., there is no bias in accepting papers
from a research group or another, but simply merit.
A high Robin Hood Index would indicate a possible
need for further analysis in some publications.
10
http://tagcrowd.com
11
http://www.peterrosenmai.com/lorenz-curve-
graphing-tool-and-gini-coefficient-calculator
% papers
Perfect'Equality'
'
Lorenz'Curve'
Gini=25.99''Robin'Hood=23.06'
'
Perfect'Inequality'
100'
80'
60'
40'
20'
0'
0'
20' 40'
60' 80'
100'
% authors
Figure 5: Lorenz curve for the number of papers per author
distribution.
4.2 Co-authorships Network
Social Network Analysis (SNA) techniques were ap-
plied to obtain information about the co-authorships
in the WEBIST conference (see Figure 6). The anal-
ysis was conducted over an undirected graph G (de-
fined in Section 2), where the nodes represent the au-
thors and the edges represent a co-authorship between
researchers. A fraction of the co-authorship network
is shown in Figure 6, where the size of the nodes de-
notes the co-authorship connectivity. The WEBIST
co-authorships network is comprised of 2,867 authors
and 4,235 pairs of authors (edges) having at least one
co-authored paper.
Table 1 shows an analysis of the co-authorship
network using SNA measures. The analysis consid-
ers all WEBIST authors in the last 10 years.
• Average Degree shows that the authors, on the
average, have co-authored papers with 2.9 other
authors.
• Density shows a low proportion of co-authorships
in the network relative to the total number pos-
sible (situation where all authors co-authored at
least one paper with all others), only 0.1%. It rep-
resents a weakly connected network. This shows
an expected result in a conference network, where
there are different groups of authors working in
different papers. The measured modularity and
the number of communities, as explained below,
can reinforced this result.
• Modularity shows a high value representing the
strength of division of the network into mod-
ules (also called groups, clusters or communities).
Thus, WEBIST co-authorships network has co-
authorships between the authors within the com-
munities but none between authors in different
WEBIST2015-11thInternationalConferenceonWebInformationSystemsandTechnologies
436

Figure 6: A fraction of the co-authorships network.
communities.
• Number of Communities detected based on the
modularity, was 803, being exactly the same as
the Number of Connected Components. This
shows that, in the analysed network, there are iso-
lated communities that have not co-authorships in
WEBIST with the authors of the other communi-
ties.
The following analysis takes into account only the
giant component of the WEBIST network:
• Giant Coefficient represents the percentage of
authors in the Giant Component of the WE-
BIST co-authorships network, being approxi-
mately 1.57% (45 authors) of the total number
of authors that published in all WEBIST confer-
ences. These authors have 108 co-authorships
between them (2.55% of the total possible co-
authorships, i.e., if each of these authors co-
authored on at least one paper with all others).
• Diameter represents the longest of all the short-
est paths between two authors in the Giant Com-
ponent, being estimated as 8. This shows that
the farthest authors in the Giant Component have
more than six degrees of separation, based on
co-authorship in WEBIST papers. This reveals
that the Giant Component probably results from
a hierarchical structure, which is natural when
research groups of different institutions are in-
volved. The different research groups (subgroups)
are connected by “hub” authors (probably re-
search group leaders and/or professors) that col-
laborate in different research projects amongst the
subgroups, while some researches (probably stu-
dents) developed more specific tasks (sometimes
related to only one paper).
• Clustering Coefficient measures the average de-
gree to which authors in the network tend to clus-
ter together, being approximately 93.4%. This
shows that many authors belonging the Giant
Component worked with other authors that also
worked together in at least one paper.
Table 1: Social Networks Analysis from the WEBIST co-
authorships network.
Measure Value
Average Degree 2.954
Density 0.001
Modularity 0.995
Number of Communities 803
Number of Connected Components 803
Giant Coefficient
∗
0.0157
Diameter
∗
8
Average Clustering Coefficient
∗
0.934
∗
Estimated considering the Giant Component.
4.3 Authors Indices
In this section, we considered different bibliometric
indices to analyse the profiles of WEBIST authors.
As stated previously (Section 3), we identified and ex-
tracted Google Scholar Citations profiles for 26.09%
of the WEBIST authors. Thus, the analysis presented
in this section is related only to this portion of authors.
The bibliometric indices from WEBIST authors
were firstly analysed in terms of the Average and the
Standard Deviation (σ) (see results in Table 2). The
bibliometric indices, obtained from Google Scholar
Citations data, were separated into global indices, es-
timated considering all the years of the citations, and
the same indices estimated, considering only the ci-
tations since 2009. On the average, the authors pre-
sented a considerable total number of citations and
i10-index values greater than their h-index. However,
the Standard Deviation was quite high, showing that
the community, as expected in good conferences, is
formed of both young and senior researchers.
To better understand the profile of the WEBIST
authors, we performed further analyses by splitting
the authors into two groups, named A and B. We as-
signed to Group A those authors who had an overall
h-index greater than the h-index since 2009 and as-
signed to Group B those authors who had a overall
h-index equal to the h-index since 2009. This classifi-
cation assumes that the authors whose overall h-index
KnowingthepasttoPlanfortheFuture-AnIn-depthAnalysisoftheFirst10EditionsoftheWEBISTConference
437

Table 2: Average and standard deviation of number of cita-
tions and bibliometric indices from authors.
Measure Average σ
overall citations 1,634.49 4,087.46
citations since 2009 988.95 2,565.17
overall h-index 14.30 12.17
h-index since 2009 11.54 8.98
overall i10-index 28.16 54.32
i10-index since 2009 19.94 42.03
consisted solely of citations made after 2009 were re-
searchers who had started their careers more recently
than those whose overall h-index included citations
from before 2009.
Table 3 presents the results using this classifica-
tion. This table shows, for each conference year, the
percentage of authors and the respective average of
the h-index per class. The results evidence that, in all
conference editions, the number of authors in Group
A is greater than those in Group B. Also, the results
show that, in all conference editions, the average h-
index of authors in Group A is greater. Note that the
average of h-index is 18.35 for authors in Group A
considering all editions of WEBIST conference.
Table 3: Percentage and Average of h-index of scholars in
groups A and B.
year
Percentage Average of h-index
group A group B group A group B
2005 84.62% 15.38% 19.77 9.50
2006 78.65% 21.35% 18.03 8.84
2007 80.59% 19.41% 18.58 7.24
2008 63.73% 36.27% 18.38 6.95
2009 67.86% 32.14% 20.39 8.15
2010 67.03% 32.97% 18.64 7.00
2011 67.06% 32.94% 20.16 5.54
2012 57.02% 42.98% 15.65 5.39
2013 53.03% 46.97% 20.74 6.52
2014 55.56% 44.44% 19.72 4.90
All 65.64% 34.36% 18.35 6.58
4.4 Topics and Conference Areas
In this section, we analyse the topics of the papers
published over the 10 years of WEBIST conference
and their relation to the predefined main conference
areas. Firstly, Figure 7 presents, in alphabetical or-
der, the main conference areas over the different con-
ference editions. Some areas appear in all confer-
ence editions, such as Society, E-Business and E-
Government and Web Interfaces and Applications.
The third most frequent area is Internet Technology,
which appeared from the second edition to the last
one, probably as an expansion of Internet Comput-
ing (which appears only in the first conference edi-
tion). Web Intelligence and Mobile Information Sys-
tems appear more recently, in 2009 and 2012, respec-
tively. E-Learning appears only in the first four edi-
tions of WEBIST conference. This phenomenon can
be explained by the fact that the WEBIST confer-
ence, from 2009 to 2014, was held in conjunction with
CSEDU (The International Conference on Computer
Supported Education), a conference focused in inno-
vative technology-based learning strategies and insti-
tutional policies on computer supported education (e-
learning). Web Security appears only in specific edi-
tions (2005 and 2011).
Another analysis was performed over the topics
covered by the papers published in WEBIST confer-
ences. Figure 8 shows a tag cloud generated from the
terms presented in the titles of the papers. This tag
cloud represents the terms followed by their total fre-
quencies in parentheses. Moreover, the term size in
the graphic is proportional to their frequency. Terms
as web, systems, services, applications, model and
information are the most frequent. These terms are
aligned with the research focuses of WEBIST con-
ference that are technological advances and business
applications of web-based information systems.
12/12/14 14:42WEBIST Analytics
Página 1 de 1http://localhost/dblp_webist/site/index.html#
Ten Years of WEBIST Conference
Tag Cloud - All Editions
created at TagCrowd.com
web (384)
services (192)
system (191)
applications (114)
based (100)
information (93)
model (106)
data (81) development (80)
learning (78) management (77)
networks (72)
semantic (80)
approach (69)
architecture (62) collaborative (60)
design (65)
environment (63)
framework (64)
mobile (60)
ontology (59)
search (62)
study (58)
user (71) web-based (63) xml (64)
analysis (53)
community (49)
e-learning (49)
evaluation (53) integration (53)
social (53) support (54)
towards (54)
access (36) adaptive (39)
automatic (36) case (36)
content (44)
distributed (36) documents (38) engineering (43)
interaction (40)
online (44) processing (43) query (40)
recommender (37) security (35)
technology (39) tool (43)
Home Graphics Words Analysis Contact Us
Figure 8: Top 50 terms of years 2005-2014.
For a more detailed analysis, we considered the
evolution of main conference areas and terms pre-
sented in titles of WEBIST papers per conference
year. Specifically, we verified what happened to the
frequency of particular terms that are directly related
to updates in the main conference areas.
• e-Learning area was eliminated in 2009. E-
learning term was a frequent top term in titles be-
tween 2005 and 2008, but this was not true in the
following years (2009-2014).
• Web Intelligence area was included in 2009.
Terms related to topics such as information filter-
ing and retrieval, Web mining and classification
appeared in different conference years (including
years prior to 2009).
• Web Security area appears in editions from 2005
WEBIST2015-11thInternationalConferenceonWebInformationSystemsandTechnologies
438
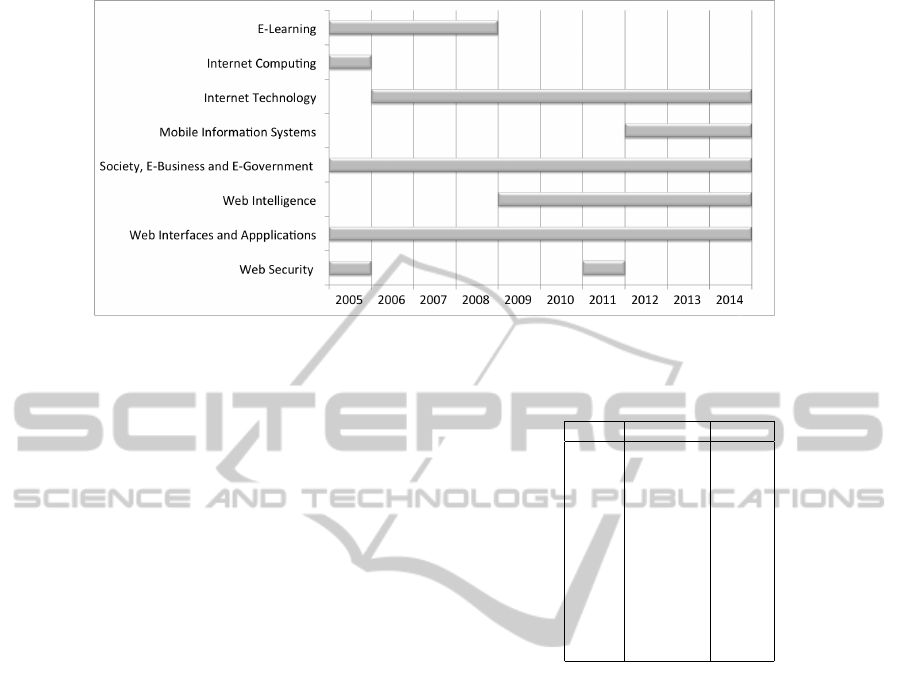
Figure 7: Main conference areas per conference year.
to 2011. The security term appears in the tag
cloud of 2005 but not in 2011. We decided to in-
vestigate the quantity of papers published in 2011
that were directly associated with this main re-
search area and discovered that only two short
papers and one poster were published. This was
probably the underlying reason which led to the
deletion of this main research area in the follow-
ing year.
• Mobile Information Systems area was included in
2012. The mobile term appears among the top
50 terms in 2012 (previously the term already ap-
peared in the first conference editions, but became
prominent only after the inclusion of the Mobile
Information Systems area in 2012).
We also studied the evolution of the top 50 terms
in the titles over a decade of WEBIST conferences.
Table 4 presents the Average and the Standard devia-
tion (σ) of the frequency of the top 50 terms. In the
first editions of the conference, for the exception of
2005, both average and σ were high, leading us to
conclude that there are likely to be terms that are re-
lated to major topics, as well as marginal topics in
the accepted papers. In the most recent of confer-
ence editions, the terms have a more equal distribution
(greater equality frequency), showing that even whilst
manifesting some peripheral change over the years,
the conference found a core that is equally evolving.
Average and σ, analyzed in conjunction, demonstrate
that the frequency of the top 50 terms (and conse-
quently the relative frequency of the conference top-
ics) is becoming more homogeneous. Moreover, a
high diversity (dispersion) was observed, i.e., there
were many terms (topics) covered by the conference
over its 10 years.
Pearson’s correlation coefficient was estimated
between the frequency of top 50 terms group from
Table 4: Average and standard deviation from frequency of
top 50 terms per conference edition.
Year Average σ
2005 4.58 3.59
2006 9.08 6.90
2007 14.74 11.68
2008 10.50 9.12
2009 7.64 6.14
2010 7.18 5.37
2011 6.72 5.32
2012 7.12 4.53
2013 5.26 3.14
2014 5.08 3.02
All 70.30 55.66
each conference edition (see results in Table 5). The
sequence of the conference editions (underlined val-
ues in Table 5), except between 2006-2007, main-
tained a consistency within the group of top 50 terms:
terms from one year correlated with the group of
terms from the following year (Pearson’s correla-
tion coefficient is positive). Moreover, the correla-
tion between the groups of top 50 terms from years
2008-2009 increased considerably compared with all
the previous years (2005-2006; 2006-2007 and 2007-
2008). This probably happened because, in this pe-
riod, the main research areas were updated, with the
removal of E-learning and the inclusion of Web Intel-
ligence.
Finally, considering the correlation between the
top 50 terms of each conference edition and of all the
others, an evolution on the research topics is shown.
The edition of 2010 presented, on average, the highest
Pearson’s correlation coefficients between their top 50
terms and all the others (being positive for all cases).
Moreover, recall from Figure 7 that WEBIST 2010
had as main research areas Internet Technology, Soci-
ety, E-Business and E-Government, Web Intelligence
and Web Interfaces and Applications, that are the only
KnowingthepasttoPlanfortheFuture-AnIn-depthAnalysisoftheFirst10EditionsoftheWEBISTConference
439

12/12/14 14:27WEBIST Analytics
Página 1 de 1http://localhost/dblp_webist/site/index.html#
Ten Years of WEBIST Conference
Tag Cloud - 2005
created at TagCrowd.com
web (24)
system (12)
applications (9)
architecture (9)
services (11)
information (8)
agent (6)
development (6)
e-learning (6)
implementation (6)
management (6)
enterprise (5)
web-based (5)
algorithm (4)
building (4)
design (4) documents (4)
e!cient (4)
framework (4)
integration (4)
learning (4)
model (4) online (4) pages (4)
security (4)
technologies (4)
analysis (3)
collaborative (3)
control (3) distributed (3)
evaluation (3)
internet (3) knowledge (3)
mining (3) mobile (3)
multimedia (3)
personalization (3) query (3) resource (3) semantic (3)
software (3)
xml (3)
characteristics (2)
environment (2)
language (2)
mechanism (2)
network (2) operations (2) organizational (2)
success (2)
Home Graphics Words Analysis Contact Us
12/12/14 14:29WEBIST Analytics
Página 1 de 1http://localhost/dblp_webist/site/index.html#
Ten Years of WEBIST Conference
Tag Cloud - 2010
created at TagCrowd.com
web (33)
systems (23)
service (18)
information (17)
semantic (14)
collaborative (10)
annotations (8)
based (9)
model (9) networks (8)
recommender (8)
support (9)
tagging (8)
approach (7)
automatic (7)
developing (7)
management (7)
towards (7)
analysis (6) application (5)
architecture (6)
data (6)
features (5) framework (5)
learning (5)
ontology (5) personalized (5)
research (5)
social (6) structured (5) study (6)
technologies (5) tool (6)
user (5)
applying (4)
building (4) business (4) case (4) classification (4)
community (4) design (4)
engineering (4) filtering (4) improvement (4)
integration (4) machine (4)
question (4) retrieval (4)
signatures (4)
xml (4)
Home Graphics Words Analysis Contact Us
(a) 2005 (f) 2010
12/12/14 14:40WEBIST Analytics
Página 1 de 1http://localhost/dblp_webist/site/index.html#
Ten Years of WEBIST Conference
Tag Cloud - 2006
created at TagCrowd.com
web (45)
learning (22)
system (23)
model (20)management (16)
services (16)
analysis (12)
based (13)
e-
learning (12) environment (13)
information (11)
web-based (12)
xml (12)
applications (9)
architecture (9)
query (10)
community (7)
data (7) design (8)
evaluation (7)
implementation (8)
integration (8)
secure (7)
support (7)
tool (8)
adapted (6)
development (6) documents (6)
educational (6)
framework (6)
interaction (6)
network (6)
ontologies (6) perspective (6) portal (6)
towards (6)
access (4)
case (5) collaborative (5)
computing (5) content (5)
mobile (5) online (5)
retrieval (4) scalable (5)
study (5) technology (5) test (4)
viewed (5) weblog (4)
Home Graphics Words Analysis Contact Us
12/12/14 14:29WEBIST Analytics
Página 1 de 1http://localhost/dblp_webist/site/index.html#
Ten Years of WEBIST Conference
Tag Cloud - 2011
created at TagCrowd.com
web (37)
service (17)
system (15)
application (12)
search (12)
community (10)
information (10)
model (10)
based (7)
content (8) data (8)
evaluation (7)
interaction (7) network (7)
recommender (7) semantic (7)
user (8)
adaptive (5) approach (5)
cloud (5) collaborative (6)
distributed (5)
framework (5) integrated (6)
managing (5)
online (6) personalized (5) processing (5)
software (5) sources (5)
supporting (5) visual (6) web-
based (5) xml (6)
challenges (4) characterizing (4)
context (4)
engineering (4) environment (4)
mining (4)
open (4)
social (4)
toward (4)
accessible (3)
development (3)
dynamic (3) e-government (3)
products (3)
study (3) supply (3)
Home Graphics Words Analysis Contact Us
(b) 2006 (g) 2011
12/12/14 14:28WEBIST Analytics
Página 1 de 1http://localhost/dblp_webist/site/index.html#
Ten Years of WEBIST Conference
Tag Cloud - 2007
created at TagCrowd.com
web (74)
services (47)
system (39)
applications (24)
based (28)
development (24)
learning (24)
design (21)
model (20)
web-based (18)
e-learning (15)
environment (17)
information (15)
management (16)
ontology (16)
approach (12)
architecture (13)
framework (13)
knowledge (12)
mobile (13)
study (13)
user (12)
xml (12)
access (11) adaptive (11) analysis (9)
automatic (10) case (10)
communities (10)
engineering (11)
online (9) resources (9) search (9) semantic (11)
support (11)
collaborative (7)
content (8)
distributed (8) documents (8)
evaluation (8) experience (8) generation (8)
integrated (8) interactive (8) interface (8)
network (8) queries (8)
similarity (7) structure (8)
teaching (8)
Home Graphics Words Analysis Contact Us
12/12/14 14:29WEBIST Analytics
Página 1 de 1http://localhost/dblp_webist/site/index.html#
Ten Years of WEBIST Conference
Tag Cloud - 2012
created at TagCrowd.com
web (28)
services (23)
network (13)
approach (12)
mobile (12)
system (11)
data (10)
ontology (9)
search (10)
social (10)
based (8)
information (8)
model (8) online (8)
user (8)
applications (6) architecture (6)
collaborative (6) community (7)
development (7) engines (6)
evaluation (7) improving (6)
integrate (6) maps (7)
processing (6)
semantic (6)
towards (7)
xml (6)
extraction (5)
knowledge (5) management (5)
security (5)
trust (5)
analysis (4)
computing (4) cross-platform (4)
design (4) distributed (4) electronic (4)
enhancing (4) filtering (4) framework (4)
policy (4) quality (4) rank (4) recommender (4)
smart (4)
study (4) tasks (4)
Home Graphics Words Analysis Contact Us
(c) 2007 (h) 2012
12/12/14 14:28WEBIST Analytics
Página 1 de 1http://localhost/dblp_webist/site/index.html#
Ten Years of WEBIST Conference
Tag Cloud - 2008
created at TagCrowd.com
web (65)
services (25) system (29)
applications (15)
data (16)
environments (14)
study (14)
approach (12)
based (13) case (11)
e-learning (13)
model (11)
towards (12) web-
based (12)
content (10) design (9)
development (10)
framework (9)
game (9)
ontology (9)
processes (9) quality (9) semantic (10)
user (10)
distributed (7) enhancing (7)
evaluation (8)
information (8) learning (7)
management (8) mining (7)
search (7)
social (8) support (8)
tool (8) virtual (7)
access (5) analysis (6) annotation (6)
control (6)
engine (5)
experience (6)
generation (6) implementation (5) integration (6)
networks (6) performance (5)
programming (5)
tagging (6) technology (6)
Home Graphics Words Analysis Contact Us
12/12/14 14:29WEBIST Analytics
Página 1 de 1http://localhost/dblp_webist/site/index.html#
Ten Years of WEBIST Conference
Tag Cloud - 2013
created at TagCrowd.com
web (19)
mobile (11)
networks (13)
social (12) system (10)
applications (8)
service (8)
data (7)
search (7) semantic (7)
xml (7)
engines (6)
framework (6)
study (6)
agents (5) analysis (5)
compression (5) design (5)
domain (5)
improving (5)
media (5)
ontology (5) profiles (5)
recommender (5)
approach (4)
discovery (4) distributed (4) environment (4)
future (4) information (4)
user (4) virtual (4)
activity (3) apps (3)
best (3) content (3) development (3) devices (3)
dynamic (3)
flexibility (3)
management (3) models (3)
practices (3) product (3)
service-oriented (3)
space (3)
test (3) towards (3) web-based (3) work (3)
Home Graphics Words Analysis Contact Us
(d) 2008 (i) 2013
12/12/14 14:28WEBIST Analytics
Página 1 de 1http://localhost/dblp_webist/site/index.html#
Ten Years of WEBIST Conference
Tag Cloud - 2009
created at TagCrowd.com
web (43)
system (20)
applications (14)
collaborative (14)
service (16)
model (12)
user (11)
based (10)
development (9)
information (10)
semantic (9)
approach (7)
architecture (8)
data (8) digital (7)
generation (7)
ontology (7)
ranking (7) search (8)
social (7) support (7)
design (6) document (6)
integration (6) learning (6) management (6)
processing (6) query (6)
visualization (6)
adaptive (4) algorithm (4)
crawling (4)
domain (5)
dynamic (4) evolution (4) extraction (4) framework (5)
interaction (5) interfaces (5) knowledge (4) method (4)
networks (4) public (5)
reputation (5) secure (5) selection (5)
structural (4) tool (4)
towards (4) xml (5)
Home Graphics Words Analysis Contact Us
12/12/14 14:30WEBIST Analytics
Página 1 de 1http://localhost/dblp_webist/site/index.html#
Ten Years of WEBIST Conference
Tag Cloud - 2014
created at TagCrowd.com
web (16)
applications (12)
data (12)
semantic (10) services (11)
based (9)
model (9)
system (9)
framework (7)
mobile (8)
user (7)
approach (6)
learning (6) measuring (6)
development (5)
evaluation (5)
management (5)
network (5)
analysis (4)
automatic (4) challenges (4)
cloud (4)
methods (4)
process (4) query (4) recommendation (4)
study (4)
xml (4)
activities (3) adaptive (3) adoption (3)
architecture (3)
community (3) composition (3) detect (3)
emergency (3) general (3) improving (3)
internet (3)
platform (3) practice (3)
public (3) search (3)
social (3)
technology (3) tool (3) topics (3) towards (3) twitter (3)
websites (3)
Home Graphics Words Analysis Contact Us
(e) 2009 (j) 2014
Figure 9: Top 50 terms per conference year.
WEBIST2015-11thInternationalConferenceonWebInformationSystemsandTechnologies
440
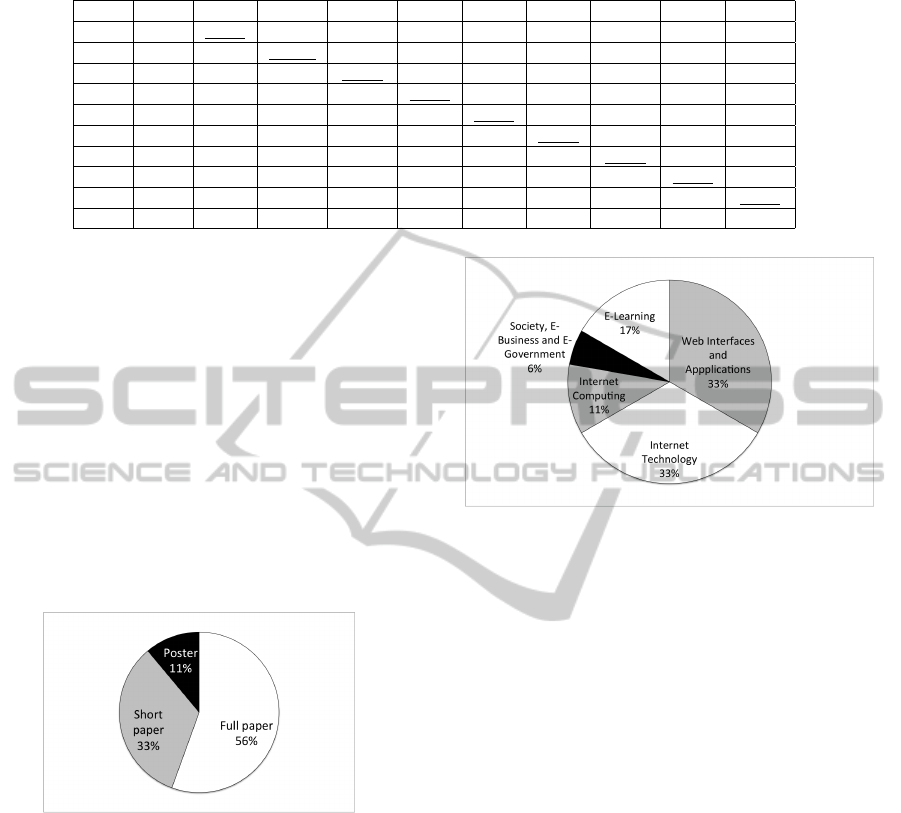
Table 5: Pearson’s correlation between the frequency of top 50 terms from each conference edition.
2005 2006 2007 2008 2009 2010 2011 2012 2013 2014
2005 0.211 0.219 -0.012 0.128 0.178 0.105 -0.004 0.082 0.080
2006 -0.035 0.390 0.241 0.205 0.059 0.253 0.294 0.170
2007 0.174 0.178 0.259 0.084 0.189 0.178 0.140
2008 0.341 0.289 0.088 -0.007 0.118 0.005
2009 0.036 0.206 0.250 0.203 0.013
2010 0.325 0.316 0.404 0.122
2011 0.175 0.245 -0.103
2012 0.135 0.106
2013 0.395
2014
areas that occur in the majority of conference editions
(the “core” of research areas).
4.5 Paper Citation Analyses
In this section, we performed an analysis related to
the WEBIST topmost cited papers (recall for Section
3 how these topmost papers were obtained) and esti-
mated the h-index for the WEBIST conference series.
The h-index obtained was 18, indicating that there are
at least 18 papers with at least 18 citations. Thus, Fig-
ure 10 presents the percentage of top 18 most cited pa-
pers per type of publication. The results show that the
most cited papers are mostly full papers (more than
50%, corresponding to 10 papers).
Figure 10: Top 18 most cited papers per type of publication.
Figure 11 presents the top 18 most cited papers
based on the percentage per main research areas. It
can be seen that the Web Interfaces and Applications
and Internet Technology areas had the highest num-
ber of most cited papers in the top 18 (around 33%
each). Surprisingly, E-Learning, which appeared only
in the first four editions of WEBIST, had a higher per-
centage (around 17%) of the most cited papers than
Society, E-Business and E-Government (around 6%)
which appeared in all conference editions. As ex-
pected, the most recent main research areas do not
have papers in the top 18 (2010 was the latest year
with a paper in the top 18).
Figure 11: Top 18 most cited papers per main research area.
5 DISCUSSION AND OUTLOOK
This paper described the WEBIST Dataset and the
WEBIST Analytics Web application. WEBIST Dataset
aggregates data from different sources and follows the
Linked Data principles. WEBIST Analytics provides
different functionalities for the search, analysis and
visualisation of data loaded in the WEBIST Dataset.
We also conducted a comprehensive analysis of
2005-2014 editions of WEBIST which showed the
rapid popularity achieved by WEBIST in 2007 and
its maturity along of the subsequent years, reaching
a stable conference-size, community of IS experts,
research topics of interest and possible supporters.
Moreover, our analysis highlighted that the unbiased
reviewing process of WEBIST contributed to the fast
advancement of IS and the generation of knowledge
for the community. The WEBIST community plays
a key role in knowledge transfer and impact in IS (h-
index =18). The Web Interfaces and Applications and
Internet Technology tracks have been crucial to the
development and popularity of the WEBIST confer-
ence series, as they accumulated the most cited pa-
pers. An important point to note and for future de-
bate between WEBIST chairs is that the extinguished
E-Learning track, which appeared only four times
as a main track, obtained a proportion of top cited
KnowingthepasttoPlanfortheFuture-AnIn-depthAnalysisoftheFirst10EditionsoftheWEBISTConference
441

papers higher than the Society, E-Business and E-
Government track, which appeared in all conference
editions. Finally, although the conference topics dis-
cussed by WEBIST authors have become more ho-
mogeneous over the last years, a higher diversity of
topics/terms has also been observed.
Furthermore, the main contribution of this paper is
not limited to the analysis of the WEBIST conference
series, but includes the dataset and the Web applica-
tion that serves as a baseline for future analysis and
debate. As future work, we intend to extend the pro-
posed workflow to analyse multiple conferences and
researchers from different fields.
ACKNOWLEDGEMENTS
This work was partly funded by CNPq under
grant 444976/2014-0, 303332/2013-1, 442338/2014-
7 and 248743/2013-9, by FAPERJ under grant
E-26/101.382/2014 and E-26/201.337/2014 and by
CAPES under grant 1410827.
REFERENCES
Batista, M. G. R. and Loscio, B. F. (2013). OpenSBBD:
Usando linked data para publicac¸
˜
ao de dados abertos
sobre o SBBD. In Brazilian Symposium on Databases
- SBBD 2013, Short Papers.
Berners-Lee, T. (2006). Linked Data. In Design Issues.
W3C.
Bizer, C. and Seaborne, A. (2004). D2RQ - Treating Non-
RDF Databases as Virtual RDF Graphs. In Proc. 3rd
International Semantic Web Conference.
Blanchard, E. G. (2012). On the WEIRD nature of
ITS/AIED conferences - A 10 year longitudinal study
analyzing potential cultural biases. In Proc. Intelli-
gent Tutoring Systems - 11th International Confer-
ence, ITS 2012, volume 7315 of LNCS, pages 280–
285. Springer.
Borges, E. N., de Carvalho, M. G., Galante, R., Gonc¸alves,
M. A., and Laender, A. H. F. (2011). An unsupervised
heuristic-based approach for bibliographic metadata
deduplication. Inf. Process. Manage., 47(5):706–718.
Chen, C., Song, I.-Y., and Zhu, W. (2007). Trends in con-
ceptual modeling: Citation analysis of the er confer-
ence papers (1975-2005). In Proc. 11th International
Conference on the International Society for Sciento-
metrics and Informatrics, pages 189–200. CSIC.
Chen, C., Zhang, J., and Vogeley, M. S. (2009). Visual anal-
ysis of scientific discoveries and knowledge diffusion.
In Proc. 12th International Conference on Scientomet-
rics and Informetrics (ISSI 2009), pages 874–885.
Cheong, F. and Corbitt, B. J. (2009). A social network
analysis of the co-authorship network of the pacific
asia conference on information systems from 1993 to
2008. In PACIS, page 23. AISeL.
Elmagarmid, A. K., Ipeirotis, P. G., and Verykios, V. S.
(2007). Duplicate record detection: A survey. IEEE
Trans. on Knowl. and Data Eng., 19(1):1–16.
Freeman, L. C. (1979). Centrality in social networks: Con-
ceptual clarification. Social Networks, 1:215–239.
Gasparini, I., Kimura, M. H., and Pimenta, M. S. (2013).
Visualizando 15 anos de IHC. In Proc. 12th Brazilian
Symposium on Human Factors in Computing Systems,
IHC ’13, pages 238–247. SBC.
Gini, C. W. (1912). Variability and mutability, contribu-
tion to the study of statistical distributions and rela-
tions. Studi Economico-Giuridici della R. Universita
de Cagliari.
Henry, N., Goodell, H., Elmqvist, N., and Fekete, J.-D.
(2007). 20 years of four HCI conferences: A vi-
sual exploration. Int. J. Hum. Comput. Interaction,
23(3):239–285.
Hirsch, J. E. (2005). An index to quantify an indi-
vidual’s scientific research output. Proc. National
Academy of Sciences of the United States of America,
102(46):16569–16572.
Hoover, E. M. (1941). Interstate redistribution of popula-
tion, 1850?1940. The Journal of Economic History,
1:199–205.
Hoser, B., Hotho, A., J
¨
aschke, R., Schmitz, C., and
Stumme, G. (2006). Semantic network analysis of on-
tologies. In Proc. 3rd European Semantic Web Con-
ference, volume 4011, pages 514–529. Springer.
Lopes, G. R., da Silva, R., Moro, M. M., and de Oliveira,
J. P. M. (2012). Scientific Collaboration in Research
Networks: A Quantification Method by Using Gini
Coefficient. IJCSA, 9(2):15–31.
Marsden, P. V. (2002). Egocentric and sociocentric
measures of network centrality. Social Networks,
24(4):407–422.
Newman, M. E. J. (2001). Scientific collaboration net-
works. I. network construction and fundamental re-
sults. Physical Review E, 64(1):016131.
Newman, M. E. J. (2003). The structure and function of
complex networks. SIAM Review, 45(2):167–256.
Newman, M. E. J. and Girvan, M. (2004). Finding and eval-
uating community structure in networks. Physical Re-
view, E 69(026113).
Posada, J. E. G. and Baranauskas, M. C. C. (2014). A study
on the last 11 years of ICEIS conference - as revealed
by its words. In Proc. 16th International Conference
on Enterprise Information Systems, Volume 3, pages
100–111. SciTePress.
Procopio Jr., P. S., Laender, A. H. F., and Moro, M. M.
(2011). An
´
alise da rede de coautoria do Simp
´
osio
Brasileiro de Bancos de Dados. In Brazilian Sympo-
sium on Databases - SBBD Posters.
Rodgers, J. L. and Nicewander, A. W. (1988). Thirteen
Ways to Look at the Correlation Coefficient. The
American Statistician, 42(1):59–66.
Wasserman, S. and Faust, K. (1994). Social Network Analy-
sis: methods and applications. Cambridge University
Press.
Zervas, P., Tsitmidelli, A., Sampson, D. G., Chen, N.-S.,
and Kinshuk (2014). Studying research collaboration
patterns via co-authorship analysis in the field of TeL:
The case of Educational Technology & Society Jour-
nal. Educational Technology & Society, pages 1–16.
WEBIST2015-11thInternationalConferenceonWebInformationSystemsandTechnologies
442
