
Enhanced LZMA and BZIP2 for Improved Energy Data
Compression
Zaid Bin Tariq, Naveed Arshad and Muhammad Nabeel
Department of Computer Science, School of Science and Engineering,
Lahore Univeristy of Management Sciences, Lahore, Pakistan
Keywords: Compression, LZMA, BZIP2, Smart Grid.
Abstract: Smart grid is the next generation of electricity production, transmission and distribution system. This is
possible through an overlayed communication layer with the power delivery layer. Due to this communication
layer smart grids produce enormous amounts of data. This data may be analyzed for improving the quality of
service of smart grids. However, handling such enormous amount of data is a challenge. LZMA and BZIP2
are two industrial strength compression techniques. In this paper we present an enhanced version of these two
schemes specifically targeted to smart grid data through a pre-processing step. Our results show that while
the original LZMA is able to compress the data size to around 80% our enhanced scheme using the pre-
processing is able to reduce the size of the smart grid data to 98% on average.
1 INTRODUCTION
Smart Grid is futuristic electricity system which uses
modern technology to come up with ways for
efficient production, transmission and distribution of
electricity. Characterization of data in smart grids is
an important activity (Tcheou et al. 2013; Styvaktakis
2013; Ribeiro et al. 2007; Bollen e al. 2009; Bollenet
al. 2009) since different communication, sensing and
embedded devices generates data that is to be
analysed for various applications like demand side
management, load forecasting, load monitoring and
so on (Tcheou et al 2013; Amin 2005; Vu et al 1997;
Vojdan et al. 2008; Ipakchi et al. 2009; Nabeel et al.
2013).
The rate of collection of data may vary according
to the application but aggregation interval as short as
200ms may also be needed by an application (Kraus
et al. 2009). For example, applications like non-
intrusive load monitoring (NILM) may require data
generated at a frequency of 16 KHz (Nabeel et al.
2013). Although the data size is relatively small as
smart meter data only contains meter id, time stamp
and meter reading. But the fast rate of data
measurement can result in large accumulation of data.
For example, meter data from a set of 10,000 houses
can reach data size of terabytes in less than a year
(techeou et al. 2013; Nabeel et al. 2013). Storage for
such large amount of data becomes a problem. But
one can argue that the storage is so cheap that it is
affordable for even large amounts of data. However,
query processing on large data sets takes a long time
and even a small query over a large data set could take
hours or even days. Therefore, there is a need to use
compression algorithms, which along with providing
better compression, are able to decompress data to its
original state.
LZMA and BZIP2 are two compression
algorithms usually used in smart grid data
compression. LZMA provides a compression
percentage of nearly 80% while BZIP2 gives a
compression percentage of 78%. We have added a
pre-processing to these algorithms that enhances the
data compression of these algorithms. In this paper
we provide details of this step and evaluate it on real
smart grid data.
The rest of the paper is organized as follows:
section 2 gives the overview of common compression
algorithms. Section 3 explains the methodology and
justification of our technique and in section 4 the
experiment, evaluation and analysis of our technique
is explained along with analysis of incorporating our
technique with other compression algorithms. Section
5 summarizes the paper along with the possible future
work.
256
Bin Tariq Z., Arshad N. and Nabeel M..
Enhanced LZMA and BZIP2 for Improved Energy Data Compression.
DOI: 10.5220/0005454202560263
In Proceedings of the 4th International Conference on Smart Cities and Green ICT Systems (SMARTGREENS-2015), pages 256-263
ISBN: 978-989-758-105-2
Copyright
c
2015 SCITEPRESS (Science and Technology Publications, Lda.)

2 RELATED WORK
For the purpose of comparing our results, we have
used LZMA and BZIP-2. Among the different
compression algorithms that have been used for
compression of power quality data, LZMA and BZIP-
2 are considered among the best for compression of
power quality data as discussed in (Techeou et al.
2013; Kraus 2009; Azoff 1994). A brief explanation
of the features of these algorithms along with selected
other compression methods is given below:
2.1 LZMA
LZMA is a type of dictionary lossless compression
algorithm that uses a large dictionary size for coming
up with a compression scheme. The basic idea is to
use various dictionary data structures to come up with
different symbols within the original file and then use
range encoder to encode these repeating symbols.
This is a variant of LZ family differs in terms of the
construction and size of the dictionary used for
compression. As illustrated in section 4, LZMA
compresses a smart grid data archive up to 83 percent
on average.
2.2 BZIP-2
The reason of using this library is because of its
prominence in compressing power quality data as
discussed in (Kraus et al. 2009). It is a type of block
sorting algorithm that uses Burrows-Wheeler block
sorting text compression algorithm along with
integrating Huffman encoding. It gives relatively
faster compression and decompression rate compared
to the conventional LZ77 which is precursor to
LZMA (LZMA SDK web. 2014). However, BZIP-2
needs better computing resources because of its usage
of block sorting mechanism. BZIP-2 gives 79 percent
compression on average as illustrated in section 4.
2.3 Differential Compression
This technique uses the similarity with the previous
readings to compress the data. It looks for the relation
between the previous value in the data and the current
value and based on this relation it takes the decision
of placing the data in its compressed format which
reduces the overall data size. This type of technique
is useful for the types of data sets which have do not
have much variations in its readings and in ideal
situations, this technique can give up to 98%
compression (Cormack et al. 1987).
2.4 PPM
Prediction by partial matching (PPM) is a technique
that uses statistical modelling of the data to predict
the upcoming values of the data and compress it
accordingly. The predictions in PPM are essentially
the symbols rankings. The technique uses previous
‘n’ symbols to come up with the statistical model and
if the prediction is not possible with the help of
previous ‘n’ symbols, then previous n-1 symbols are
utilized for coming up with a prediction. This process
is continued until the end of the data. The results as in
(Moffat 1990) shows that the technique is able to
compress 2.4b/character for English text at a very
high speed.
Our proposed strategy implements a pre-
processing to convert a smart grid archive into a
format which greatly enhances the results produced
using LZMA and BZIP2 compression technique. The
method converts an archive into a format which best
suits the LZMA and BZIP2 methods of compression.
Hence when implementing the overall compression,
LZMA or BZIP2 are considered as a black box. Using
this pre-processing the overall time and compression
efficiency are greatly improved.
3 METHODOLOGY
In this section, we provide the methodology for
pre-processing the smart grid data archive. A
record of reading from a smart meter consists
of a valid time stamp, meter id and the
corresponding current reading (Nabeel et al.
2013). For any smart grid data at high
frequency the time series is the main
component that takes the most space in the data
(Azoff 1994). Figure 1 shows the plot for thirty
sets of smart grid data. This data show that
times series consists of up to 70% of the total
smart grid data and hence can be smartly
compressed to reduce the overall data size.
A basic property of smart grid data which
helped us to come up with our enhanced
technique is the time interval in time series
data. Although the time interval may vary from
application to application in smart grids, but for
a particular application, for example for
load forecasting, the time interval between the
previous and next reading is fixed (Nabeel et
al. 2013). To demonstrate the firmness with
which this time interval property is followed,
figure 2 shows the plot of the number of
readings for which the time interval property
EnhancedLZMAandBZIP2forImprovedEnergyDataCompression
257
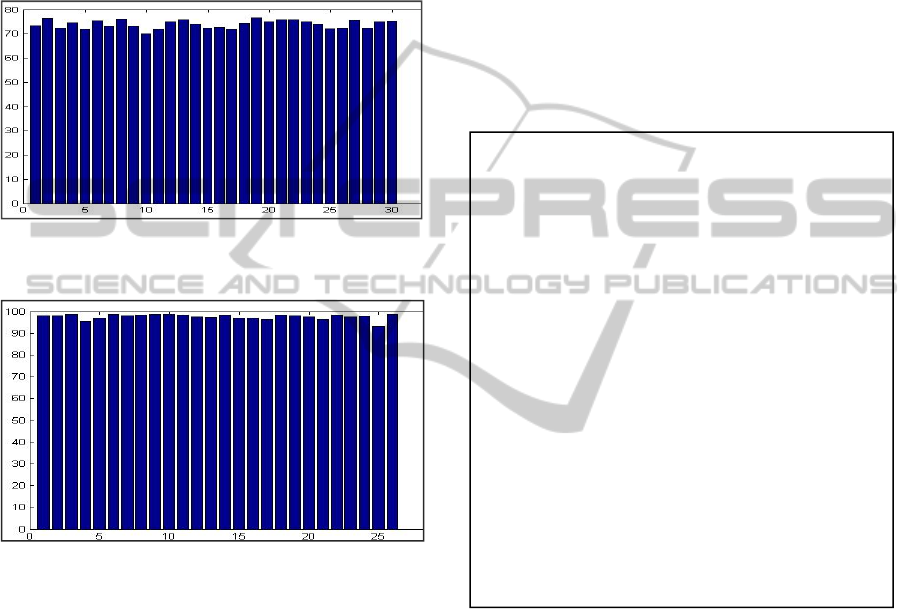
was followed. It shows that the anomaly in the
interval of the time stamp between a previous
and next time stamp is less than two percent.
Using this property of time interval of
recording a reading, we can save the
compressed file such that we can easily retrieve
the time series from it. The following
subsection provided the implementation and
details of our technique.
Figure 1 : Percentage of time stamps across thirty smart grid
data archives.
Figure 2 : Plot of percentage of time stamps for which the
time interval property was followed for thirty archives from
REDD.
3.1 Compression using Time based
Lossless Encoding (Taled)
As mentioned above, it can be inferred that we only
need to save the first time stamp of the data. After it
the next time stamp can be calculated by the addition
of previous timestamp and time interval. The rest of
the time series can be predicted by the time interval
property of smart grid data. Since the time interval of
one record of data is fixed it could be one second or
half a second or even a millisecond.
After the first timestamp is recorded the algorithm
looks for time intervals by subtracting one timestamp
reading from the previous one. If the difference is
equal to the time interval then we do not record any
timestamp of the later data. However, if the
subtracted interval is not equal to the expected time
interval then it means that we have a missing reading
in the data. Our technique records the time stamp
before and after the missing reading. This allows us
in decompressing the correct data back into its
original form. Finally, the algorithm also saves the
last timestamp of the original data. Using this
technique the new compressed file has timestamps of
start, end and before and after missed readings The
Pseudo algorithm for this technique is given below.
3.1.1 Algorithm
The following algorithm is used to pre-process the
data to remove the time stamps from the data.
3.2 Decompression using Taled
As mentioned earlier, the compressed file will contain
the time stamps and current readings. There is a high
possibility of time stamp being more than two (two
stamps will always be there, one representing the first
and second representing the last time stamp recorded)
because of the anomalous disturbance in interval or
date change as discussed previously. So we can get
the first time stamp and start saving the corresponding
current reading in a new file until our current counter
of time reaches the second time stamp saved in the
compressed file. At this point we will get the next
saved time stamp and continue saving the time and
current readings in the decompression file by again
incrementing by interval procedure as mentioned
above while still taking care of the anomalies. This
Input:File,Interval
Output:NewfilecontainingacolumnofElectric
currentreadingsandarowoftimestamps
wheretheintervalpropertywasnotfollowed
Taled_Compression(file_name, interval){
previous_time = 0
current_time=filename>first_TimeStamp;
store_timestamp_in_NewFile(current_time)
while (! end_of_file)
while(abs(previous_time-
current_time)!>Interval)
store_timestamp_in_NewFile(current_
time,previous_time);
Last_reading =current_time;
}
SMARTGREENS2015-4thInternationalConferenceonSmartCitiesandGreenICTSystems
258

process will be repeated until we reach the final time
stamp. Note that the current readings extracted from
the compressed file are saved in the same order such
that the first time stamp corresponds to first current
reading and next reading to the next time stamp saved
in decompression file (the occurrence of anomaly in
time stamps can easily be adjusted for current
reading). The pseudo algorithm for decompression is
given as under.
3.2.1 Algorithm
The following algorithm is used for decompressing
the file compresses using the method explained in
section 3.1 for removing timestamps from a smart
grid data archive
3.3 Enhanced LZMA and BZIP2
Along with the time interval property there are other
features in smart grid data that can be used to our
advantage. One of the feature is very less fluctuation
of electric current readings. This is because at any
particular time in a household, a specific number of
appliances will be under use. The time for which
these specific appliances are turned on is not short.
For example, if an air condition is turned on then there
is a high possibility that it is going to remain in ‘on’
state for a longer period. So a specific electric current
reading is going to repeat and fluctuate more around
a particular electric current value hence resulting in
high repetition of these current values.
Taking the difference of an electric current
reading from its previous reading converts the electric
current readings part of the data into high frequency
repeating symbols. In order to show this particular
trend, figure3 plots four archives taken from REDD
data set (Kolter et al. 2011). The plot shows the
percentage of each of the repeating symbols like
‘0’,’1’,’-1’ after the delta manipulation is applied to
the current readings .It can be inferred from figure 3
that these repetitions of symbols consists of high
majority of the compressed file when time based
lossless encoding along with difference of
consecutive electric current readings are taken. In all
of the four archives used, the occurrence of symbol
“0” is very high thus indicating that electric current
readings do not vary a lot in smart grids data. Also
another important observation is the very low
occurrence of the symbols other than the symbol “0”
or “1” as can be seen in all the four figures of figure
3 that the sector showing the symbols under the
“other” heading is less than 3% for all the four
archives. This particular inference sets up the basis
for the author to use LZMA and BZIP2 on this
manipulated archive. LZMA as mentioned earlier,
uses range encoder to encode the repeating symbols
in a file and BZIP2 also uses a dictionary of symbols
to compress a file. The Taled algorithm along with
difference of electric current readings helps to
increase the compression rate of the data.
4 EXPERIMENTS &
EVALUATION
To demonstrate the validity and usefulness of the
proposed technique, the power quality data provided
by REDD was used to perform the experiments
(
Kolter et al. 2011). As mentioned above, the
timestamp forms the majority of the power quality
data. As already shown above in Figure 1 the time
stamps consist of around 72 – 76 percent of the power
quality data.
4.1 Results for Time Stamp Removal
and Difference of Electric Current
Readings
For evaluating the time based compression of the
Input:filefromtheoutputofalgorithmin
section3.1.1.Interval
Output:Decompressedfilecontainingacolumn
oftimestampsandElectriccurrentreadings
Taled_Decompression(filename,Interva
l)
listTimeStamp=get_Time(filename);
list.electricCurrent=getCurrent(file
name);
timeStampPntr=listTimeStamp>head();
while(timeStampPntr!=NULL)
{
while(timeStampPntr->time!=
timeStampPntr->nxt->time)
{
timeStampPntr>time+=interval;
putinNewFile(timeStamp_pointer
->time,ElectricPntr->current);
ElectricPnte=r=ElectricPntr-
>next;
}
timeStampPntr=timeStampPntr->next;
}
EnhancedLZMAandBZIP2forImprovedEnergyDataCompression
259
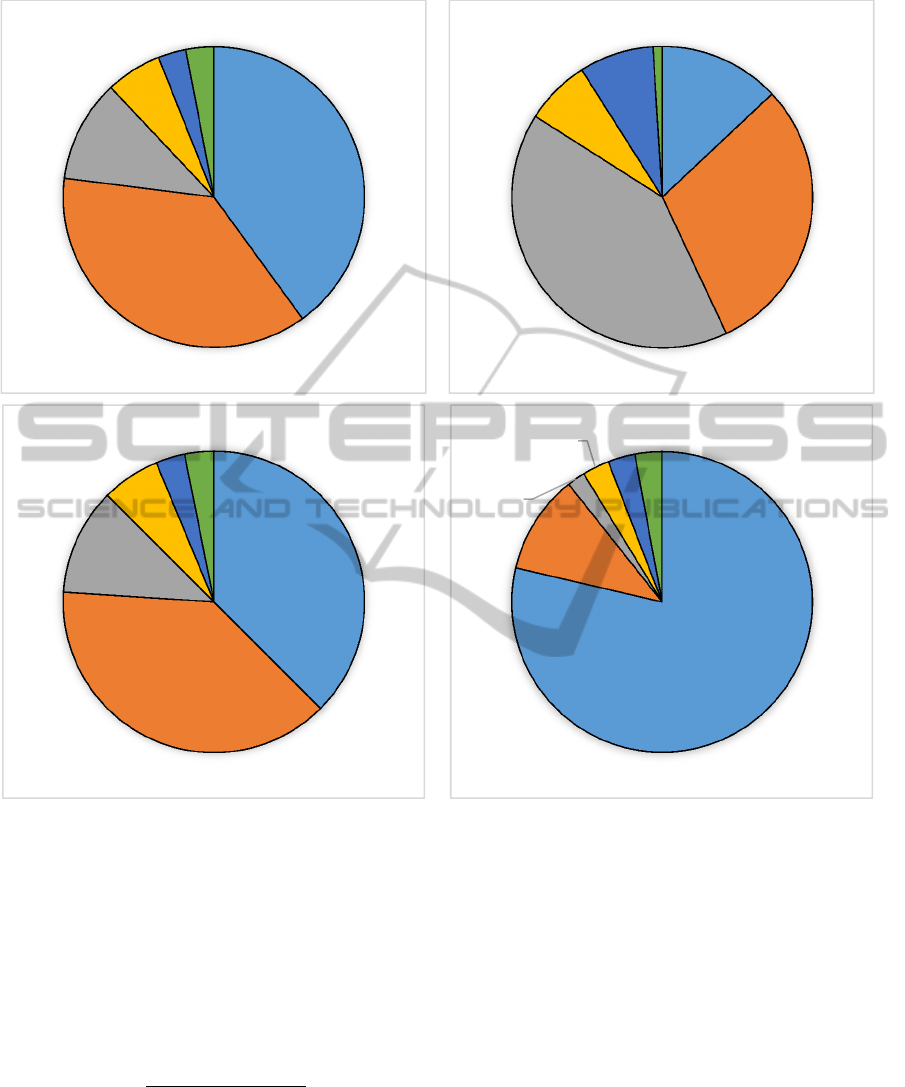
Figure 3: Plot of the percentage of symbol wise occurrence in four archives taken from REDD data set after applying Taled
technique along with the difference of the proceeding electric current readings. Each sector of the pie chart above shows the
offset of the electric current readings from its previous reading forming a symbol of form “*/-*”.
smart grid data, the technique was applied to six
archives provided in REDD data and the results are
tabulated in table 1. The parameters on which the
results were based are: compression ratio, percentage
of the original data compressed and the rate of
compression and rate of decompression. The
compression ratio is defined as under:
CR = Size of Original file
Size of compressed file
The results show the consistency of the compression
strategy for various data sets. On average 73%
compression is achieved with a variation of only 3%.
The actual time used for compression and
decompression are shown rather than the
compression and decompression rate, which may
vary according to the size of the original file. This has
been deliberately done to show that the majority of
the compression and decompression time is spent in
loading and unloading the file into the memory. The
technique (as seen from the Pseudo algorithm before),
uses time based encoding, while utilizing very less
memory thus making it a good option for the
applications which involve embedded devices or
otherwise have constrained memory.
"0"
40%
"‐1/1"
37%
"‐2/2"
11%
"‐3/3"
6%
"‐4/4"
3%
other
3%
"0"
13%
"‐1/1"
30%
"‐2/2"
41%
"‐3/3"
7%
"‐4/4"
8%
other
1%
"0"
38%
"‐1/1"
39%
"‐2/2"
11%
"‐3/3"
6%
"‐4/4"
3%
other
3%
"0"
78%
"‐1/1"
11%
"‐2/2"
2%
"‐3/3"
3%
"‐4/4"
3%
other
3%
SMARTGREENS2015-4thInternationalConferenceonSmartCitiesandGreenICTSystems
260

4.2 Comparison of Simple LZMA and
BZIP2 with Their Enhanced
Versions for Smart Grids
After pre-processing with Taled the LZMA and
BZIP-2 are applied to get even better compression
rate. Because Taled involve the loading a constant
amount of the data into the memory, differential delta
compression is also incorporated to deal with the
current readings in smart grid data. The results of the
compression by this incorporation of differential delta
encoding is tabulated in table 2. One thing to note is
that the compression ratio and percentage
compression have increase to 83% on average while
still maintaining a comparable time of compression
without incorporating the differential compression.
This idea led the author to incorporate well-known
compression techniques with Taled algorithm. The
detail of this incorporation is already discussed in
section 3.3. The evaluation of using the proposed
technique by comparing the results with well-known
compression techniques are discussed as under:
Table 1: Lossless Taled applied on six different archive.
Uncompresse
d File
size/KBs
Compresse
d file
size/KBs
Compres
sion ratio
Percentage
reduction in
size
Compress
ion/MB
per sec
27,042 7,216 3.75 73.3% 7.7
19,944 4,729 4.22 76.3 % 6.6
25,058 6,938 3.61 72.3 % 7.7
28,676 7,350 3.90 74.4 % 7.6
5,336 1,501 3.55 71.9% 7.9
14,918 3,651 4.09 75.5 % 7.8
Table 2: Results of Taled + manipulated Differential delta.
Uncompress
ed File
size/KBs
Compress
d file
size/KBs
Percentage
reduction
in
size
Time
Compres
sion/s
Time
decompre
ss-ion/s
27,042 5360 80.2% 4.5 4.2
26,456 5113 80.8% 4.4 4.1
11,664 2216 81.0% 4.0 3.9
11,663 2230 80.9% 4.1 3.9
12,032 2334 80.6% 3.9 4.0
11,721 2262 80.7% 4.2 3.7
As discussed earlier that Taled along with taking
the difference of the electric current readings converts
the smart grid data archive into a stream of high
frequency repeating symbols which sets up the base
for enhancing LZMA and BZIP2. LZMA and BZIP2
were used to compress the file along with applying
Taled algorithm. The resulting method, for the
purpose of short referral lets call it LZMA++ and
BZIP2++ respectively. The library used for
implementing LZMA and BZIP2 are in (Mofat 1990),
and the results are confirmed from 7-zip library.
REDD archives were used for confirming the author’s
method with the file size as follow: Large-211MB,
Medium-27MB, Small-11MB.
The results for the compression ratio and
percentage reduction in file size are show figure 4 and
5 respectively. The results show the benefit of using
LZMA++ and BZIP2++. Both show an increase in
percentage compression up to 99% compared to
simple LZMA and Bzip2, which compressed 80% on
average for the three types of file as seen from figure
5. Figure 4 shows the compression ratio of three files
again confirms the effectiveness of LZMA++ and
BZIP2++ for compressing the smart grid data. For
both LZMA++ and BZIP2++, the compression ratio
is more than 45. Another benefit of using LZMA++
can be seen from table 3 which also shows the results
for the time taken to compress a large file (211MB).
Figure 4: Compression of ratio of the selected techniques
along with the author’s method.
Figure 5: Percentage compression for the selected
compression techniques.
0
100
200
300
400
Large Medium Small
LZMA
BZIP2
Taled
Taled+DD
LZMA++
BZIP2++
0
20
40
60
80
100
120
Large Medium Small
LZMA BZIP2 Taled
Taled+DD LZMA++ BZIP2++
EnhancedLZMAandBZIP2forImprovedEnergyDataCompression
261

Table 3: Comparison of compression and decompression
rate of simple LZMA and BZIP2 with enhanced LZMA and
BZIP2.
Method
Compression
time/sec
Percentage
reductionin
size
Decompres
siontime/s
LZMA 172 86.3% 6
BZIP2 25 79.0% 5
LZMA++ 61 99.7% 38
BZIP2++ 38 98.1% 37
Table 4: Results for the decompression time in seconds the
six archives from REDD.
File
Size/KBs
LZMA LZMA++ BZIP2 BZIP2++
27042 2.0 4.2 1.1 4.2
26456 2.1 4.1 1.1 4.0
11664 1.9 4.0 0.9 4.0
11663 1.9 4.0 0.9 3.9
12032 1.9 3.9 0.9 3.9
11721 1.9 4.0 0.9 3.9
Table 3 shows that in case of LZMA++ for a file size
of 211MB, the time for compressing a file reduces by
3 times while still achieving 13% more compression
than simple LZMA. Table 5 gives a more elaborated
comparison of compression for wide range of file
sizes and archives for LZMA++ and BZIP2++ by
giving the compression time for wide range of file
sizes. It can be seen from Table 4 that BZIP2++
increases the compression percentage but the
compression rate is reduced because of incorporating
Taled. Table 4 also shows the comparison of
decompression rate of LZMA++ and BZIP2++ with
simple LZMA and BZIP2 for different sizes of data
archives. It can be seen that the decompression rate of
LZMA++ and BZIP2++ is considerably less than the
simple LZMA and BZIP2. From this it can be inferred
that the technique will not be useful for applications
requiring fast decompression. When deciding the use
of a specific compression algorithm, the
need/weightage of each compression percentage,
compression and decompression rate should be
considered. LZMA++ and BZIP2 will be helpful in
increasing the compression percentage (rate of
compression as well in case of LZMA++). The
stability of LZMA++ and BZIP2++ can also be seen
from the discussion above that it maintains a
percentage compression of 98% on average.
Table 5: Comparison of the time taken in seconds to
compress a file for LZMA and BZIP2 and their enhanced
versions applicable for smart grid data.
File
Size/KBs
LZMA LZMA++ BZIP2 BZIP2++
27042 17.7 7.5 4.3 4.6
26456 15.2 5.4 4.2 4.5
11664 5.6 3.2 2.2 4.4
11663 6.7 3.1 3.1 4.0
12032 6.2 3.3 1.7 3.9
11721 8.1 3.7 2.6 3.9
5 CONCLUSION AND FUTURE
WORK
The author observed that the smart grid data mainly
consists of a time stamp and current reading. It can
also be observed that around 73% of the data consists
of time stamp reading which combined with a
particular current reading is useful for the analysis of
power quality data and coming up with novel
techniques for data compression in smart grids. The
author also observes that most of the time, these time
stamps follow a particular pattern in a way that the
interval of next and previous time stamp remains
same leading to the idea of saving the compressed
power quality data file in a way such that there is no
need to compress the time stamps and hence leading
to the possibility of getting rid of 73 %(on average)
of the data before even applying compression on a
particular Smart Grid data archive. The time stamp is
saved in a way such that the interval is used to retrieve
the time stamps back when the file is decompressed.
The usefulness of this initial work is demonstrated by
improving the already available compression
technique in terms of their compression results for
smart grid data archives. For demonstrating this, the
technique was used to improve LZMA and BZIP2 to
get LZMA++ and BZIP2++ respectively. The results
show an increase in compression up to 98% on
average for both BZIP2 and LZMA. For the case of
LZMA, the time taken to compress a particular power
quality data file decreases by 3 times hence
improving its rate of compression. The current
method needs a data archive to be present at the server
or somewhere in the memory to compress the file, in
future work, there is still a need for real time
compression of the incoming readings from a smart
meter recorded readings from a particular appliance.
Our future work will address this issue.
SMARTGREENS2015-4thInternationalConferenceonSmartCitiesandGreenICTSystems
262

REFERENCES
Tcheou, M. P. ,Lovisolo, L. ; Ribeiro, M. V. ; da Silva, E.
A. B. ; Rodrigues, M. A. M. ; Romano, J. M. T. ; Diniz,
P. S. R (2014).The Compression of Electric Signal
Waveforms for Smart Grids: State of the Art and Future
Trends. Smart Grid, IEEE Transactions on (Volume:5,
Issue: 1 ) ,pp 291-302, 10.1109/TSG.2013.2293957.
Kraus, Jan,Tobiska, Tomas ; Bubla, Viktor (2009)
Loooseless encodings and compression algorithms
applied on power quality datasets. Int conference on
Elec Dist, Prague, Czech Republic.
I. Y.-H. Gu and E. Styvaktakis (2003). Bridge the gap:
Signal processing for power quality applications. Elect.
Power Syst. Res., vol. 66, no. 1, pp.
M. V. Ribeiro, J. Szczupak, M. R. Iravani, I. Y.-H. Gu, P.
K. Dash, and A. V. Mamishev (2007). Emerging signal
processing techniques for power quality applications
EURASIP J. Adv. Signal Process., vol. no 2, pp. 16–16,
June2007 [Online]. Available:
http://dx.doi.org/10.1155/2007/87425.
M. H. J. Bollen, I. Y.-H. Gu, S. Santoso, M. F.
Mcgranaghan, P. A.Crossley, M. V. Ribeiro, and P. F.
Ribeiro (2009). Bridging the gap between signal and
power. IEEE Signal Process. Mag., vol. 26, no. 4,
pp.12–31.
M. H. J. Bollen, P. F. Ribeiro, I. Y.-H. Gu, and C. A. Duque
(2009) .Trends, challenges and opportunities in power
quality research. Eur. Trans.Electr. Power, vol. 4, no.
1, pp. 2–18.
Smart grid. U.S. Department of Energy (2011).
[Online].Available:http://www.oe.energy.gov/smartgri
d.htm.
S. M. Amin and B. Wollenberg (2005). Toward a smart
grid: Power delivery for the 21st century. IEEE Power
Energy Mag., vol. 3, no. 5, pp.34–41.
K. Vu, M. M. Begouic, and D. Novosel (1997).Grids get
smart protection and control. IEEE Comput. Apps.
Power, vol. 10, no. 4, pp. 40–44.
A. Vojdani (2008). Smart integration. IEEE Power Energy
Mag., vol. 6, no. 6, pp. 71–79.
A. Ipakchi and F. Albuyeh (2009). Grid of the future. IEEE
Power Energy Mag., vol. 7, no. 2, pp. 52–62.
EPRI (2011). Smart grid demonstration-integration of
distributedenergyresources.[Online].Available:http://w
ww.smartgrid.epri.com/Demo.aspx.
M. Nabeel, F. Javed, N. Arshad (2013). Towards Smart
Data Compression for Future Energy Management
System. Fifth International Conference on Applied
Energy, Pretoria, South Africa, 1-4.
O. N. Gerek and D. G. Ece (2008). Compression of power
quality event data using 2d representation. Elect. Power
Syst. Res., vol. 78, no. 6, pp.1047–1052.
"Bzip2 and Libbzip2, Version 1.0.5." Bzip2. N.p., n.d. Web.
20 Nov. 2014. http://www.bzip.org/
E. Michael Azoff (1994). Neural network time series
forecasting of financial markets. John Wiley & Sons,
Inc.
J. Zico Kolter, Matthew J. Johnson (2011). REDD: A
Public Data Set for Energy Disaggregation Research. In
proceedings of the SustKDD workshop on Data Mining
Applications in Sustainability.
LZMA SDK (Software Development Kit). LZMA SDK
(Software Development Kit). 2014.
Moffat, A. (1990). Implementing the PPM Data
Compression Scheme. IEEE Transactions on
Communications 38.11: 1917-921. Web http://
www.7-zip.org/sdk.html.
G. V Cormack, R. N. S. Horspool (1987). Data
Compression Using Dynamic Markov Modelling. The
Computer Journal, 30(6):550.
EnhancedLZMAandBZIP2forImprovedEnergyDataCompression
263
