
Combined Visual Comfort and Energy Efficiency through True
Personalization of Automated Lighting Control
C. Malavazos
1
, A. Papanikolaou
1
, K. Tsatsakis
2
and E. Hatzoplaki
2
1
GrinDrop Ltd., 29/B Harley str., W1G 9QR, London, U.K.
2
HYPERTECH S.A., Perikleous 32, Chalandri, 15232, Athens, Greece
Keywords: Energy Efficiency, Visual Comfort, User Profiling, Automated Lighting Control, Human-centric Lighting.
Abstract: Lighting consumes a sizable portion of the energy consumed in office buildings. Smart lighting control
products exist in the market, but their penetration is limited and even installed systems see limited use. One
of the main reasons is that they control lighting based on universal set-points agnostic to individual human
preferences, thus hampering their comfort. This paper presents an automated lighting control framework
which dynamically learns user lighting preferences, models human visual comfort and controls light dimming
in a truly personalized manner so as to always control the comfort vs. energy efficiency trade-off. It effectively
removes the most important complaint when using such systems - loss of comfort - and paves the way for
their wider scale adoption in order to untap the energy reduction potential of commercial lighting.
1 INTRODUCTION
Lighting is a major (over 30%) electricity end-use in
office buildings (US Department of Energy, 2010)
(El-TERTIARY Project, 2008) (US Department of
Energy, 2013). Significant cost savings are possible
using intelligent lighting control systems. Such
systems have long been available, albeit with limited
success in massively penetrating the building stock.
The main barrier has been their acceptance by
occupants. Existing systems tend to be intrusive and
to adjust indoor luminance to pre-defined set-points
for “optimal” lighting levels. This fails to take into
account the diversity and heterogeneity of visual
comfort zones of humans, leading to complaints
about the lighting adequacy, manual bypassing of
automated controls and ultimately abandonment of
lighting control systems’ operation.
To leverage the untapped potential for reducing
lighting-related energy consumption, the visual
comfort of occupants should be treated as a main
optimization parameter. This paper presents THOR, a
framework for automated lighting control in
commercial buildings. Its application in real-life pilot
trials has demonstrated tight control of occupant
visual comfort and combined gains in energy
efficiency and visual comfort compared to a
conventional set-up where occupants dim their lights
manually using wall-mounted dimming switches.
The THOR framework non-intrusively senses
ambient conditions and occupant corrective actions
(or lack thereof) to infer a stochastic personalized
visual comfort model. Combining the model with
real-time sensed lighting conditions, it identifies
opportunities for energy reduction that affect visual
comfort in a controlled manner. The trade-off
between minimum allowable occupant comfort and
energy reduction gives rise to alternative strategies to
steer the automated lighting control.
All currently available building control solutions
use predefined universal control strategies that
always sacrifice individual comfort. Individual
preferences are captured manually requiring lengthy
surveys and significant system calibration effort.
These systems cannot automatically adapt to changes
in workspace occupancy or individual preferences.
Moreover, occupant preferences are seldom
conscious and feasible to extract. THOR tackles these
issues by allowing facility managers to automatically
optimize building control strategies that balance
global operational goals with real time office-level
needs based on individual and group level
preferences. Control strategies trading-off energy
efficiency and comfort can be established;
maximizing comfort (Comfort Mode) with some
savings, or maximizing savings (Energy Efficient
Mode) with controlled discomfort.
264
Malavazos C., Papanikolaou A., Tsatsakis K. and Hatzoplaki E..
Combined Visual Comfort and Energy Efficiency through True Personalization of Automated Lighting Control.
DOI: 10.5220/0005455602640270
In Proceedings of the 4th International Conference on Smart Cities and Green ICT Systems (SMARTGREENS-2015), pages 264-270
ISBN: 978-989-758-105-2
Copyright
c
2015 SCITEPRESS (Science and Technology Publications, Lda.)

2 STATE OF THE ART
Currently available models and technological
solutions in commercial environments do not
adequately capture the relationship between energy
efficiency and occupants’ comfort. Modern building
management practice has no modelling tools that
sufficiently deal with occupant activities and personal
preferences (Robinson 2006) (Zimmermann, 2003 &
2006).
(Shen et al, 2014) provide a comprehensive
overview of integrated lighting control techniques
proposed and evaluated in the literature in the past
years. Personalization in lighting control is
synonymous to lighting set-points according to policy
recommendations for office/computer work. This
highlights the lack of true personalization according
to user preferences in the recent literature.
Some works have introduced limited occupancy
or user profiling to improve on energy efficiency,
especially in the domain of Building Management
Systems. Both (Singhvi, 2005) and (Wen, 2008) track
occupant location and balance their lighting
preferences with energy consumption. In a similar
approach, (Chen, 2009) proposes a building control
system that manages real-time location and retrieves
personal preferences of lighting, cooling, and heating.
(Dong, 2009) uses the number of occupants to define
the building power demand and thus the extraction of
occupancy is a significant variable to increase model
accuracy. Incorporating a user profiling framework is
crucial to clearly define user preferences that set
constrains to the automation mechanism.
Our main differentiator is true personalization of
lighting control, even when individual occupants
cannot quantitatively express their visual comfort
preferences. Instead of using the assumption of a
given set-point for target luminance (either an
average for all occupants or a set-point per occupant),
THOR utilises occupant profiling techniques to infer
and quantify individual occupant preferences. This
allows lighting control that is human-centric and truly
personalized to the preferences of each user, while
minimizing calibration and commissioning effort and
cost since set-up effort is significantly reduced.
3 THE THOR FRAMEWORK
This paper introduces THOR, a holistic framework
for personalized lighting control in commercial
buildings, based on the premise that proper lighting
control should incorporate energy efficiency together
with occupant comfort. It delivers accurate, “context
aware” occupant visual comfort profiles that are
generated and are continuously adapted to low-level
ambient sensor, energy consumption and user control
data. Occupant visual comfort profiles encapsulate all
important personalized and lighting-related
preferences of occupants and are used to steer diverse
lighting control strategies that provide reduced
energy consumption and improved comfort levels.
THOR is an "event-driven” Service Oriented
Architecture built around an innovative occupant
profiling mechanism continuously analysing ambient
information and deriving dynamic models of
occupant comfort & preferences. An intelligent
infusion engine collectively analyses asynchronous
events over different time periods and correlates them
into causal relationships, thus detecting event patterns
and event relationships that span over longer time
periods (from seconds to months). The occupant
visual comfort profiles are subsequently used to
deliver personalized, occupant-centric, energy
efficient lighting control services.
The THOR core profiling engine has inherent
support for modelling human-centric visual comfort.
Visual (dis)comfort is an obscure concept due to the
multiplicity of variables affecting it and the difficulty
of reconciling aesthetic and physiological elements.
Even the discovery of a "perfect" common model and
metrics of visual discomfort would not make
modelling and control universally accepted because
different occupants perceive light in very different
ways. Only a fully adaptive control approach which
adapts to individual occupants can provide the
necessary flexibility to satisfy their divergent
preferences. Our work aims at establishing dynamic
user profiles that quantify the visual discomfort of
occupants based on the analysis of evidence captured
exclusively from the observation of users' control
actions under specific luminance conditions.
3.1 Integrated Learning Model of User
Preferences
THOR continuously and collectively processes
various asynchronous events captured in live
information streams and analysed by an intelligent
infusion engine to generate dynamic occupant
behavioural profiles. Occupant profiles are:
“context-aware”: they relate occupant actions or
lack of actions representing his comfort under the
specific environmental conditions,
“dynamic”: they continuously adapt to sensor
information capturing seasonal patterns.
Occupant behavioural profiles constitute the point
CombinedVisualComfortandEnergyEfficiencythroughTruePersonalizationofAutomatedLightingControl
265
of reference, defining and quantifying in real-time the
“boundaries” and “cost” of visual comfort. Three
types of events are analysed: a) occupancy events:
presence information, b) luminance events: w.r.t
variations in the room luminance and, c) control
action events: triggered by occupants acting on the
operational status of lighting.
The profiling engine analyses actions and lack of
(re)-actions under given ambient conditions using a
Bayesian Engine to correlate events and generate
personalized (dis)comfort indicators to build
occupant dynamic profiles. The formalism can be
generalised as follows:
w* Pr(Envir | Disc)
Pr(Disc | Envir)=
w* Pr(Envir | Disc)+(1- w)* Pr(Envir | Comf)
w: weight factor
Pr(Disc | Envir)
: Discomfort level given the
luminance conditions
|Pr(Envir Disc)
: Luminance state probability given
the discomfort level as explicitly indicated by the
occupant
|Pr(Envir Comf)
: Luminance state probability given
the comfort level as explicitly and implicitly indicated
by the occupant.
The formula estimates the probability that the
occupant is uncomfortable in the current ambient
conditions, given the probabilities of environmental
conditions where he feels (dis)comfort. These
probabilities are calculated either on-the-fly upon
system usage or from historical data. The former
corresponds to a real deployment scenario; the latter
to the experimental setup of this paper where
luminance information is collected from user
premises to monitor his light adjustment actions.
We should highlight the distinction between the
definitions of explicit and implicit comfort. Explicit
(Dis)Comfort refers to occupant (dis)comfort as it can
be extracted from physical actions he undertakes to
customize the lighting settings to his liking. When a
user intentionally and consciously adapts the ambient
luminance, two conclusions are inferred: he is
uncomfortable with the current setting and the target
conditions make him comfortable. Both set-points
provide valuable information regarding user
preferences and are a trustworthy estimation of his
visual comfort. Implicit Comfort, on the other hand,
refers to the occupant comfort as it can be inferred by
a lack of action. If he is present and not reacting to
current luminance, we infer information about his
comfort. This information is valuable because it is
used to understand his tolerance to luminance
variations, a metric that is hard to capture directly.
The weight (w) in the formula is dynamically
adjusted, it balances the importance of explicit vs
implicit information in quantifying the discomfort
probability. Implicit information is generally more
difficult to collect and interpret. So, this factor
initially assigns more weight to the discomfort
component (explicit information) and gradually shifts
toward the comfort component as time passes and the
system better learns the user preferences.
3.2 Occupant Visual Comfort
Modelling
Live data streams were collected, pre-processed,
normalized and analysed for 12 months (Nov. 2013
to Nov. 2014) from various types of pilot premises
(commercial offices, university campuses, university
clinics) involving different types of spaces (single
occupant offices, multiple occupants spaces, waiting
rooms, coffee places, meeting rooms, etc.). A day
sample of collected luminance data and the user’s
manual control actions is illustrated in Fig. 2.
Clustering techniques were used to robustly identify
the boundaries (luminance levels) of user control
actions (both preferred and unfavourable states).
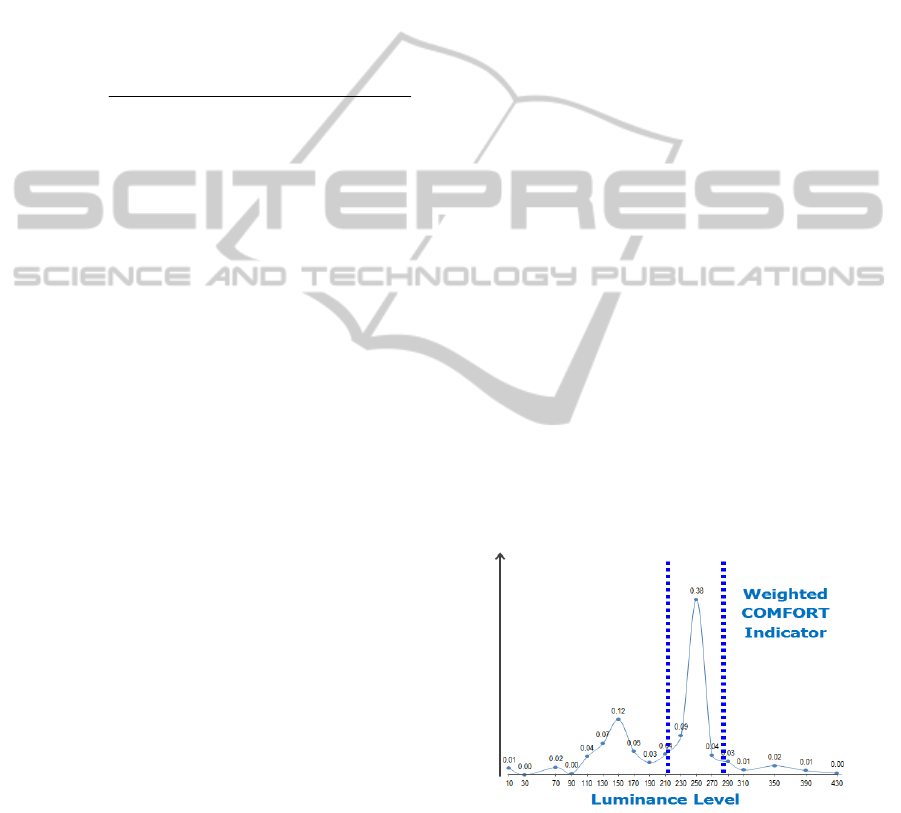
Two core indicators are dynamically inferred by
the THOR profiling engine: a) a weighted comfort
indicator (Fig. 1) and b) a similar weighted
discomfort indicator, reflecting the amount of
occupant comfort and discomfort under different
luminance levels. Subsequent clustering techniques
of neighbouring luminance levels, with high and low
comfort values, reveal major comfort and discomfort
zones, highlighted in Fig. 1.
Figure 1: Weighted Comfort Indicator.
Both indicators contain a temporal attribute, allowing
us to model and/or predict how (dis)comfort varies
over time when remaining under certain luminance
conditions. This proves to be a decisive factor when
evaluating and eventually deploying alternative
energy efficiency strategies, which consist of the
SMARTGREENS2015-4thInternationalConferenceonSmartCitiesandGreenICTSystems
266
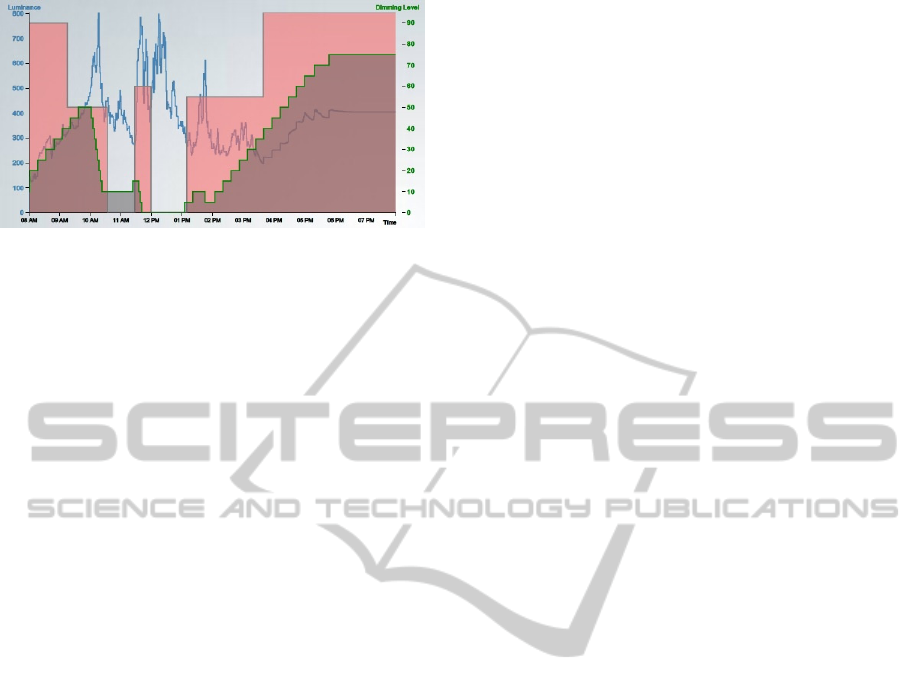
Figure 2: The "Wise" strategy applied in the "South" office
on a cloudy day. (Volatile line - luminance; Upper/coarse
step-wise line – manual; Lower/fine step wise line –
automated actions).
optimal coordination of multiple local control actions
with varying durations. This way, appropriate
combinations of demand shaping strategies can be
designed, executed and re-adjusted based on the
cumulative discomfort caused at each point in time.
The comfort and discomfort indicators calculation
process is based on a Hidden Semi-Markov Model
(HSMM), a doubly stochastic process that can
estimate the occupant comfort and discomfort with
respect to the time that she stays in the same
conditions. The state transition probability depends
on the current state duration and the explicitly
observed transitions from the current state, due to the
occupant reactions. The combination of all the
separate probabilities determines the final calculated
comfort and discomfort indicator as a function of the
luminance level and time.
3.3 Automated Personalized Control
Strategies for Offices & Homes
THOR’s key strength is that it leverages the coarse
granularity of manual dimming actions, who are
unlikely to fine-tune dimming to a level that exactly
matches their comfort zone. This can partly be
attributed to the difficulty to internalize visual
comfort as a concept. Most office occupants will have
a wide range of luminance levels where they feel
comfortable enough for professional activities. When
manually dimming lights, however, they will seldom
look for the lowest possible dimming level which lies
within the comfort zone so as to simultaneously
optimize comfort and energy efficiency.
To automate this process we have developed an
"event-driven” service oriented framework (SOA 2.0)
for adaptive and personalized lighting control,
evolving around an innovative consumer profiling
mechanism. The framework analyses real-time events
and ambient information while it utilizes
user/occupant profiles to deliver personalized, human
centric demand side management services. The user
profile models continuously adapt to real-time events
and are used by different automated lighting control
strategies aiming at maximum comfort, energy
efficiency or compromises of the two.
THOR delivers timely, non-intrusive, multi-
modal and personalized ambient services that
discretely learn occupants and safeguard their
preferences under different control scenarios.
Occupant profiling is implicit. Different views, from
simple real-time hints to detailed historical analytics
and data mining, are provided (Fig. 2). These views
are effective in improving building energy efficiency
strategies and increasing occupant awareness by
triggering sustainable behaviours. Engagement is
improved by revealing intrinsic user profiles related
to unconscious behavioural preferences. Information
is timely (the right information at the right time),
context-sensitive (taking into account real-time
conditions) and ambient (exploiting sensing means).
Finally, the visual analytics allow facility managers
to thoroughly evaluate the effect and cost of different
strategies, leading to human centric strategies that
balance different and often conflicting performance
factors like energy efficiency and comfort.
THOR is designed to facilitate three different
modes of operation: (i) comfort, (ii) wise and (iii)
energy efficient. The three modes differ on the weight
of user comfort and achievable energy reduction
during the dimming optimization. In the comfort
operational mode, the system seeks ways to reduce
total energy consumption, while ensuring maximum
user comfort. In the wise operational mode it operates
in a similar mode, but is more sensitive to the noticed
luminance changes to which it reacts more quickly
and more accurately. Occupant comfort is again the
highest priority, but it is achieved with more precise
and less generous dimming actions. Finally, the
energy efficient operational mode aims to minimize
energy consumption allowing to the system to
sacrifice user comfort, albeit in a controlled manner.
During energy efficient operational mode, the system
may jeopardize the user’s comfort for small time
periods if energy gains are significant, but never to
the point where the user will experience discomfort.
4 PRELIMINARY RESULTS
The proposed framework has been trained,
successfully validated and thoroughly evaluated on
various tertiary premises (commercial offices and
academic institutions) and different application
CombinedVisualComfortandEnergyEfficiencythroughTruePersonalizationofAutomatedLightingControl
267
scenarios within the context of FP7 research projects.
The following experiment illustrates its performance
after training with the data set mentioned in Section
4.2. Automated control was simulated on two single-
occupant offices; one facing south and one north.
Real luminance data was collected for two days, a
sunny and a cloudy day. The office windows have a
different orientation so the acquired luminance
profiles for the same day (sunny or cloudy) are not
identical. Lighting was monitored between 08.00 and
20.00 on working days to represent typical office
hours. Table 1 depicts the results of simulating (on the
collected data) three control strategies.
The preferences of the two occupants are quite
different. The South office occupant prefers roughly
450 lux and the North office occupant about 400 lux.
Moreover, the observed dead-band, i.e. the range
where the user is unlikely to react and correct the light
conditions, is about 550 lux to 390 lux for the South
occupant and 490 lux and 350 lux for the North
occupant. The North occupant prefers less light, but
is more sensitive to light changes in his environment.
The “manual” entry in Table 1 indicates the
results collected from the real-user manual actions.
Occupants were asked to control lights manually to
provide a baseline for comparing the performance of
the lighting control engine and its strategies. Ambient
conditions were meticulously recorded during the
experiment. Automated control strategies’ results
were obtained by simulating the strategies for two
distinct days (cloudy & sunny).
The average needed time for the learning
algorithm to converge to an accurate (dis)comfort
indicator ranges from one to two weeks according to
the data available. This assumes that ambient
luminance varies sufficiently so that the occupant
performs enough explicit actions to let the system
learn. After this period the learning model can be over
90% accurate on the estimation of user comfort.
Accuracy further improves with time; after two
months average accuracy is about 96%. The likely
seasonality of user profiles is taken into account
during the learning process by attaching greater
weight to most recent luminance and control events
of the last 2 months. So, the learning mechanism is
more versatile in both the seasonal light level changes
and a possible change of the occupant in the office.
The “comfort” strategy (Table 1) maximizes the
time when the occupant is in his high comfort zone,
i.e. above 90%. The “wise” and “energy efficient”
strategies achieve smaller high comfort time periods.
As indicated by the results, occupant comfort is
slightly sacrificed for energy savings. Nevertheless,
occupant comfort is always preserved above 70%.
The results of applying the three control strategies
are shown in Table 1. Several conclusions can be
deducted. In sunny days occupants are more
comfortable due to the abundance of natural light and
they use artificial lights less, hence potential energy
gains are lower. This is also reflected by the lower
average dimming throughout the day compared to
cloudy days. Daylight limits the need for artificial
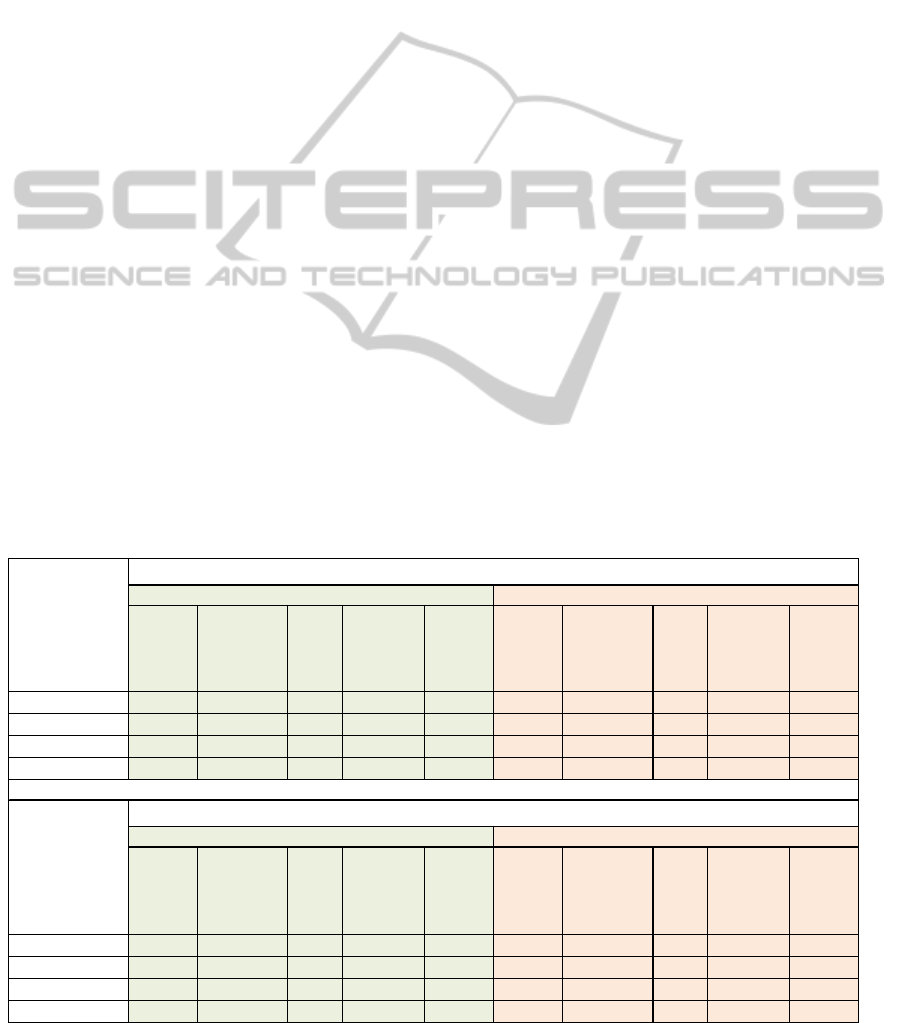
Table 1: Comparison of achieved energy efficiency and occupant comfort for a two offices/occupants different control
strategies in two different days.
Average
Occupant
Comfort
TimeinHigh
Comfort
Zone
Energy
Savings
Average
Luminance
Average
Dimming
Level
Average
Occupant
Comfort
TimeinHigh
Comfort
Zone
Energy
Savings
Average
Luminance
Average
Dimming
Level
Comfort
91.35 % 446 min 15.7 % 419.77 Lux 45.7 % 92.95 % 363 min 11.5 % 557.09 Lux 29.1 %
Wise
82.56 % 275 min 29.2 % 369.25 Lux 35.5 % 85.85 % 184 min 22.1 % 529.65 Lux 23.8 %
EnergyEfficient
74.16 % 99 min 44.4 % 342.27 Lux 28.5 % 77.64 % 67 min 36.5 % 504.32 Lux 18.4 %
Manual
88.78 % 308 min - 517.09 Lux 63.4 % 94.19 % 357 min - 588.83 Lux 35.3 %
Average
Occupant
Comfort
TimeinHigh
Comfort
Zone
Energy
Savings
Average
Luminance
Average
Dimming
Level
Average
Occupant
Comfort
TimeinHigh
Comfort
Zone
Energy
Savings
Average
Luminance
Average
Dimming
Level
Comfort
92.9 % 483 min 17.4 % 388.6 Lux 39.3 % 94.08 % 355 min 12.2 % 500.09 Lux 25.5 %
Wise
84.7 % 343 min 29.1 % 344.62 Lux 30.9 % 86.49 % 191 min 23.4 % 473.41 Lux 20.3 %
EnergyEfficient
75.9 % 111 min 44.4 % 307.8 Lux 23.2 % 77.6 % 60 min 40.6 % 450.23 Lux 15.4 %
Manual
89.07 % 368 min - 452.32 Lux 51.0 % 94.59 % 337 min - 526.84 Lux 30.6 %
Occupant2("North"office)
Cloudyday‐luminanceprofile Sunnyday‐luminanceprofile
Cloudyday‐luminanceprofile Sunnyday‐luminanceprofile
Ocupant1("South"office)
SMARTGREENS2015-4thInternationalConferenceonSmartCitiesandGreenICTSystems
268

lighting and the slack for energy optimization, so
automated lighting control can produce lower
(absolute and relative) efficiency gains compared to
“darker” days when artificial light is used more.
Results indicate that subject occupants, when
manually adjusting dimming levels, consistently keep
the lights at higher luminance levels compared to
their comfort zone boundary. This slack is used by the
automated control to produce energy savings. This is
a natural human reaction and has been consistently
observed in all collected measurements so far.
A related side-effect is that the “comfort”
automated strategy performs consistently better than
the manual control. Users are likely to tolerate some
discomfort to avoid the inconvenience of going to the
lighting switch to dim the lights (Figure 2). The area
between the two step-wise lines is a proxy of the
possible energy savings by automated control. As
shown in Table 1, 29.2% less energy is used by the
“Wise” strategy for a 6.22% sacrifice in comfort of
the occupant (from 88.78% to 82.56%).
Also, it is possible and practical to implement
several control strategies which span the entire energy
efficiency vs. occupancy comfort continuum. Tight
comfort control removes the main entry barrier for the
widespread uptake of automated lighting control
solutions. Controlling user (dis)comfort allows the
facility manager to gain energy efficiency from day
one without hampering occupant comfort – and
potentially progressively further enhancing energy
efficiency by trading off some comfort.
THOR allows automated lighting control systems
to consistently improve occupant visual comfort and
reduce energy consumption compared to manual
control. The two key enablers are: i) the learning
algorithm that unambiguously quantifies personal
visual comfort preferences and improving acceptance
levels for automated lighting control strategies and,
ii) the continuous monitoring of ambient conditions
that provide the necessary stimuli to the automated
lighting control.
5 RESIDENTIAL LIGHTING
CONTROL APP
A residential version of THOR has been developed
for mobile devices. It uses available gateways to dim
the lights and uses sensors (cameras, luminance
sensors, movement sensors) existing on devices to
offer enhanced functionality for personalized
(comfort based) light control. A free version, called
Hue Mate, offering automated personalized light
control of Philips Hue lights is available in Google
Play and App Store.
6 CONCLUSIONS AND FUTURE
WORK
This paper introduces THOR, an innovative
framework for automated, personalized lighting
control in commercial buildings. It is based on a
dynamic occupant profiling mechanism constantly
adapting to real-time events and ambient information.
The core behavioural profiling engine is transparent
and entirely implicit, requiring no direct occupant
feedback. Integrated but flexible control strategies
can reach high levels of savings and comfort. Pilot
assessment indicated more than 10% energy savings
retaining comfort levels above 90% or more than
35% savings retaining comfort levels above 75%.
REFERENCES
US Department of Energy, 2010. Buildings Energy Data
Book.
El-TERTIARY Project, 2008. Monitoring Electricity
Consumption in the Tertiary Sector.
US Department of Energy, 2013. Analysis and
Representation of Miscellaneous Electric Loads in
NEMS.
Zimmermann, G., 2003. Modeling the building as a
system”, In 8th International IBPSA Conference. p.
1483 – 1490.
Zimmermann, G., 2006. Modeling and simulation of
dynamic user behavior in buildings - a lighting control
case study”, In eWork and eBusiness in architecture,
engineering and construction: Proceedings of the 6th
European conference on product and process
modelling. p. 309-316, Taylor & Francis Group.
Robinson, R., 2006, Some trends and research needs in
energy and comfort prediction. In Proceedings of
comfort and energy use in building, Windsor, UK.
V. Singhvi, A. Krause, C. Guestrin, J.H. Garrett Jr., H.S.
Matthews, 2005. Intelligent light control using sensor
networks. In Proceedings 3rd International Conference
on Embedded Networked Sensor Systems. pp. 218–229.
Y.-J. Wen, A. Agogino, 2008. Wireless networked lighting
systems for optimizing energy savings and user
satisfaction, In Wireless Hive Networks Conference, pp.
1–7.
H. Chen, P. Chou, S. Duri, H. Lei, J. Reason, 2009. The
design and implementation of a smart building control
system. In IEEE International Conference on e-
Business Engineering, pp. 255–262.
B. Dong, B. Andrew, 2009. Sensor-based occupancy
behavioral pattern recognition for energy and comfort
CombinedVisualComfortandEnergyEfficiencythroughTruePersonalizationofAutomatedLightingControl
269

management in intelligent buildings. In Proceedings of
Building Simulation 2009. Glasgow, U.K.
Shen, E., Hu, J., Patel, M., 2014 .Energy and visual comfort
analysis of lighting and daylight control Strategies. In
Building and Environment 78 (2014) 155-170.
SMARTGREENS2015-4thInternationalConferenceonSmartCitiesandGreenICTSystems
270
