
Event-complementing Online Human Life Summarization based on
Social Latent Semantic Analysis
Klimis S. Ntalianis
1
and Anastasios D. Doulamis
2
1
Athens University of Applied Sciences, Department of Marketing, Division of Computing, 28, Agiou Spyridonos str.,
Egaleo 12243, Athens, Greece
2
National Technical University of Athens, School of Rural and Surveying Engineering, 9, Iroon Polytechniou str.,
Zografou 157 73, Athens, Greece
Keywords: Online Human Life Summarization, Events Detection, Social Media, Social Computing, Social Latent
Semantic Analysis.
Abstract: In this paper, online human life summarization is performed, based on multimedia content, published on
social media. The life summaries are also automatically annotated with events, persons, places etc. Towards
this direction, initially a content preparation module is activated that includes an intelligent wrapper. The
content preparation module scans social networks, extracts their pages and segments them into tokens, in an
unsupervised way. Next multimedia content is kept and it is associated to its respective metadata. In the
following step, a novel ranking mechanism puts multimedia content in order of importance based on user-
content interactions. Finally the event-complementing summarization module produces a meaningful
annotated video clip, based on a spectral visual clustering technique and the innovative Social Latent
Semantic Analysis algorithm. Experimental results illustrate the promising performance of the proposed
architecture and set some foundations for future research.
1 INTRODUCTION
The largest social networks such as Facebook and
Twitter have expanded rapidly during the last
decade. Users share more and more information
(personal videos/pictures/documents, youtube
videos, flickr images, pinterest content etc) and are
increasingly in control of how and when they view,
create and post their favourite content. This
stimulates new applications in the area of leisure and
entertainment, e-democracy and e-business
(Kokkinos et al, 2013).
On the other hand, currently an interesting
initiative towards digital preservation of memories,
heads in the creation of virtual interactive museums.
A characteristic example includes the V-
MUST.NET project (see http://www.v-must.net/), an
EU FP7-funded Network of Excellence that aims to
provide the heritage sector with the tools and
support to develop Virtual Museums that are
educational, enjoyable, long-lasting and easy to
maintain. But, what about a virtual museum
containing summaries of peoples’ lives ? Instead of
opening albums and viewing old video tapes
wouldn’t it be better to keep digital summaries of the
lives of our ancestors, so that we can follow their
experiences, life events, professional moments etc.
and better keep their memory ? For example imagine
that we had a multimedia summary of the life of
Socrates, Napoleon, Isaac Newton, Christopher
Columbus or Albert Einstein. How influential could
it be?
Some years ago we did not have these
capabilities, but now things have changed. For
example, since social networks currently contain
extremely vast amounts of information posted by
their users, this information could possibly be used
to create personal event-driven summaries. In
particular, several users regularly post personal
images/videos/graphics/documents in albums, which
include important events, activities and occasions of
their lives. This content may include several
metadata. In particular it is associated to a posting
date, it may state the place where it was created, it
may also tag people, activities, buildings, events etc.
Furthermore friends usually interact with posts,
which receive likes, positive/negative comments or
they may be shared by friends and other users. And
611
Ntalianis K. and Doulamis A..
Event-complementing Online Human Life Summarization based on Social Latent Semantic Analysis.
DOI: 10.5220/0005456506110622
In Proceedings of the 10th International Conference on Computer Vision Theory and Applications (MMS-ER3D-2015), pages 611-622
ISBN: 978-989-758-090-1
Copyright
c
2015 SCITEPRESS (Science and Technology Publications, Lda.)
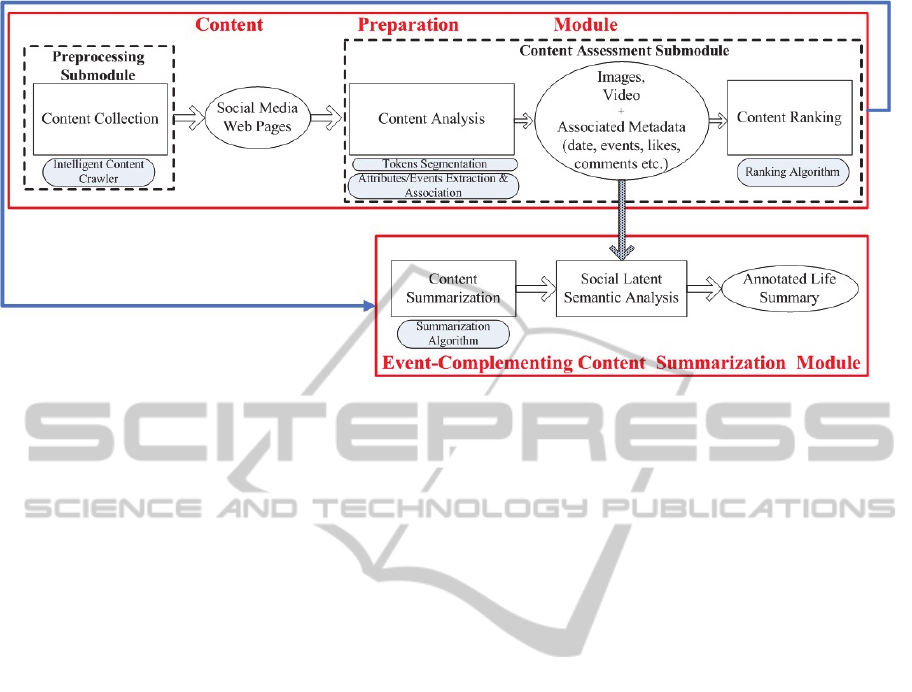
Figure 1: Overview of the proposed event-complementing life summarization scheme.
the question is: can we produce a meaningful
searchable event-oriented multimedia summary of
all this content by taking also into consideration the
interactions, metadata and duration ?
This paper proposes an innovative event-
complementing human life summarization scheme,
which is based on social computing data over social
media content. We aim at producing event
summaries, where a compact and searchable
overview of the life of each user is provided.
Towards this direction, in this paper an innovative
architecture is proposed, an overview of which is
provided in Figure 1. In particular the proposed
architecture for event-complementing human life
summarization includes several novel components
and it can be divided into two main modules: the
content preparation and the event-complementing
content summarization module. The content
preparation module (CPM) scans the Web, finds
social media web pages, analyzes them, detects
multimedia content, extracts relevant metadata,
associates the metadata to the multimedia content
and orders the content according to its importance.
On the other hand the event-complementing content
summarization module receives at its input the
ordered multimedia content, summarizes it and
automatically annotates the summary. Experimental
results on real life social networks content evaluate
the robustness, scalability and flexibility of the
proposed human life summarization scheme,
revealing its advantages and limitations.
This paper is organized as follows: In Section 2
related work is presented. Section 3 discusses the
content preparation module, while Section 4 focuses
on the content summarization module and the
innovative S-LSA algorithm. Experiments are
presented in Section 5 and Section 6 concludes this
work.
2 RELATED WORK
Regarding conventional video summarization, two
extensive reviews of key-frame extraction and video
summarization approaches are given in (Money and
Agius, 2007), (Truong and Venkatesh, 2012). The
presented interesting algorithms summarize single
videos with selected still images or with a short
summary video. However they do not consider
social media content and implicit crowdsourcing
metadata such as likes, comments and sharing.
On the other hand some works have been
proposed in the literature, focusing on new
summarization trends. In (Fabro, et. al., 2012) an
algorithm for the summarization of real-life events
based on community-contributed multimedia content
is presented. The proposed event summarization
algorithm uses photos from Flickr and videos from
YouTube to compose summaries of well-known
society events, which took place in the last three
years. A summary is built according to search terms,
specified by the user (e.g. Royal wedding of William
and Kate). In (Wang, et. al., 2012) an approach for
event driven web video summarization is proposed
based on tag localization and key-shot mining.
Initially the method localizes the tags that are
associated with each video into its shots. Then the
relevance of the shots is estimated with respect to
the event query by matching the shot-level tags with
the query. However, it cannot be straightforwardly
VISAPP2015-InternationalConferenceonComputerVisionTheoryandApplications
612

applied to social media content and does not take
into consideration user interactions.
In (Chua and Asur, 2013) a search and
summarization framework is proposed to extract
relevant representative tweets from a time-ordered
sample of tweets to generate a coherent and concise
summary of an event. Two topic models are
introduced that take advantage of temporal
correlation in the data to extract relevant tweets for
summarization. The aforementioned approach
focuses on text and does not consider any other kind
of multimedia content. In (Wang, et.al, 2013) the
task of personal profile summarization by leveraging
both personal profile textual information and social
networks is addressed. The use of social networks is
motivated by the intuition that, people with similar
academic, business or social connections tend to
have similar experience and summaries. To achieve
the learning process, the authors propose a collective
factor graph model to incorporate all these resources
of knowledge to summarize personal profiles with
local textual attribute functions and social
connection factors as is presented in (Doulamis, et
al, 2013a,b) for personalized 3D navigation.
However the work considers only textual
information included in user profiles aiming mainly
at building automatic resumes. An active learning
algorithm for classifying user's preferences has been
proposed in (Yiakoumettis et al, 2014).
The approach of (Yang, et. al., 2011) is based on
modelling Web documents and social contexts into a
unified framework. A dual wing factor graph
(DWFG) model is proposed, which utilizes the
mutual reinforcement between Web documents and
their associated social contexts to generate
summaries. An efficient algorithm is designed to
learn the proposed factor graph model. Again this
approach does not consider other multimedia content
except of text. The work of (Hu et. al., 2011)
performs social summarization by first employing
the tripartite clustering algorithm to simultaneously
discover document context and user context for a
specified document. Then sentence relationships
intra and inter documents plus intended user
communities are taken into account to evaluate the
significance of each sentence in different context
views.
Finally, a few sentences with highest overall
scores are selected to form the summary. This
approach focuses only on text documents and does
not analyze images or video. The work of (Meng, et.
al.,2012) proposes a unified optimization framework
to produce opinion summaries of tweets through
integrating information from dimensions of topic,
opinion and insight, as well as other factors. Their
approach is limited to producing personalized
summaries and does not provide audiovisual
abstraction. In (Sinha, et.al., 2011) a framework for
generating representative subset summaries from
large personal photo collections is proposed. Three
salient properties are defined that an informative
summary should satisfy: quality, diversity and
coverage. Methods are presented to compute these
properties using multidimensional content and
context data. This interesting approach does not
consider video data. In (Gentili, et. al., 2012) events
are defined as tuples (u, a, o, t), which mean that a
user u performed the action a over the object o at
time t. The authors aim to produce a concise
summary of sequences of events related to time,
based on the data size reduction obtained merging
time intervals and collapsing the descriptions of
more events in a unique descriptor or in a smaller set
of descriptors.
However the proposed approach does not
consider user interaction metadata and cannot be
straightforwardly applied to social media content. In
(Lee, et. al., 2012) a video summarization approach
for egocentric or “wearable” camera data is
proposed. Given hours of video, this method
produces a compact storyboard summary of the
camera wearer’s day. The resulting summary
focuses on the most important objects and people
with which the camera wearer interacts. This scheme
is limited to video content coming from wearable
cameras. Recent work also includes schemes
proposed by (Ntalianis et. al., 2013, 2014). In that
scheme, humans behavior understanding algorithms
as in (Voulodimos et al, 2013) can be exploited.
Last but not least, Facebook has presented a very
interesting application entitled «A Look Back» or
«My Facebook movie» (Griggs, 2014). This service
has been described as an experience that compiles
your highlights since joining Facebook. Depending
on how long you have been on Facebook and how
much you have shared, you will see a movie, a
collection of photos or a thank you card. The movie
is about one minute long and includes the date when
someone joined Facebook, their first moments and
most liked posts and photos they have shared.
However there are several limitations of this
application: (a) it does not consider videos but only
photos, (b) it does not annotate time instances of the
summary with possible events, (c) it does not
consider comments, and (d) it is limited to about one
minute irrespectively of one’s activity.
Event-complementingOnlineHumanLifeSummarizationbasedonSocialLatentSemanticAnalysis
613

3 CPM & CONTENT RANKING
In this section the CPM is described, the main
product of which is an ordered list of multimedia
items (MIs). Each item is associated to several
metadata and its ranking among other items is
calculated. The CPM, is divided into the
Preprocessing and the Content Assessment
Submodules. The Preprocessing Submodule gathers
social media content, a task which is very
challenging on rule-stringent social media like
Facebook. For this reason we incorporate a
middleware intelligent crawling architecture, which
accomplishes content collection and analysis.
Aim of the Content Assessment Submodule is to
evaluate content importance, associate it to its
respective metadata and rank it. It consists of the
content analysis and the content ranking components
(CAC & CRC). The CAC initially segments a page
into tokens and associates each posted MI to its
related metadata. In case of a typical Facebook post,
tokens include: the posted MI, the date when the MI
was posted, the title of the MI, the “like” area, the
shares area, the comments area and the person area
of each comment.
3.1 The Proposed CRC
The CRC receives the MIs and associated metadata
and attempts to meaningfully rank them, using a
social computing approach. In this direction, social
interactions may provide a very good clue regarding
the “value” of a post. In particular, people tend to
interact with few of their social media “friends”
(Huberman, et. al., 2009), who are their actual
friends. In this paper actual friends are explicitly
considered. Towards this direction, the following
definitions are made:
Definition 1: Let U
i
be the i
th
user of a social
network.
Definition 2: The set
i
FS of all friends of U
i
is
given by:
},...,,{
21 M
iiii
FFFFS =
(1)
where
M
i
F
is the M
th
friend of U
i
.
Definition 3: An actual friend
k
i
AF
, k = 1, …, L
of U
i
, frequently interacts (likes, comments etc) with
content posted by U
i
or tagging U
i
. At the same time
U
i
frequently interacts with content posted by
k
i
AF
or tagging
k
i
AF
.
Definition 4: Based on Definition 3, the set
i
AFS of the actual friends of U
i
is defined as:
},...,{
21 L
iiii
AFAFAFAFS =
,
(2)
where
L
i
AF
is the L
th
actual friend of U
i
, and
i
AFS ⊆
i
FS .
Definition 5: For a multimedia item MI
i,m
, m=1,
…, G, posted by a user U
i
, or tagging user U
i
, three
vectors are defined,
mi,
l
,
mi,
p
and
mi,
c
,
corresponding to likes, shares and comments the MI
has received respectively:
],,...,,[
121
,
i
F
i
F
i
F
i
F
mi
MM
llll
+
=l
(3a)
],,...,,[
121
,
i
F
i
F
i
F
i
F
mi
MM
pppp
+
=p
(3b)
],,...,,[
121
,
i
F
i
F
i
F
i
F
mi
MM
cccc
+
=c
(3c)
where
i
F
l
1
/
i
F
p
1
equals to 1 if friend
1
i
F
has
liked/shared the respective MI, otherwise it equals to
0.
i
F
c
1
equals to the number of comments friend
1
i
F
has made to the respective MI, while
i
F
M
l
1+
,
i
F
M
p
1+
and
i
F
M
c
1+
count the likes, shares and comments the
MI has received from non-friends.
Definition 6: Let us denote as
mi
L
,
,
mi
P
,
and
mi
C
,
three variables that count the total numbers of
likes, shares and comments a MI has received
respectively:
+
=
=
1
1
,
M
r
i
F
mi
r
lL
+
=
=
1
1
,
M
r
i
F
mi
r
pP
+
=
=
1
1
,
M
r
i
F
mi
r
cC
(4)
Definition 7: Variable
mi
DA
,
over a multimedia
item MI
i,m
, m=1, …, G, denotes its duration of
activity, capturing the first and last day the MI was
shared or received a comment.
Definition 8: Variable
mi
RA
,
over a multimedia
item MI
i,m
, m=1, …, G, denotes how frequently a MI
receives attention:
mi
mimimi
mi
DA
CPL
RA
,
,,,
,
++
=
(5)
By taking into consideration the aforementioned
measures, MIs are then ranked in seven steps:
Step 1: for a user U
i
, i=1,…, N, and for a given
time instance TP, gather all multimedia items MI
i,m
,
m=1, …, G, that have been posted by U
i
or tag U
i
.
Step 2: ∀
j
i
F
∈
i
FS , j=1, …, M, calculate an
VISAPP2015-InternationalConferenceonComputerVisionTheoryandApplications
614

interaction value IV(
j
i
F
) between
j
i
F
and U
i
.
Gather all values IV(
j
i
F
), j=1, …, M, to a vector
i
v
:
)](),...,(),([
21 M
iiii
FIVFIVFIV=v
(6)
Step 3: Sort
i
v
in descending order to produce
*
i
v
:
)](),...,(),([
*
p
i
q
i
o
ii
FIVFIVFIV=v
(7)
with
)(,...,)()(
p
i
q
i
o
i
FIVFIVFIV ≥≥≥
and o, q, p ∈
[1, …, M]. The top values of
*
i
v
distinguish the
i
AFS members.
Step 4: Having estimated Eq. (7), an ordered set
of U
i
’s friends is produced:
],...,,[
*
p
i
q
i
o
ii
FFFFS =
(8)
where
o
i
F
/
p
i
F
is the user who maximally/minimally
interacts with U
i
. Then for each MI
i,m
, L
i,m
, P
i,m
and
C
i,m
are recalculated, by considering
*
i
FS
. In
particular the ordering of
*
i
FS
is mapped to a
weights vector w
i
so that activities from actual
friends are strengthened while activities from all
others are weakened:
],,...,,[
121 +
=
MM
FFF
i
wwww
pqo
w
(9)
Eq. (9) contains M + 1 weights. The first M weights
correspond to the list of M sorted friends of U
i
(Eq.
8), while w
M+1
corresponds to non-friends. Vectors
l
i,m
, p
i,m
and c
i,m
are also sorted by following the
ordering of set
*
i
FS
, forming
mi,
*
l
,
mi,
*
p
and
mi,
*
c
:
],,...,,[
1
,
* i
F
i
F
i
F
i
F
mi
Mpqo
llll
+
=l
(10a)
],,...,,[
1
,
* i
F
i
F
i
F
i
F
mi
Mpqo
pppp
+
=p
(10b)
],,...,,[
1
,
* i
F
i
F
i
F
i
F
mi
Mpqo
cccc
+
=c
(10c)
Then
mi
L
,
′
,
mi
P
,
′
and
mi
C
,
′
are calculated by the dot
product:
i
mi
mi
L wl ⋅=
′
,
*
,
(11)
i
mi
mi
P wp ⋅=
′
,
*
,
i
mi
mi
C wc ⋅=
′
,
*
,
Step 5: Estimate the average variable
mi
AR
,
′
as:
mi
mimimi
mi
DA
CPL
AR
,
,,,
,
′
+
′
+
′
=
′
(12)
Step 6: Estimate the importance
mi
I
,
of each
multimedia item MI
i,m
, m = 1,… G:
mi
mi
mi
mi
C
mi
mi
P
mi
mi
L
mi
RA
AR
C
C
w
P
P
w
L
L
wI
,
,
,
,
,
,
,
,
,
′
⋅
′
⋅+
′
⋅+
′
⋅=
(13)
where
w
L
, w
P
and w
C
control the importance of likes,
shares and comments in the ranking process. In Eq.
(13) the division of terms of Eq. 11 by terms of Eq.
4 plays a normalization role, since the latter terms
are not affected by the friends’ ordering process.
Step 7: Gather all
mi
I
,
’s , m = 1,… G, into set
mi
SI
,
:
],...,,[
,2,1,, Giiimi
IIISI =
(14)
Finally sort
mi
SI
,
to produce
mi
SI
,
*
:
],...,,[
,,,
,
*
yiziwi
mi
IIISI =
(15)
with
yiziwi
III
,,,
... ≥≥≥
and w, z, y ∈ [1, …, G].
mi
SI
,
*
contains all measures of importance for all
MIs posted by
U
i
or tagging U
i
. The order of the
measures of importance determines the order of
importance for each MI. More/less important MIs
are summarized in finer/coarser detail and presented
first/last.
4 EVENT-COMPLEMENTING
CONTENT SUMMARIZATION
BASED ON THE SOCIAL LSA
The event-complementing content summarization
module attempts to create and unsupervisedly
annotate the most representative summaries,
exploiting the output of the CRC and the visual
characteristics of each MI. Here, clustering of MIs
based on their visual features is very important,
since "uncorrelated" content that covers the whole
storyline should be included.
Let us denote as
i
m
d
a descriptor vector that
represents the visual content of
MI
i,m
. There are
several ways to estimate
i
m
d
based on global/local
features. Global descriptors provide an average of
the visual information, whereas local descriptors are
more suitable for describing specific areas. Local
descriptors include FAST (Rosten and Drummond,
2006), SURF and SIFT or recently ORB (Rublee, et.
al., 2011). In this paper, the extended MPEG-7
descriptors are used (Spala, et. al. 2012).
Event-complementingOnlineHumanLifeSummarizationbasedonSocialLatentSemanticAnalysis
615

For creating a representative summary, a graph-
based partitioning algorithm is adopted to form key-
representative clusters. Spectral graph partitioning is
incorporated instead of e.g. k-means, since it can
simultaneously localize both intra-cluster coherence
and inter-cluster separation. In addition, it can
partition the space into complex regions allowing the
extraction of more sufficient summaries than other
conventional approaches.
4.1 Graph-based Representation
Let G={V,E} be a graph. A vertex v∈V represents a
MI, while the edges
e
m,j
the correlation degree
between two MIs. In particular,
e
m,j
is defined as the
correlation coefficient of the visual descriptors
i
m
d
and
i
j
d
respectively.
i
j
T
i
j
i
m
T
i
m
i
j
T
i
m
i
j
i
mmj
Corre
dddd
dd
dd
⋅⋅
⋅
== ),(
(16)
Cross-correlation presents advantages compared to
the Euclidean distance, which is sensitive to feature
vector scaling and/or translation (Doulamis and
Doulamis, 2006). For this reason, normalized cross-
correlation has been widely used as it remains
unchanged after feature vector scaling or translation.
4.2 Spectral Visual Clustering
Using the graph representation, we estimate M
mutually exclusive clusters, which are as
"uncorrelated" as possible with samples belonging to
different clusters and as coherent as possible with
samples of the same cluster. "Uncorrelation" means
that the
M clusters are able to represent the whole
storyline and it is formulated as:
ˆ
r
C
:min
=
=
M
i
r
P
1
∉∈
=
rr
CjCm
jm
e
,
,
max
∈∈=
=
rr
CjCm
jm
M
i
r
eQ
,
,
1
(17)
In Eq. (17),
r
C
ˆ
is the optimal r-th partition of the
relevant set
C among the M requested, while e
m,j
is a
metric distance between two MIs as defined by Eq.
(16). The left hand of Eq. (17) minimizes the overall
correlation between clusters, satisfying the concept
of "uncorrelation", while the right hand maximizes
coherence within a cluster. The main limitation of
Eq. (17) is that optimization favors the creation of
small clusters, since as the number of elements of a
class increases, the respective cost
=
M
i
r
P
1
also
increases. To face this difficulty, normalization
factors are included in Eq. (17), resulting in the
following optimization problem:
ˆ
r
C
:maxQ=
=
∈∈
∈∈
=
=
M
i
CjCm
jm
CjCm
jm
M
r
r
rr
rr
e
e
NQ
1
,
,
,
,
1
and min
P=
=
∈∈
∉∈
=
=
M
i
CjCm
jm
CjCm
jm
M
r
r
rr
rr
e
e
NP
1
,
,
,
,
1
(18)
where
Q and P are the normalized quantities of Q
r
and
P
r
respectively, and
1
M
rr
CC
=
=∪
. Since it is
easy to prove that
P+Q=M, the aforementioned
optimization problem can be solved only by
minimizing variable
P.
Then Eq. (18) can be written in matrix form as:
⋅⋅
⋅−⋅
=
=
M
r
r
T
r
r
T
r
r
P
1
)(
minmin:
eLe
eELe
e
(19)
where E is the graph’s adjacent matrix, that is
E=[
e
m,j
], while L is a diagonal matrix
)(
i
ldiag=L
, the elements of which equal
∈
=
Cj
jmi
el
,
. Vector
r
e
is equal to 1 if the m-th MI
belongs to the
r-th partition or zero otherwise.
Minimization of Eq. (19) can be obtained only
under the assumption that the elements of e
r
receive
continuous values instead of binary. The concept is
to initially estimate the continuous version of e
r
and
then discrete the solution to take binary values.
Under the assumption of continuity regarding e
r
,
optimization of Eq. (19) is obtained through the
estimation of the generalized eigenvectors of the
matrices L and E. In this way, we estimate the
continuous version of the index vector denoted as
c
r
e
. Then, the problem is how to round vector
c
r
e
to
obtain discrete values. A simple rounding process is
to set the maximum value of each row of
c
r
e
equal
to one and the remaining values equal to zero.
4.3 Creation of Summaries
Next, the M clusters are created in a way so that
each element contains as uncorrelated MIs as
possible. Therefore, in order to create a spherical
VISAPP2015-InternationalConferenceonComputerVisionTheoryandApplications
616

view of the storyline of a user, we need to extract
one or more items from each cluster. Initially, for
every cluster, a score
r
C
I
is assigned as the average
ranking criterion of all MIs belonging to
r
C :
∈
=
r
r
Ci
r
mi
C
C
I
I
,
(20)
In Eq. (20),
⋅
expresses the cardinality of
r
C and
r
C
I
is the importance of a cluster. So, the higher the
score, the more significant a cluster is. Therefore,
the score
r
C
I
indicates the percentage of MIs
extracted from each cluster. Let us denote by
S the
scale of a summary.
S expresses a summary’s level
of detail and when it increases, more MIs are
included in the summary. Then,
r
C contributes to a
summary by
SI
r
C
⋅
MIs. It is clear that within a
cluster
C
r
, each MI has a score I
i,m
. Therefore, for
each cluster the
SI
r
C
⋅
highest scored MIs are
extracted. By collecting data for every of the
M
clusters, we construct the multimedia summary at
scale
S.
4.4 Event-complementing Annotation
of Summary
Latent semantic analysis (LSA) is a technique in
natural language processing that analyzes
relationships between a set of documents and the
terms they contain, by producing a set of concepts
related to the documents and terms (Landauer and
Dumais, 1997). LSA assumes that words that are
close in meaning will occur in similar pieces of text.
A matrix containing word counts per paragraph is
constructed from a large piece of text and singular
value decomposition (SVD) is used to reduce the
number of rows, while preserving the similarity
structure among columns. Words are then compared,
by taking the cosine of the angle between the two
vectors, formed by any two rows. Values close to 1
represent very similar words, while values close to 0
represent very dissimilar words.
In this paper and in the framework of social
media, the Social LSA (S-LSA) is introduced, in
order to also consider interactions among users and
content. In particular, in our case specialized
analysis is performed per user, since the friends of a
user may use their own vocabulary, expressions etc.
Additionally, the title of a post as well as comments
made by friends of a user, also receive likes
(meaning that they are approved). Thus the
keywords of this kind of social dialogue should be
further strengthened. Towards this direction let
X be
a matrix where element
x
i,j
describes the occurrence
of term i in the associated text area of the j
th
MI:
=
nmm
n
xx
xx
X
,1,
,11,1
...
.........
...
(21)
Let also
Y be a matrix, where element y
i,j
describes
the total likes a comment has received, which also
contains term
x
i,j
:
=
nmm
n
yy
yy
Y
,1,
,11,1
...
.........
...
(22)
Then in our case the strength of each term in a social
framework is defined by the Hadamard product:
Z
zz
zz
yxyx
yxyx
yy
yy
xx
xx
YX
nmm
n
nmnmmm
nn
nmm
n
nmm
n
=
=
=
=
=
,1,
,11,1
,,1,1,
,1,11,11,1
,1,
,11,1
,1,
,11,1
...
.........
...
...
.........
...
...
.........
...
...
.........
...
(23)
Now a row
T
i
t
in Z will be a vector corresponding to
a term, providing its extended relation to each SVP,
while a column in
Z will be a vector, giving its
relation to each term contained in the associated
textual information
d(MI) of an MI:
[]
nii
T
i
zzt
,1,
...=
24(a)
=
jm
j
j
z
z
MId
,
,1
...)(
24(b)
where, for simplicity of notation, the page index has
been eliminated from the
MI.
Now the dot product
p
T
i
tt
gives the correlation
between terms
i and p over all MIs, while ZZ
T
provides dot products for all terms. Furthermore let
us assume that a decomposition of
Z exists such that
U and V are orthogonal matrices:
Z= UΣV
T
(25)
while Σ is a diagonal matrix of the form:
=Σ
l
σ
σ
...0
.........
0...
1
(26)
Event-complementingOnlineHumanLifeSummarizationbasedonSocialLatentSemanticAnalysis
617
Date: 06 August 2012
Title of Album: Cover Photos
Title of Picture: pagaki of skiathos — together with
Olga Chrysafogeorgou
Likes: 16 (from Katerina Gkaravella, Elizabeth
Karahanidi, Αλεξάνδρα Σκαρμέα, χάρης χάρης,
PanagiotisViper Vlachos A, Ioanna Tsami, Mixalis
Zaranis, Babar Hussain, Johanna Vassilopoulou, Ra
f
Trifon, Ειρηνη Γκικακη, Hara Barka, Όλγα
χρυσαφογεώργου, Vanessa Boukoura, ΝΤΑΣΙΩΤΗ
ΜΑΡΙΑ, Yannis Pappas).
Total Number of Comments: 4 (from Όλγα
χρυσαφογεώργου
→ 2, from Katerina Gkaravella →
2).
Shares: 0
First day of Activity: 06 August 2012
Last day of Activity: 06 August 2012
Figure 2: Output of the content analysis component (image
& associated metadata).
The matrix products giving us the term and textual
information of MIs correlations then become:
ZZ
T
=UΣΣ
T
U
T
(27a)
Z
T
Z=VΣ
T
ΣV
T
(27b)
Since ΣΣ
T
and Σ
T
Σ are diagonal, U contains the
eigenvectors of
ZZ
T
, while V contains the
eigenvectors of
Z
T
Z. Both products have the same
non-zero eigenvalues given by the non-zero entries
of
ΣΣ
T
and Σ
T
Σ respectively. Additionally when the k
largest singular values among
σ
1
, …, σ
l
and their
corresponding singular vectors from U and V are
selected, the rank k approximation of Z is
accomplished and can be written as:
T
kkkk
VUZ Σ=
(28)
Based on Eq.(28) terms
i and p can be compared, by
comparing the vectors
T
ik
t
ˆ
Σ
and
T
pk
t
ˆ
Σ
. In this
paper
MIs are associated to the terms that best
approximate them, so that each MI is enriched with
events, places, persons, time etc, providing better
content understanding.
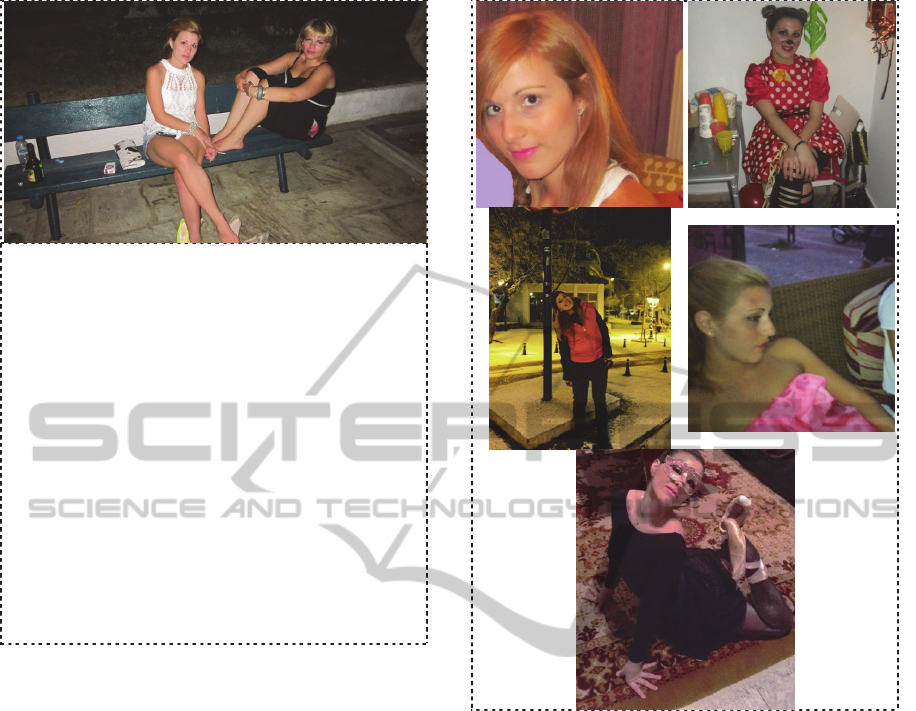
Figure 3: Top 5 MIs for U
78
(ranking mechanism).
Now the CRC receives 261 MIs, aiming at putting
them into an order from the most to the less
important. Set
5 EXPERIMENTAL RESULTS
In order to evaluate the proposed scheme, on
03/02/15 we have recorded the “Albums”
information of 120 Facebook friends of the Online
Computing Group that can be found at:
www.facebook.com/klimis.ntalianis.7. In total 611
videos and 26,004 pictures were gathered, providing
on average 5 videos and 216.7 pictures per friend. In
parallel, the preprocessing submodule gathered and
associated to each
MI its respective metadata. For
visualization purposes, the results over
U
78
are
presented, whose albums contained 2 videos and 259
pictures. Next the CAC is applied, providing in total
261 combinations of MIs and associated metadata.
VISAPP2015-InternationalConferenceonComputerVisionTheoryandApplications
618

One such combination is provided in Figure 2,
where L=16, P=0, C=4 (Eq. 4) and DA=1 (Def. 7).
FS
78
of all friends of U
78
contains 703 persons. In
order to calculate
mi
L
,
′
,
mi
P
,
′
and
mi
C
,
′
(Eq. 11),
*
i
FS
(Eq. 8) should be estimated, which shorts the friends
of
U
78
according to their interaction values (IV(
j
i
F
)). Interaction value between U
78
and her 703 friends
have been estimated for the data recorded on
03/02/15. Furthermore
T
AF
was set equal to 2 %.
Based on
IV(
j
i
F
),
*
16
v
(Eq. 7) is estimated and then
*
i
FS
is calculated. In this case the top 2% of U
78
’s
friends are considered as actual friends, or 14
persons in total. Based also on the set of actual
friends,
mi
L
,
′
,
mi
P
,
′
and
mi
C
,
′
were calculated, where
weights vector
16
w (Eq. 9) were experimentally set
to take values in the interval [3, 0.01]. Finally
m
SI
,78
*
, m = 1, …., 261, is estimated, containing all
MIs from the most to the less important. For
visualization purposes the top 5 are presented in
Figure 3. As it can be observed, all of them contain
U
78
in different poses. Having this into mind, the
proposed summarization algorithm tries to unsettle
this kind of theme monotony by visually clustering
Selected
Figure 4: The online life summary of user U
78
(3
rd
of February 2015).
Event-complementingOnlineHumanLifeSummarizationbasedonSocialLatentSemanticAnalysis
619

content. In our experiments and in case of U
78
, 5
clusters were created and, based on scores
r
C
I
, 25
images and 1 video key-frame were extracted. All 26
MIs are integrated into a video, similarly to the «My
Facebook movie» application. The summary is
provided in Fig. 4.
Table 1: Parts of the d(MI) vector for the selected MI of
Figure 4. The second, fourth and sixth column contain
terms, while the first, third and fifth column contain the
respective z
i,j
values.
Col.
1
Col.
2
Col.
3
Col.
4
Col.
5
Col.
6
0
Absorbed
0
King
4 Sweet
0
Beer
0
Lonely
0
Talk
0
Candle
31 New 0
Tired
5 Double 4 Order 7 Unfair
0
Dozen
0
Parrot
0
Ultimate
4 Eat 6 Piece 31 Vanish
0
Frightened
0
Query
0
Vine
31 Girls 31 Set 8 Want
0
Hide
4 Small 4 Yesterday
7 Jealous 0
Star
0
Zircon
Finally the S-LSA algorithm has annotated (per
image) the automatically produced summary, by
taking into consideration both titles and comments
of all 261 MI. In particular, the associated text of
each MI was analyzed to its words and stop words
have been removed, using the Page Analyzer’s list
(http://www.ranks.nl/). As a result 857 unique terms
have remained, while the mean number of terms per
MI was equal to 3.28. Analysis for one MI of Figure
4, marked by “selected” is provided. In particular
this MI, which contains a plate of sweets, has a
translated title “Girls the new set will vanish”.
Furthermore
L=31, P=0 and C=22 respectively (Eq.
4), while it had 62 unique terms. Now regarding
vector
d(MI) of Eq. 24(b) for the MI under
consideration, parts of it are presented in the first,
third and fifth column of Table I. The vector has size
857 × 1 and since the specific
MI has only 62 unique
terms, it is very sparse. The respective terms (in
alphabetical order) are also presented in the second,
fourth and sixth column. As it can be observed, the
S-LSA takes into consideration also user interactions
(likes made to the title and comments), which
strengthen specific terms. Among the terms that gain
more strength are words that are included in the title
of the
MI. For the MI under consideration the top 14
annotation terms, according to score, were (Greek
terms translated to English): girls, new, set, vanish,
want, unfair, jealous, piece, double, sweet, eat,
order, small, yesterday.
6 CONCLUSIONS
In this paper we have presented an innovative event-
complementing human life summarization scheme,
based on a social computing methodology over
social media content. In particular, 120 summaries
have been composed, corresponding to members of
the Online Computing Group. The proposed scheme,
except of achieving information reduction, it also
provides sufficient summaries. The only major
complain from users was focused on the duration of
the summary (in some cases more than 7 minutes).
This issue could be confronted e.g. by
multiresolution summaries, where a user would be
able to zoom in or out to content of interest.
Future work can take many directions. First of all
an intelligent mechanism could be implemented to
gather and integrate information of a user from as
many online sources as possible. This would provide
a much better profile of one’s network life (their
interests, habits, activities etc.) and maybe lead to a
more inspired summary. Secondly a mechanism to
take into consideration also time would reveal new
dimensions of the problem. Currently content is
gathered for a specific time instance without taking
into consideration the life cycle of a multimedia
item. Furthermore results should be normalized (e.g.
by taking into consideration the percentage of
friends that interact with a post) since a user may
currently have 100 friends and a year later may have
1,000 friends. The more the friends, the more the
interactions. Thus old time moments may be
considered insignificant.
Additionally a sentiment analysis module could
also be integrated to check the polarity of comments
(positive, negative, neutral), so that polarity is also
included into the ranking mechanism. Another
interesting research direction has to do with
distinguishing actual from non-actual friends (and
setting threshold
T
AF
and weights w
i
). To do so,
statistics and formulas based on the interaction
values could be introduced. Noise detection
algorithms could also be incorporated for excluding
irrelevant content from the summary. Finally
methods that analyze web pages based on their
visual appearance can be incorporated so that the
proposed scheme can be applied also to other types
of web sites.
ACKNOWLEDGEMENTS
The research leading to these results has been
VISAPP2015-InternationalConferenceonComputerVisionTheoryandApplications
620

supported by European Union funds and National
funds (GSRT) from Greece and EU under the
project JASON: Joint synergistic and integrated use
of eArth obServation, navigatiOn and
commuNication technologies for enhanced border
security funded under the cooperation framework.
REFERENCES
Chua, F. C. T. and Asur, S., 2013 Automatic
Summarization of Events From Social Media. 7th
International AAAI Conference on Weblogs and Social
Media, Cambridge, USA.
Doulamis, N., and Doulamis, A., 2006. Evaluation of
Relevance Feedback Schemes in Content-based in
Retrieval Systems. Signal Processing: Image
Communication, Vol. 21, No 4, April.
Doulamis, N., Yiakoumettis, C., Miaoulis, G. 2013.
Personalised 3D navigation and understanding of Geo-
referenced Scenes. IEEE 14th International
Symposium on a World of Wireless, Mobile and
Multimedia Networks, WoWMoM.
Doulamis, N., Yiakoumettis, C., Miaoulis, G.,
Protopapadakis, E., 2013. A constraint inductive
learning-spectral clustering methodology for
personalized 3D navigation. Lecture Notes in
Computer Science.
Fabro, M., Sobe, A. and Boszormenyi, L., 2012.
Summarization of Real-Life Events Based on
Community-Contributed Content. Fourth
International Conferences on Advances in Multimedia,
pp. 119 – 126, France, May.
Gentili, E., Milani A., and Poggioni, V., 2012 Data
Summarization Model for User Action Log Files. In
Proc. of the International Conference on
Computational Science and Its Applications (ICCSA),
vol. 7335, pp. 539–549.
Griggs, B., 2014. Your Facebook life in 62 seconds,”
CNN, February 6,
http://edition.cnn.com/2014/02/04/tech/social-
media/facebook-look-back-video/.
Hu, P., Sun, C., Wu, L., Ji, D., and Teng, C., 2011. Social
Summarization via Automatically Discovered Social
Context. In Proc. of the International Joint Conference
on Natural Language Processing, p.p. 483-490, 2011.
Huberman, B., Romero, D., and Wu, F., 2008. Social
networks that matter: Twitter under the microscope,”
arXiv:0812.1045v1, December.
K. Raftopoulos, K. Ntalianis, D. Sourlas and S. Kollias,
2013. Mining User Queries with Markov Chains:
Application to Online Image Retrieval. IEEE
Transactions on Knowledge and Data Engineering,
Vol. 25, No. 2, p.p. 433 – 447, Feb. 2013.
Kokkinos, P., Koumoutsos, K., Doulamis, N., et al 2013.
PERIKLIS - Electronic democracy in the 21st century
using mobile and social network technologies. Lecture
Notes in Informatics (LNI), Proceedings - Series of the
Gesellschaft fur Informatik (GI).
Landauer T.K., and. Dumais, S.T, 1997. A solution to
Plato’s problem: the latent semantic analysis theory of
the acquisition, induction, and representation of
knowledge. Psychological Review, Vol. 104, p.p. 211–
240, 1997.
Lee, Y.J., Ghosh, J., and Grauman, K., 2012. Discovering
important people and objects for egocentric video
summarization. In Proc. of the Computer Vision and
Pattern Recognition Conference (CVPR), p.p. 1346-
1353.
Meng
,,, ,
X., Wei F., Liu X., Zhou M., Li, S., and Wang,
H., 2012. Entity-Centric Topic-Oriented Opinion
Summarization in Twitter. In Proc. of the International
Conference of Knowledge Discovery and Data Mining
(KDD), p.p. 379-387, 2012.
Money, A. G., and Agius, H., 2008. Video summarisation:
A conceptual framework and survey of the state of the
art. Journal of Visual Communication and Image
Representation, Vol. 19, No. 2, p.p. 121–143.
Ntalianis, K. S., Doulamis, A., and Doulamis, N., 2014.
An Automatic Event-Oriented Human Life
Summarization Scheme based on Social Computing
over Social Media Content. Multimedia Tools and
Applications, Springer.
Ntalianis, K.S., Doulamis, A., Doulamis, N., and
Tsapatsoulis, N., 2013. Video Abstraction in Social
Media: Augmenting Facebook’s Edgerank Algorithm
in Video Content Presentation. In Proc. of the IEEE
International Conference on Image Processing (ICIP
'13), Melbourne, Australia, September.
Rosten E., and Drummond, T., 2006. Machine Learning
for High-Speed Corner Detection. In Proceedings of
the European Conference on Computer Vision
(ECCV), pp. 430–443.
Rublee, E., Rabaud, V., Konolige, K., and Bradski, G.,
2011. ORB: An efficient alternative to SIFT or SURF.
In Proc. the IEEE International Conference on
Computer Vision (ICCV), 2011.
Sinha, P., Mehrotra S., and Jain, R., 2011. Summarization
of personal photologs using multidimensional content
and context. In Proc. of the 1st ACM International
Conference on Multimedia Retrieval, p.p. 4.1 – 4.8,
New York, USA.
Spala, P., Malamos, A.G., Doulamis, A., Mamakis, G.,
2012. Extending MPEG-7 for efficient annotation of
complex web 3D scenes. Multimedia Tools and
Applications, Springer, vol. 52, no. 2, pp. 463-504.
Truong, B. T., and Venkatesh, S., 2007. Video abstraction:
A systematic review and classification. ACM
Transactions on Multimedia Computing,
Communications and Applications, Vol. 3, No. 1.
Voulodimos, A., Doulamis, N., Tsafarakis, S. 2013.
Behavior recognition from video based on human
constrained descriptor and adaptable neural networks.
ARTEMIS 2013 - Proceedings of the 4th ACM/IEEE
International Workshop on Analysis and Retrieval of
Tracked Events and Motion in Imagery Stream.
Wang, M., Hong, R., Li, G.,. Zha, Z.-J, Yan, S. and Chua,
T.-S., 2012. Event Driven Web Video Summarization
by Tag Localization and Key-Shot Identification.
Event-complementingOnlineHumanLifeSummarizationbasedonSocialLatentSemanticAnalysis
621

IEEE Transactions on Multimedia, Vol. 14, No. 4, p.p.
975 – 985.
Wang, Z., Li, S., Fang, K. and Zhou, G., 2013. Collective
Personal Profile Summarization with Social Networks.
In Proc. of the Conference on Empirical Methods in
Natural Language Processing, Seattle, Washington,
p.p. 715–725, October.
Yang, Z., Cai, K., Tang, J., Zhang, L., Su, Z., and Li., J.,
2011. Social Context Summarization. In Proc. of the
Special Interest Group on Information Retrieval
(SIGIR), p.p. 255 – 264, 2011.
Yiakoumettis, C., Doulamis, N., Miaoulis, G.,
Ghazanfarpour, D., 2014. Active learning of user's
preferences estimation towards a personalized 3D
navigation of geo-referenced scenes. GeoInformatica,
18 (1), pp. 27-62.
VISAPP2015-InternationalConferenceonComputerVisionTheoryandApplications
622
