
Testing an Image Mining Approach to Obtain Pressure Ulcers Stage
and Texture
Renato V. Guadagnin
1
, Levy Aniceto Santana
2
and Rinaldo de Souza Neves
3
1
MS Program on Information Technology and Knowledge Management, Catholic University of Brasília, Brasília, Brazil
2
Physical Therapy Program, Catholic University of Brasília, Taguatinga, DF, Brazil
3
Head of Scientific Starting Program – Pibic, Health Sciences Graduate School, Brasília, DF, Brazil
Keywords: Pressure Ulcer, Diagnosis, Image Mining, Colour, Texture.
Abstract: Improvement of pressure ulcers (PU) images analysis through computerized techniques is advantageous
both to medical assistance institutions and to patients’ life quality. The scientific challenge is to improve
assistance to patients with PU by means of reliable image analysis procedures. Diagnosis of stage and
predominant texture in a PU is essentially an image colour classification problem that can use existing
knowledge. This study performs a classification of pressure ulcers images through an algorithm based on
ID3 to construct a decision tree that has RGB statistics as input features and PU stage and texture as target
features. A decision tree is constructed first by classification of 18 images of a training set. Then this tree is
tested in a set of 45 PU images. Acceptable classification accuracy for training sets was not confirmed in
test set.
1 INTRODUCTION
Improvement of PU images analysis through
computerized techniques is advantageous both to
improve medical assistance institutions and to
increase life quality for patients. The clinicians
engaged in this area have to follow up a large
amount of patients that often have several pressure
ulcers. They have to actualize the corresponding
data registration based on new PU images that they
visually capture. Their work could be substantially
improved if they received a previous PU diagnostic
that were automatically generated. Eventually a new
visual image capture is not necessary and his work
becomes more productive. Therefore, the scientific
challenge is to improve assistance to patients with
PU by means of reliable image analysis procedures.
Diagnosis of stage and texture in a PU is
essentially an image colour classification problem
that can use existing knowledge.
A technique for automatic evaluation of texture
and stage, based on colour, to support treatment of
patients with PU, was presented in (Guadagnin,
2014). A training set of images features was used.
Present article shows the results of utilization of
such image classification technique to a PU images
test set.
The Background describes a study in present
theme and the main steps of the adopted
classification approach. The Technique details such
steps form image capture up to obtaining
classification results. The Results reports the
classification quality parameters from both PU stage
and PU texture computerized procedures. Some
comments about initial purpose and achieved results
are in Conclusion.
2 BACKGROUND
A classification based on colour and tissue structure
has been performed on wound images analysis
through neural networks and Bayesian classifiers in
a more extensive study. The set of colour and texture
features concern colour models L*u*v, RGB, and
normalized-RGB. Texture features included wavelet
filters too. 63 descriptors were reduced to 19 using
PCA, in order to reduce the dimensionality. The
authors concluded that the technique is appropriate
to obtain uniform and well-contrasted regions.
However PU image peculiarities implies the use of
manually delineated ground-truth images as
inappropriate. It is suggested a more precise
estimation of the approach to compare the results
22
V. Guadagnin R., Aniceto Santana L. and de Souza Neves R..
Testing an Image Mining Approach to Obtain Pressure Ulcers Stage and Texture.
DOI: 10.5220/0005457500220028
In Proceedings of the 5th International Workshop on Image Mining. Theory and Applications (IMTA-5-2015), pages 22-28
ISBN: 978-989-758-094-9
Copyright
c
2015 SCITEPRESS (Science and Technology Publications, Lda.)

with those from clinicians (Veredas, 2010).
Present study performs image mining with less
image features using software Weka (Waikato
Environment for Knowledge Analysis) (Witten,
1999). Weka is a free open source software, for data
mining. PU attributes are colour, stage and tissue,
which are determined by a healthcare technician.
Each PU image can be expressed through three
stacks in RGB model. It is possible to calculate
statistical indicators for each stack concerning
primary colour space, such as mean, standard
deviation and mode. Software ImageJ was used for
such purpose (Ferreira, 2012).
Thus, one can first classify the images in a
training set and construct a decision tree. Latter the
so achieved results can be checked in a test set. The
quality of classification process is evaluated this way
(Soukup, 2002).
3 TECHNIQUE
PU image sets for classification were obtained as
follows.
By a non-probabilistic way, a group of nine
individuals of both sexes, aged between 18 and 80
years, with PU, who formally authorized their
participation in the study, was defined to generate
training set.
A Canon superzoom camera, model PowerShot
SX 20 IS, with a resolution of 12.1 megapixels was
used. The camera axis was positioned perpendicular
to the PU plane. A blue-sky background field was
also put, in order to form a homogeneous
background. First 120 pictures that were taken with
flash were selected.
The test set was built with the 18 cases of
training set and new 27 cases that were obtained as
follows.
Data collection for the test set was conducted
between August 2012 and July 2013, in the
Neurosurgery Unit of the Federal District Base
Hospital (HBDF), the Health Secretary of State of the
Federal District (SES / DF). The PU of all patients
admitted in this hospital were photographed. PU
images were taken with a professional camera
Canon® T3i model, 18-55mm, EOS line Rebel®
with 18 megapixel resolution in jpeg format. Camera
flash was turned off and the patient was placed in
order to be illuminated as well as possible.
Photographs were performed with the axis of the
camera lens perpendicular to the bed of the UP, in
order to reduce distortion produced by tilting.
ImageJ calculated colour means concerning RGB.
Table 1 shows these statistical attributes and
predominant stage and tissue for each PU.
Table 1: PU image data.
PU
R G B St Tex
1 179 150 144 II S
2 185 119 109 III G
3 120 95 74 III S
4 156 98 68 IV N
5 108 79 65 III S
6 140 89 70 III G
7 131 81 63 III G
8 123 95 93 II G
9 114 80 61 IV N
10 119 75 60 IV G
11 203 131 120 III S
12 173 130 109 III G
13 179 119 108 II G
14 209 156 90 II S
15 128 83 85 II G
16 185 106 103 II G
17 147 105 73 II S
18 196 102 101 II G
19
117 113 110
III E
20
148 91 91
II E
21
141 96 86
II G
22
77 54 42
I N
23
143 87 73
II G
24
143 79 68
II G
25
123 84 87
IV G
26
109 87 88
IV Es
27
153 104 107
IV G
28
113 96 103
IV E
29
97 45 48
III G
30 133 107 110
II E
31
70 56 54
I N
32
157 103 104
II G
33
170 105 112
IV G
34
114 104 109
IV N
35
141 86 86
IV G
36 117 75 77
IV G
37
168 141 119
IV E
38
114 98 99
IV N
39
108 89 82
IV N
40
110 73 64
II E
41
146 100 101
IV G
42 126 105 105
IV E
43
159 110 113
IV G
44
124 95 97
IV E
45
132 86 83
IV G
The classification used filter J48. It is an open
source Java implementation of the C4.5 algorithm
that is an improvement of the basic ID3 algorithm. In
a decision tree, each non-leaf node is an input
TestinganImageMiningApproachtoObtainPressureUlcersStageandTexture
23

attribute, and each arc expresses a value of that
attribute. A leaf node corresponds to the expected
value of the target attribute when the input attributes
are described by the path from the root node to that
leaf node. In a satisfactory decision tree, each non-
leaf node should correspond to the input attribute that
is the most informative about the target attribute
amongst all the input attributes not yet considered in
the path from the root node to that node. It is so
expected to predict the target attribute using the
smallest possible number of questions on average
(Squire, 2004).
Entropy is used to determine how informative a
particular input attribute is about the target attribute
for a subset of the training data. Entropy is a measure
of uncertainty in communication systems introduced
by Shannon (1948). The attributes of the training
instances are searched and the attribute that best
separates the given examples is extracted by it. ID3
stops if the attribute perfectly classifies the training
sets; otherwise it recursively operates on the number
of possible values of attribute of the partitioned
subsets to get their "best" attribute (Scharma, 2011)
(Luger, 2004).
Results of classification are reported by software
Weka as follows.
In our case we have (a) four classes (stages I, II,
III and IV) and (b) three classes (slough – E,
granulation - G and necrotic tissue – N), and
therefore a 4x4 confusion matrix and a 3x3 confusion
matrix respectively. The number of correctly
classified instances is the sum of diagonals in the
matrix; all others are incorrectly classified.
The True Positive (TP) rate is the proportion of
examples which were classified as class x, among all
examples which truly have class x, i.e. how much
part of the class was captured. It is equivalent to
Recall. In the confusion matrix, this is the diagonal
element divided by the sum over the relevant row.
The False Positive (FP) rate is the proportion of
examples which were classified as class x, but belong
to a different class, among all examples which are
not of class x. In the matrix, this is the column sum
of class x minus the diagonal element, divided by the
rows sums of all other classes.
The Precision is the proportion of the examples
which truly have class x among all those which were
classified as class x. In the matrix, this is the
diagonal element divided by the sum over the
relevant column.
The F-Measure is simply
2*Precision*Recall/(Precision+Recall).
It is a combined measure for precision and recall
(Bouchaert, 2014).
Classification of training set with colour means
and stage resulted in the report in Fig. 1. The
confusion matrix pointed an accuracy percentage of
83,3%. The corresponding decision tree is in Fig. 2.
Fig. 3 reports classification of training set with
colour means and texture attributes. An 88.9%
accuracy was achieved. Fig. 4 shows the
corresponding decision tree.
A small difference with results achieved for both
training sets in the previous study results from
exclusion from texture attribute in the first one and
exclusion of stage attribute in the second one, in
present article.
Classification of test set with colour means and
stage resulted in the report in Fig. 5. It uses the same
decision tree obtained by training set. The confusion
matrix pointed an accuracy percentage of 44.4 %.
Fig. 6 reports classification of training set with
colour means and texture attributes. It uses the same
decision tree obtained by training set. A 64.4 %
accuracy was achieved.
4 RESULTS
Relationship between colour and stage of PU in 45
cases test set (44.4 % accuracy) was quite lower than
in 18 cases training set (83,3 % accuracy). A yet
significant difference can be noticed for relationship
between colour and texture (88.9 % accuracy for 18
cases training set and 64.4% accuracy for 45 cases
test set).
5 CONCLUSIONS
The high percentage of correct classification in 18
cases test set was not confirmed in 45 cases test set.
Therefore, the results obtained with test sets are
inadequate for the test sets of PU images. Possibly
the insertion of additional picture features in
classification could improve adequacy. Different
groups took the pictures in the training set and in the
remainder 27 cases set under different illumination
conditions. Some attention with picture capturing
procedures may improve the quality of test results
too. Anyway present analysis results encourage the
development of image capturing and processing
devices for practical use in healthcare institutions.
IMTA-52015-5thInternationalWorkshoponImageMining.TheoryandApplications
24
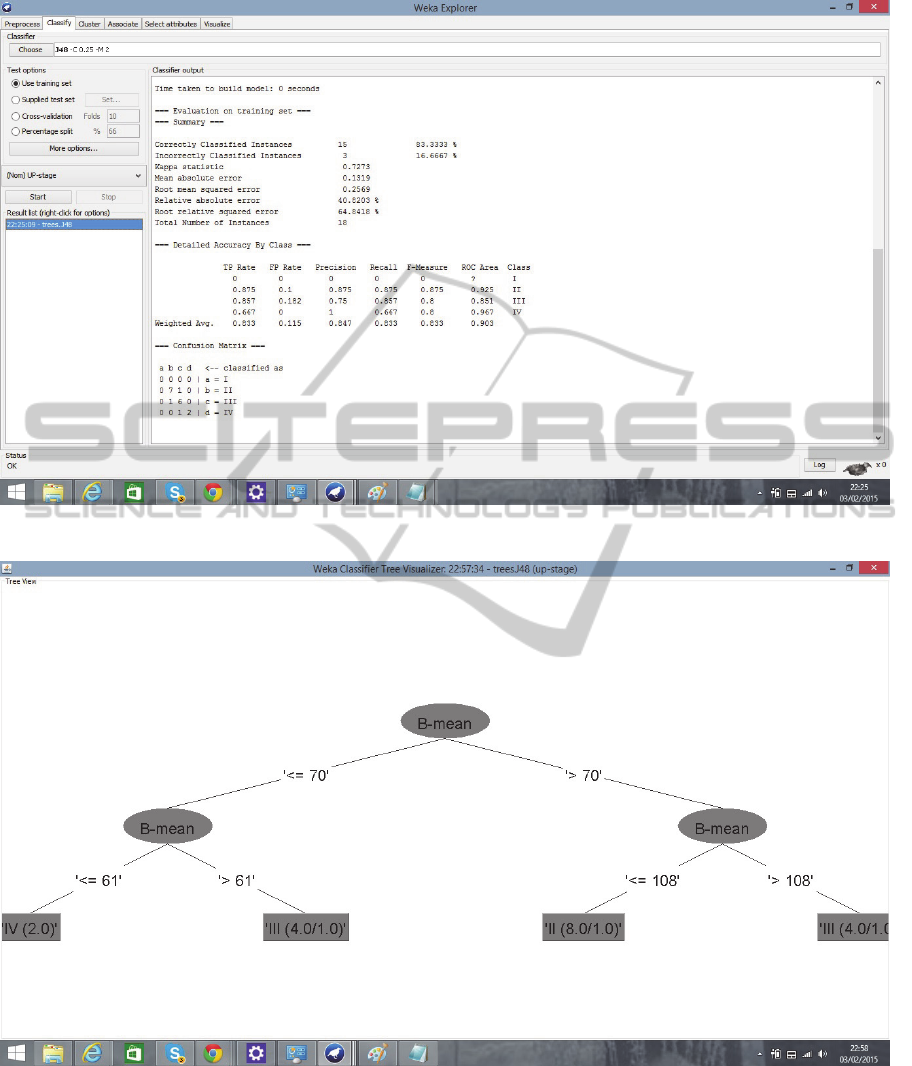
Figure 1: Classification report for training set with PU stage as leaf attribute.
Figure 2: Decision tree for the training set with PU stage as leaf attribute.
TestinganImageMiningApproachtoObtainPressureUlcersStageandTexture
25
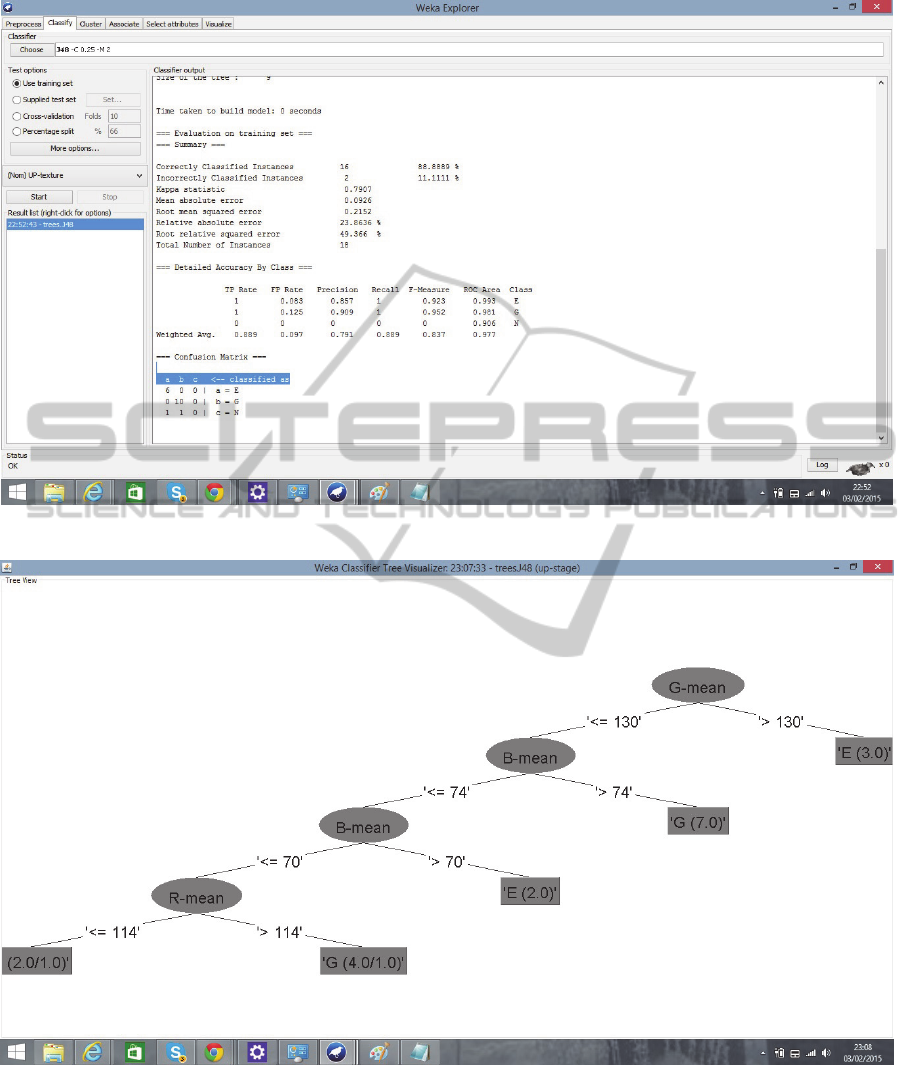
Figure 3: Classification report for the training set with PU texture as leaf attribute.
Figure 4: Decision tree for the training set with PU texture as leaf attribute.
IMTA-52015-5thInternationalWorkshoponImageMining.TheoryandApplications
26
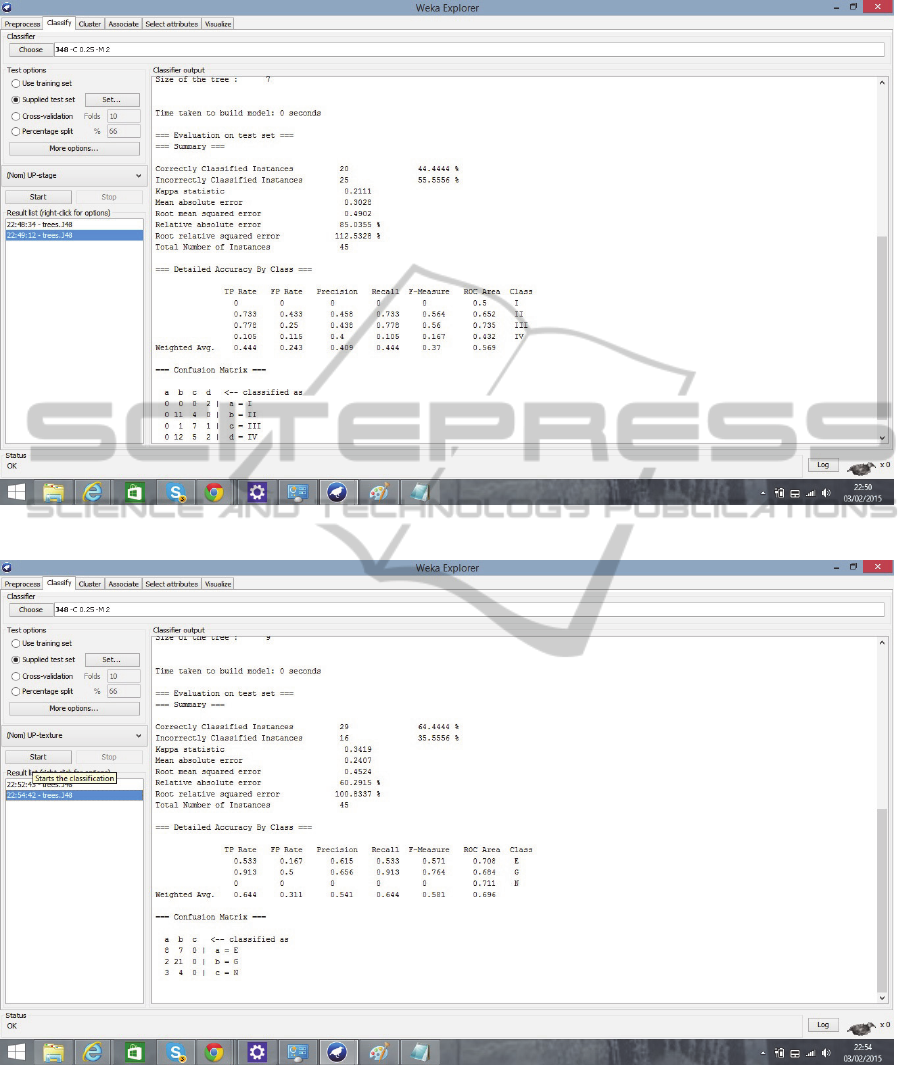
Figure 5: Classification report for the test set with PU stage as leaf attribute.
Figure 6: Classification report for the test set with PU texture as leaf attribute.
ACKNOWLEDGEMENTS
This study was partially sponsored by Brazilian
National Council for Technological and Scientific
Development (CNPq) and is part of the cooperation
between Catholic University of Brasília and German
Office for Academic Interchange (DAAD).
TestinganImageMiningApproachtoObtainPressureUlcersStageandTexture
27

REFERENCES
Bouchaert, R. R. et al. Weka Manual for Version 3-7-12,
Hamilton, New Zealand: University of Waikato, 2014.
Ferreira, T., Rasband, W. ImageJ User Guide. IJ1.46r,
October 2012. http://imagej.nih.gov/ij/docs/guide/
user-guide.pdf [access 04/Aug/2014]
Guadagnin, R. V., Neves, R. S., Santana, L. A.
Preliminary results from an image mining approach to
support pressure ulcers analysis. In: Proceedings of
the 9th Open German-Russian Workshop on Pattern
Recognition and Image Understanding, Koblenz
(Germany): Dec/2014.
Luger, GF. Inteligência Artificial. Estrutura e estratégias
para a solução de problemas complexos, 4. Ed, \Porto
Alegre (Brazil): Bookman, 2004.
Scharma, AK, Sahni, S. A Comparative Study of
Classification Algorithms for Spam Email Data
Analysis, in: International Journal on Computer
Science and Engineering (IJCSE), Vol. 3 No. 5 May
2011, p. 1890-1895.
Soukup, T., Davidson, I. Visual Data Mining, USA: Wiley,
2002.
Squire, DMcG, CSE5230 Tutorial: The ID3 Decision Tree
Algorithm: Monash University, 2004.
Veredas, F, Mesa, H, Morente, L, Binary Tissue
Classification on Wound Images with Neural
Networks and Bayesian Classifiers, in: IEEE
Transactions on Medical Images, Vol. 29, No. 2,
February 2010.
Witten, IH, Frank, E. Data mining: practical machine
learning tools and techniques with Java
Implementation. USA: Morgan Kaufmann, 1999.
IMTA-52015-5thInternationalWorkshoponImageMining.TheoryandApplications
28
