
Tracking Project Progress with Earned Value Management Metrics
A Real Case
Maria Teresa Baldassarre
1
, Nicola Boffoli
1
, Danilo Caivano
1,2
and Giuseppe Visaggio
1,2
1
Department of Informatics, University of Bari, Bari, Italy
2
SER&Practices SPIN-OFF, Bari, Italy
Keywords: Earned Value Management, Decision Model, Project Monitoring.
Abstract: According to the Project Management Institute (PMI) project management consists of planning, organizing,
motivating and controlling resources such as time and cost in order to produce products with acceptable
quality levels. As so, project managers must monitor and control project execution, i.e. verify actual
progress and performance of a project with respect to the project plan and timely identify where changes
must be made on both process and product. Earned Value Management (EVM) is a valuable technique for
determining and monitoring the progress of a project as it indicates performance variances based on
measures related to work progress, schedule and cost information. This technique requires that a set of
metrics be systematically collected throughout the entire project. A consequence is that, for large and long
projects, managers may encounter difficulties in interpreting all the information collected and using it for
decision-making. To assist managers in this tedious task, in this paper we classify the EVM metrics
distinguishing them into five conceptual classes and present an interpretation model that managers can
adopt as checklist for monitoring EVM values and tracking the project’s progress. At this point of our
research the decision model has been applied during an industrial project to monitor project progress and
guide project manager decisions.
1 INTRODUCTION
Project management is the discipline of planning,
organizing, motivating, and controlling resources in
order to fulfil specific goals, whereas a project is a
temporary effort with a defined start and end point,
usually time and budget constrained, carried out to
meet unique goals and objectives and deliver results
that provide added value and innovations to current
practices on time and within budget (Pyster and
Thayer 2005, PMI 2013) conforming to certain
quality expectations.
The phases of the project management lifecycle
include: project initiation, planning, execution,
monitoring and control and closing (Figure 1) (PMI
2013). In planning project managers define project
plans. While in monitoring and controlling they
track and regulate the progress and performance of a
project and identify project parts where changes
must be applied. Successful project completion
requires that managers continuously monitor and
control the execution and progress of the activities
with respect to the plan and adopt corrective actions
whenever necessary. Under such conditions it is
crucial that project performances be observed and
measured regularly to identify variances from the
project plan, comparing for example differences
between actual values (budget, resource
consumption, start finish dates) and planned ones.
This is especially true in software contexts where,
being human-centred it is difficult to predict factors
such as productivity and performances, and therefore
project duration and costs. Literature provides
several evidences of software project failure
(Marshal 2006, Pressman 2002, Standish Group
2010).
Figure 1: Project Management Lifecycle Processes (PMI
2013).
502
Teresa Baldassarre M., Boffoli N., Caivano D. and Visaggio G..
Tracking Project Progress with Earned Value Management Metrics - A Real Case.
DOI: 10.5220/0005470305020508
In Proceedings of the 17th International Conference on Enterprise Information Systems (ICEIS-2015), pages 502-508
ISBN: 978-989-758-097-0
Copyright
c
2015 SCITEPRESS (Science and Technology Publications, Lda.)

Earned Value Management - EVM (PMI 2013)
is considered among the most reliable for objectively
tracking performance and progress of a project.
According to Efe and Demirors (2013) EVM is
defined as “Management with lights on”. Traces of
this technique date back to the 1800s before being
adopted in military domains such as NASA (2010)
and DoD (DoD 1998, DoD 2002, EVM 2000, PMI
2013) There are also several evidences of the
success of this technique for project monitoring and
control (Jaafari 1996, Raby 2000, Wells and Duffey
2003, Fleming and Koppelman 1998, Australia
2006, Sulaiaman 2006). There is little support in
literature on decision support tools that guide data
collection and interpretation as pointed out in other
studies as well (Nkasu and Leung 1997, Basili et al.
2002, Garcia et al. 2004, Donzelli 2006).
Given this gap, our intention in this paper is to
clarify the meaning of EVM indicators and provide
guidance for their interpretation. Our contribution is
therefore twofold:
Conceptual Categories: we have organized the
EVM indicators in conceptual categories each
with a specific meaning and scope;
Decision Model: we have provided a decision
model able to guide project managers in
interpreting EVM metric values and support
them in making the most appropriate decisions
during project execution.
The proposed solutions have been validated in a
real industrial case study. Within the study, the
conceptual classes and decision model have been
used to apply the EVM metrics and interpret their
values during monitoring and control activities of
the entire project, in order to support decision
making.
The rest of the paper is organized as follows: in
the next section we describe the conceptual classes
used to classify the EVM metrics, as well as the
decision model we propose for interpreting EVM
values. In section 3 we have presented how the
model has been used in a real industrial case study
where managers adopted the model for monitoring
project performances. Finally conclusions are drawn.
2 PROPOSAL: CONCEPTUAL
CATEGORIES AND DECISION
MODEL FOR EVM METRICS
Managing a project, independently from its
application domain, involves going through three
phases (Figure 2): (i) define work; (ii) schedule &
budget; (iii) measure performance. In “define
work”, project activities are identified and a work
breakdown structure (or similar) is developed in
order to identify the relations between the activities
and work products. This structure should be detailed
so the work can be categorized into individual
elements of work. Next, in the “schedule and
budget” phase, the project manager defines how the
WBS activities are organized; Scheduling also
involves arranging work packages into logical
frameworks that define the project milestones. As
the project progresses “monitoring and controlling”
processes are carried out to measure performances.
Figure 2: Project phases.
Literature offers several techniques such as
COCOMO II (Bohem 2000), Use Case Points
(Smith 2000) and Function Points (IFPUG 2004)
that use past project data to estimate size, effort and
cost. They do not allow to “monitor and control”
projects. Opposed to these are approaches such as:
GQM-QIP (Basili et al. 2002), PDCA (Tague 2004),
TQM (Mathews 2006), and EVM (PMI 2003). The
idea behind EVM is that it prevents rather than cures
by identifying and solving problems early, as soon
as they arise. It acts as an early alarm for signalling
trends and deviations from the original project plan,
so that a manager can promptly take action, make
corrections and get the project back on track, in line
with schedule and budget restrictions. It is important
that the technique be systematically applied
throughout the project in order to detect variances
when they are small and easy to correct, instead of
discovering unpleasant surprises at the end of the
project, when the situation is unrecoverable and the
project is bound to fail or be cancelled. EVM is
made up of several metrics that may generate
confusion for a project manager having to collect,
measure, analyse and interpret them during the
project lifecycle. To this end, we have proposed a
classification of the metrics and organized them in
conceptual categories.
TrackingProjectProgresswithEarnedValueManagementMetrics-ARealCase
503

2.1 EVM Conceptual Categories
The categories identified reflect the general meaning
of the metrics and their application with respect to
project progress. The classification consists of five
categories:
2.1.1 Project Constraints
When defining the project plan the project manager
must take into account the project constraints such
as budget available, resources that can be assigned to
the project activities, and time restrictions. In this
sense, two relevant indicators that represent this
information are: (i) Budget At Completion (BAC),
expresses an initial estimation of budget allocated to
the project; (ii) Time At Completion (TAC),
expresses the initial estimation of time required to
complete all the project activities. Both these
indicators (Figure 3) are fixed and established when
the project plan is defined.
TAC
Startup
% Budget
Costs
(K€)
100%
50%
0%
BAC
0
Time
BCWS
ACW P
BCWP
CV
SV
Figure 3: EVM metrics.
2.1.2 Basic Indicators
This category is made up of three metrics that
express the earned value of the project at a certain
point in time, generally in correspondence to a
milestone established in the project plan: (i)
Budgeted Cost of Work Scheduled (BCWS):
planned value, is the amount of money budgeted to
complete the scheduled work; (ii) Budgeted Cost of
Work Performed (BCWP): earned value, is the
budgeted cost of work that has actually been
performed in carrying out a scheduled task at a
certain time point, usually related to a milestone;
(iii) Actual Cost of Work Performed (ACWP): the
actual cost sustained for carrying out the project up
to a specific milestone.
2.1.3 Derived Indicators
This category comprises two metrics obtained from
the basic ones that express variances between
planned and actual values collected in the milestone
check points, in absolute values: (i) Cost Variance
(CV = BCWP-ACWP): expresses the difference
between the cost of the work performed in
accordance to the project plan carried out up to a
specific point in time (BCWP) and the actual cost
sustained; (ii) Schedule Variance (SV=BCWP-
BCWS): expresses the difference between the cost
of the work carried out up to a certain point in time
and the cost of work that should have been done
according to the project plan (BCWS).
2.1.4 Synthesis Indicators
These metrics express synthetic information in
percentages. Cost Performance Index (CPI) and
Schedule Performance Index (SPI) are indicators of
how closely accomplished work is on budget and
schedule: (i) Cost Performance Indicator (CPI =
BCWP/ACWP) shows the efficiency of the
utilization of the resources on the project. (ii)
Schedule Performance Indicator (SPI =
BCWP/BCWS) shows how the work is progressing
compared to the original schedule.
Both of these formulas begin with the Earned
Value (BCWP), which is the value of the work
already accomplished. SPI and CPI ratios help
managers evaluate the project at any point and make
changes.
A manager should first calculate these two
synthesis indicators to have an idea of the project
status and whether there is a deviation (positive or
negative) from the baseline and then go into detail
by considering the derived indicators (SV and CV),
which provide a quantitative (absolute value)
evaluation of the deviation.
2.1.5 Predictive Indicators
This category includes two metrics that express the
estimate at completion (EAC) which forecasts the
value of the project with respect to time and cost
when the project is complete. Studies show that
EACs based on CPI and SPI values tend to be
significantly higher and are also more accurate
(Christensen and Thayer 2001). We have adopted
the following formulas for calculating them: (i)
Estimate At Completion – Cost (EACC =
BAC/CPI): expresses the amount of money
estimated to be spent at the end of the project given
its progress; (ii) Estimate At Completion – Time
(EACT = TAC/SPI): estimates the end time of the
project given the current state of progress.
Keep in mind that although BAC and TAC are
fixed at the beginning of the project, the EAC values
most likely change compatibly and conformingly as
ICEIS2015-17thInternationalConferenceonEnterpriseInformationSystems
504

the synthesis indicators change during project
execution.
2.2 Decision Model
The concept of granularity is very important in the
application of EVM and interpretation of the
collected values. In particular, SPI, CPI, SV and CV
measured at a project level (high granularity) are
useful for top management, portfolio/program
managers, but turn out to be almost insignificant for
a project manager who, without any other
information, is not able to make any considerations
or valuable interpretations. On the other hand, if the
indicators are calculated with respect to an
individual sub-project, phase, task (low granularity),
rather than the overall project, it is possible to:
monitor the actual state of the sub-project, phase,
task compared to the project plan; designate
budget/resources saved on an activity to mitigate
risks related to other late or over budget activities,
allowing to optimize project performances. The level
of granularity as well as milestone checkpoints, with
respect to which entity and how often EVM
indicators are to be collected, should be defined at
project start, taking into account the critical points
and risk factors and can be changed during
execution, if the case.
The resulting amount of data collected at each
milestone checkpoint during the entire project is
considerable. As so, its interpretation can become
quite challenging for a project manager and for the
entire management team involved in analysing the
data, identifying weaknesses, avoiding problems
from occurring and promptly acting when they arise.
For this reason, as practical support to the EVM
technique we have provided a decision model
(Figure 4) to use at each milestone checkpoint. The
model basically guides monitoring activities step by
step as collected values are reported in the form and
compared to baseline values. Secondly,
interpretation guidance is provided in order to
optimize project management by using/re-allocating
available resources at their best, verifying critical
points and mitigating delays or over budget risks.
Those who are responsible of managing work
use this data in order to understand cost and
schedule performances throughout the project
lifecycle. The main goal is to point out (cost and
schedule) issues early providing the maximum time
to minimize their impact and provide an effective
manner for developing recovery plans and
improvement actions where necessary.
Figure 4: Decision Model for interpreting EVM metrics.
3 APPLICATION TO A REAL
CASE
The conceptual categories classification and decision
model have been applied in an industrial case study
within a nationally funded project (here called E-
MARK for convenience) that involved a University
and a large IT company. The project focused on
designing and developing a solution able to
automate marketing processes through use of
technologies that make use of traceable information
on the Internet. Project monitoring and control was
carried out with EVM metrics. Project managers
used the proposed classification of conceptual
classes as reference to systematically collect and
organize the values during project execution.
Furthermore, they adopted the decision model
illustrated in the previous section to guide
interpretation of collected values. Throughout the
next paragraphs detail of the project monitoring
progress is provided.
The project was organized in four work packages
and nine activities. The granularity selected for
applying the indicators related to each activity at
fixed milestones.
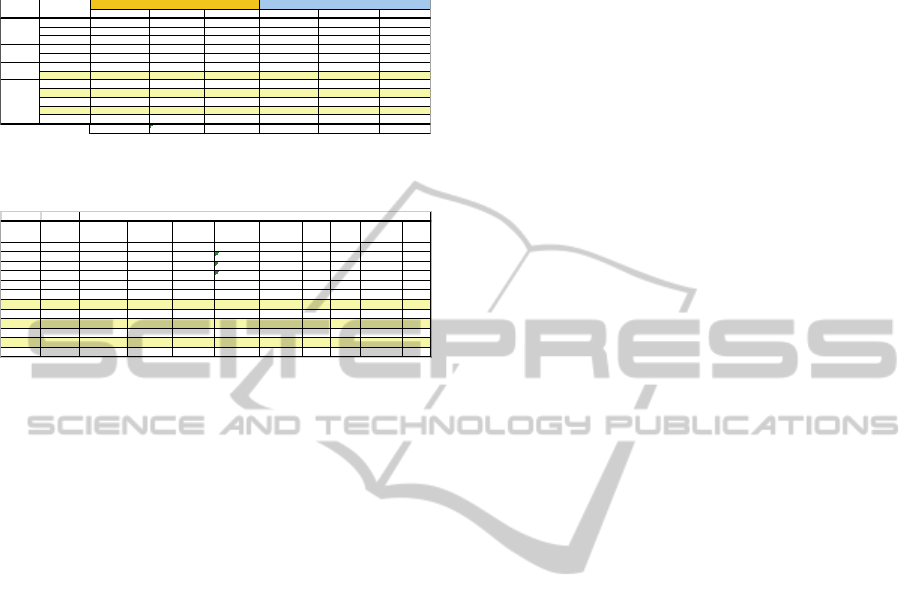
In Figure 5 the planned effort and costs with
respect to each project activity are reported. They
are compared to the actual values collected during
the project. Furthermore, Figure 6 shows the values
of EVM indicators for every activity. In the
TrackingProjectProgresswithEarnedValueManagementMetrics-ARealCase
505
following we report the results of the interpretations
carried out, after applying the decision model to the
EVM indicators collected.
WP ACTI
V
ITIES
PERSON/DAYS COST SOLAR DAYS
PLANNED
PERSON/DAYS COST SOLAR DAYS
ACTUAL
A1
A2
A3
A4
A5
A6
A6
A7
A7
A8
A8
A9
W
P4
WP1
WP2
WP3
48 8.151,60€ 18
9,6 1.630,32€ 3,6
81,6 13.857,72€ 30,6
14,4 2.445,48€ 5,4
48 8.151,60€ 18
91,2 15.488,04€ 34,2
144 24.454,80€ 54
33,6 5.706,12€ 12,6
9,6 1.630,32€ 3,6
480 81.516,00€ 180
40,07 8.005,36€ 18
8,01 1.601,07€ 3,6
60,1 12.008,04€ 27
12,02 2.401,61€ 5,4
20,03 4.002,68€ 9
76,13 15.210,18€ 34,2
16,03 3.202,14€ 7,2
120,20625 24.016,08€ 54
12,02 2.401,61€ 5,4
28,05 5.603,75€ 12,6
4,01 800,54€ 1,8
4,01 800,54€ 1,8
400,68 80.053,60€ 180
Figure 5: descriptive statistics of planned and actual
values.
ACTIVITY
% of
progress
A1 10%
A2 12%
A3 27%
A4 30%
A5 35%
A6 54%
A6 58%
A7 88%
A7 91%
A8 98%
A8 99%
A9
100%
BCWP BCWS SV ACWP CV SPI CPI EACC EACT
8.151,60 8.151,60 0,00 8.005,36 146,24 1,00 1,02 80.053,60 6,00
9.781,92 9.781,92 0,00 9.606,43 175,49 1,00 1,02 80.053,58 6,00
23.639,64 22.009,32 1.630,32 21.614,47 2.025,17 1,07 1,09 74.532,66 5,59
26.085,12 24.454,80 1.630,32 24.016,08 2.069,04 1,07 1,09 75.050,25 5,63
34.236,72 28.530,60 5.706,12 28.018,76 6.217,96 1,20 1,22 66.711,33 5,00
41.980,74 44.018,64 -2.037,90 43.228,94 -1.248,20 0,95 0,97 83.939,70 6,29
49.724,76 47.279,28 2.445,48 46.431,09 3.293,67 1,05 1,07 76.116,54 5,70
61.952,16 71.734,08 -9.781,92 70.447,17 -8.495,01 0,86 0,88 92.693,64 6,95
74.179,56 74.179,56 0,00 72.848,77 1.330,79 1,00 1,02 80.053,60 6,00
77.032,62 79.885,68 -2.853,06 78.452,52 -1.419,90 0,96 0,98 83.018,54 6,22
79.885,68 80.700,84 -815,16 79.253,06 632,62 0,99 1,01 80.870,47 6,06
81.516,00 81.516,00 0,00 80.053,60 1.462,40 1,00 1,02 80.053,60 6,00
EVM INDIC
A
T
O
R
V
A
LUES
Figure 6: EVM values for the entire project.
The TAC (initial estimation of project duration) is 6
months, while BAC (initial estimation of project
cost) is €81.516,00. The first activity (A1) required
18 solar days, according to the plan, and a total of 40
person/days (p/d) compared to 48 planned with a
lower cost. The EVM indicators for this activity
confirm this data. In A2, descriptive statistics show
that actual values are lower than planned ones. The
project was proceeding correctly and project
managers decided to designate the extra budget to
future activities. In A3, the activities were carried
out in less time with respect to planned (27 solar
days, and 60 p/d, compared to 30 solar days and 81
p/d planned). In accordance to the interpretation of
the decision model, project managers decided to
designate part of the budget not spent and the
resources assigned to this task. In A4 the trend of
EVM indicators confirms the results of the previous
phases as they satisfy the baseline values of the
decision model. As it appears from both the
descriptive statistics and the EVM values, A5 was
carried out with less effort and cost than planned.
In A6, when the milestone checkpoint was
carried out, the project was behind schedule and not
completed yet. At this point the EVM indicators
pointed out a situation over budget as more than
expected was being spent and project cost and effort
were higher than planned. As improvement action
managers decided to designate part of the resources
saved in the previous phases to the current one.
Consequently, staff that had terminated activities
early and had the required skills were assigned to
this activity. Also, part of the budget saved in the
previous phases was also shifted to this one. This
improvement action had positive effects, i.e. at the
next milestone checkpoint the EVM indicators had
returned within the baseline values. Having
recovered both budget and resources from previous
activities, the overall budget and effort for the
project were not impacted. Indeed, the EVM
indicators related to A6 are inline with the baseline
values. This was possible because manager decisions
in previous checkpoints were taken in order to
prevent difficulties in further activities. In A7
another delay occurred. After a period of 54 days,
the activity was not completed. The EVM indicators
confirm this situation for A7 (Figure 6 first row),
which are below the threshold values. Managers
reallocating resources from previous activities or
from activities that were ahead of schedule and
below budget and shifted them to A7. For what
concerns A8, after 12.6 days it was not completed
(Figure 5). A9 requested fewer resources in terms of
performances and cost to be carried out, and
consequently indicators SPI and CPI returned to
satisfy the baselines.
Having collected EVM values during milestones
with a granularity related to activities rather than
work packages or entire project, allowed the project
managers to appropriately monitor and control the
general trend of the performance indicators and
readily act to recuperate delays accumulated during
the project. Indeed, the resources saved in on-
schedule/budget activities were allocated on other
critical off-schedule/budget ones. As so, delays were
mitigated by improvement actions without impacting
on the overall final project cost and effort, which by
the end of the project turned out to be within the
expected thresholds. Deviations from the plan in
some activities were successfully recovered in other
ones by readily reallocating budget and effort to face
problematic situations pointed out during monitoring
checks. Having adopted a decision model to guide
the interpretation of indicators turned out to be
helpful as it simplified the entire monitoring and
control process as the project progressed in time.
4 DISCUSSION AND
CONCLUSIONS
Earned Value Management technique is easy to
understand and apply. Nonetheless, there are several
critical factors that any manager should keep in
mind: collecting cost values at a low level of
granularity requires an advanced level of
ICEIS2015-17thInternationalConferenceonEnterpriseInformationSystems
506

management control, as costs must be broken down
conformingly to the level of detail chosen;
determining the percentage of completion of an
activity requires “structured processes” and careful
evaluations.
EVM allows to achieve an objective evaluation
of risk and project status and, at the same time,
provides useful indicators that allow to change
management strategies, increasing or decreasing
resources assigned to activities based on
performances, in order to improve and optimize the
general progress of the project in terms of cost and
time.
Tracking earned value is of little value if the
estimating and analysis capability that it provides is
not used to operatively manage the project as it
progresses. Furthermore, reporting real project status
systematically, at regular intervals provides an
opportunity to serve as early alarm and address
potential problems readily, before it is too late and
avoid cost overrun and schedule slippage. For this
reason it is important that project managers adopt
this approach and use the decision model for
conducting project monitoring and interpreting the
indicators collected in specific milestones and
granularity entities, fixed at the beginning of the
project, in order to prevent problems from occurring
and promptly act when they arise.
EVM is not the silver bullet for project
monitoring and control, however it surely provides a
higher level of control on the project execution.
Applying our proposal to a real case has pointed out
how the classification in conceptual categories sheds
light on the multitude of EVM metrics that a
manager must handle during project monitoring
activities. Also, the decision model supported
managers in decision-making during the entire
project. This technique, given its features is more
appropriate for medium to large structured contexts
rather than small and agile ones.
We are currently refining the decision model so
it can be better tailored to any task, activity, phase,
of a project and therefore be adapted to any desired
level of granularity according to the project needs. It
is also being implemented in a decision support
system tool, as the model has been formalized in
decision tables. This solution will provide automated
support to project managers allowing them to
monitor and control EVM values with less effort.
REFERENCES
Pyster A.B., Thayer R.H., 2005, “Software engineering
project management 20 years later”, IEEE Software,
22(5), pp.18-21.
PMI, 2013, A Guide to the Project Management Body of
Knowledge (PMBOK® Guide) - Fifth Edition, PMI.
PMI, 2005, Practice Standard for Earned Value
Management.
NASA, 2010, Earned Value Management Web Site -
http://evm.nasa.gov/
DoD 2002, 5000.2-R, “Mandatory Procedures for MDAPS
and MAIS Acquisition Programs”, April 2002.
EVM, 2000, “The Earned Value Management Maturity
Model”, Version 0.0, Initial Public Draft, Management
Technologies”,
DoD, 1998, The Program Manager’s Guide to Software
Acquisition Best Practices, Version 2.1.
Marshall R.A., 2006, “The contribution of earned value
management to project success on contracted efforts: a
quantitative statistics approach within the population
of experienced practitioners”, PMI 2006.
Jaafari A., 1996, “Time and priority allocation scheduling
technique for projects”, IJPM 14(5), pp.289-299.
Wells E, Duffey M., 2003, “A model for effective
implementation of earned value management
methodology”. IJPM, 21(5),
Raby M., 2000, “Project management via earned value”,
Work study 49(1), pp6-10.
Donzelli P., 2006, “A decision support system for
software pm”, IEEE Sw, 23(4), pp.65-75.
Garcia M.N., Quintales L.A, Penalvo F.J., Martin M.J.,
2004,“Building knowledge discovery-driven models
for decision support in pm” DSS, 38(2).
Nkasu M.M., Leung K.H., 1997, “A resources scheduling
decision support system for concurrent pm”, J.
production research, 35(11), pp.3107-3132.
Plaza M., Turetken O., 2009, “A model based DSS for
integrating the impact of learning in project control”,
Decision Support Systems, 47(2009), pp.488-488.
Basili V.R., McGarry F.E., Pajerski R., Zelkowitz MV.,
2002, “Lessons learned from 25 years of process
improvement: the rise and fall of the NASA software
engineering laboratory”, 24th ICSE 2002, pp.69-79.
Tague N.R., 2004, The Quality Toolbox, Second Edition,
ASQ Quality Press, 2004, pp. 390-392.
Matthews C.R., 2006, “Linking the supply chain to
TQM”, Quality Progress, November 2006.
Christensen D.S., 2006, “Project advocacy and the
estimate at completion problem”, J. Cost Analysis.
Christensen M.J, Thayer H.R., 2001, The project
managers guide to software engineering best
practices, IEEE Computer Soc,
Pressman R., 2002, Software engineering: a practical
guide, Standish Group. 2010, “Chaos summary 2010”,
the Standish Group International, Inc. TR, 2010.
Australia, 2006. AS 4817-2006 Australian Standard 4817-
2006: Project performance measurement using EV.
Fleming Q.W, Koppelman J.M, 1998, “Earned Value
project management: a powerful tool for software
projects”, CrossTalk, The J.of Defense Software
Engieering, 4, 19-23.
TrackingProjectProgresswithEarnedValueManagementMetrics-ARealCase
507

Sulaiman T, Barton B, Blackburn T., 2006, “AgileEVM –
Earmed Value Management in Sccrum Projects”,
Proc.of AGILE 2006 Conference IEEE CS.
Boehm B., 2000, Software Cost Estimation with
COCOMO II. Prentice Hall, New Jersey.
IFPUG, 2004, Counting practices manual v4.2.
Smith J., 2000, “The estimation of effort based on use
cases”.
Efe P., Demirors O., 2013, “Applying EVM in a software
company: benefits and difficulties”, 39
th
Euromicro
Conference series on software engineering and
advanced applications, pp.333-340.
ICEIS2015-17thInternationalConferenceonEnterpriseInformationSystems
508
