
Utilitarian Value and Hedonic Value of Mobile Service
Focusing on Mobile Addiction
Soon Jae Kwon
Department of Business Adminstration, DAEGU University, Kyong San, Korea
Keywords: Mobile Service, Mobile Addiction, Utilitarian Value, Hedonic Value, Fun, Moderating Effect.
Abstract: Mobile addiction (MA) has become more prevalent nowadays especially with the advancement of mobile
services. This study is focus on studying MA in the context of users’ perceived hedonic and utilitarian
values. This is done by empirically analysing the moderating effect of MA against three constructs which
are users’ perceived hedonic value (PHV), perceived utilitarian value (PUV), perceived usefulness (PU) and
fun experienced by using mobile service. A total of 166 participants were involved in the survey. The results
showed that only the relationship between perceived hedonic value and fun was not moderated by mobile
addiction. Meanwhile, the rest of the hypothesized relationships were supported.
1 INTRODUCTION
The wide usage of mobile devices are mostly
supported by various mobile services such as short
message service (SMS), digital multimedia
broadcast (DMB), wireless Internet, and
entertainment applications, such as wireless online
games and music. Mobile service can have either
hedonic or utilitarian value to potential users, and it
is necessary to consider both values when
investigating user acceptance of mobile service.
Deci (1975) suggested that user acceptance is
determined by two fundamental types of motivation
which is extrinsic and intrinsic. An extrinsically
motivated user is driven by the expectation of a
reward or benefit external to system-user interaction
(perceived usefulness), while an intrinsically
motivated user is driven by benefits derived from
system-user interaction (perceived fun). Igbaria et al.
(1994, 1996) found system usage to be affected by
both extrinsic and intrinsic motivation and Bruner II
and Kumar (2005) introduced fun in the user
acceptance model of handheld Internet devices. The
development of mobile technology means users can
afford to use fancier mobile equipment and enjoy
higher quality mobile services, regardless of time
and place. However, easy access to high-quality
mobile service may lead users to a compulsive usage
state, mobile addiction (MA). The primary purposes
of this study are as follows. Firstly, assume that
mobile users have at least one of two values which
are hedonic or utilitarian. Secondly, the moderating
effect of MA is analysed to see its effect on mobile
users’ intention to use mobile services.
2 THEORETICAL
BACKGROUNDS AND
RESEARCH MODEL
2.1 Utilitarian/Hedonic Values
Consumer behaviour literature has demonstrated that
specific determination of intention to consume
depends on the utilitarian or hedonic attributes of the
product (Babin et al. 1994; Okada 2005). Based on
this finding, this study concluded that user intention
to use mobile service is shaped by the utilitarian or
hedonic value derived from their experience using
mobile services (Chiu et al. 2005). Users’ perceived
value of mobile services is therefore defined as
perceived utilitarian value and perceived hedonic
value. In general, an IS possesses various utilitarian
attributes, and users perceive the usefulness of
utilitarian attributes while experiencing the IS
(Adams et al. 1992). It has also been found (Babin et
al. 1994; Okada 2005; Voss et al. 2003) that the
utilitarian value of products and services influences
consumers’ perceived usefulness, ultimately
affecting consumer behaviour. This is proposed by
the following hypotheses:
H1: Perceived utilitarian value of mobile service
has a positive influence on perceived usefulness.
621
Jae Kwon S..
Utilitarian Value and Hedonic Value of Mobile Service - Focusing on Mobile Addiction.
DOI: 10.5220/0005476106210626
In Proceedings of the 11th International Conference on Web Information Systems and Technologies (WEBIST-2015), pages 621-626
ISBN: 978-989-758-106-9
Copyright
c
2015 SCITEPRESS (Science and Technology Publications, Lda.)
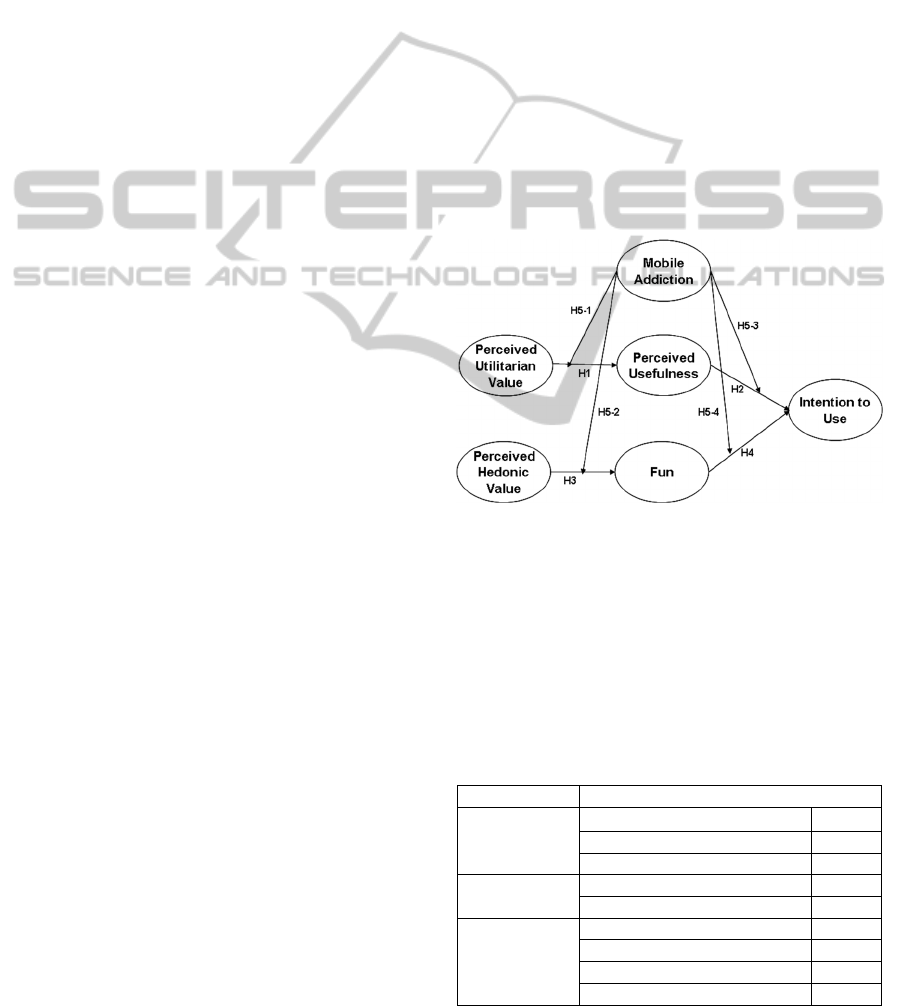
H2: Perceived usefulness of mobile service has a
positive influence on intention to use mobile service.
On the other hand, users tend to experience
intrinsic motivation (Davis et al. 1992) or fun (Babin
et al. 1994; Voss et al. 2003) strongly when they
perceive hedonic value on particular IS/ITs (Bruner
II and Kumar, 2005). According to Okada (2005),
users justify their use of products by continuing to
consume them once they perceive fun is connected
to hedonic value. Therefore, mobile users will
perceive fun in their mobile service if they
experience a particular hedonic value about that
service:
H3: Perceived hedonic value of mobile service
has a positive influence on fun.
2.2 Fun
Triandis (1971) argued that affect, the feelings of
joy, elation, pleasure, depression, disgust,
displeasure, or hate associated with a particular act,
have an impact on a person's behaviour. Sandelands
et al. (1983) found that such attitudinal outcomes of
positive affect, pleasure, and satisfaction are results
from playful experiences. Therefore, individuals
who perceive using mobile service as fun will have a
positive intention about using them:
H4: Perceived fun in using mobile service will
positively affect intention to use mobile service.
2.3 Mobile Addiction
MA is related to a type of addictive behaviour
defined (Mendelson and Nancy, 1986) as behaviour
that is excessive, compulsive, beyond the control of
the person who engages in it, and destructive
psychologically or physically. Li and Chung (2006)
suggested that Internet addictive behaviour is
affected by psychopathology factors such as
depression and anxiety and personality factors such
as neurosis, openness, and consciousness. Davis
(2001) used the cognitive-behaviuor model to
explain pathological Internet use, which is similar to
Internet addictive behaviour. Similarly, MA can also
be defined as compulsive consumption. O'Guinn and
Faber (1989) define MA as a response to an
uncontrollable drive or desire to obtain, use, or
experience a feeling, substance, or activity that leads
an individual to repetitively engage in a behavior
that will ultimately cause harm to himself and/or
others.
Terel, Serenko and Giles (2011) studied the online
auction addiction. According to their study, the level
of addiction distorts the way information technology
artifact is perceived. In this study, MA is a
moderating variable used to analyse mobile service
users’ acceptance behaviour. As users are affected
by their addiction, it is expected that their perception
towards mobile services will also be affected.
Therefore, the following hypotheses are related to
MA as moderating variable:
H5-1: Mobile addiction has a negative (-)
moderating effect on the relationship between
perceived utilitarian value and perceived usefulness.
H5-2: Mobile addiction has a negative (-)
moderating effect on the relationship between
perceived hedonic value and fun.
H5-3: Mobile addiction has a negative (-)
moderating effect on the relationship between
perceived usefulness and intention to use mobile
service.
H5-4: Mobile addiction has a negative (-)
moderating effect on the relationship between fun
and intention to use mobile service.
Figure 1: Proposed Research Model.
3 RESEARCH METHODOLOGY
A survey was conducted to gather the necessary
user’s data among university students in South
Korea consisted of 166 respondents. Table 1 shows
the demographic characteristics of the sample.
Table 1: Demographic Characteristics of the Sample.
Variables Sample Composition
Age Group
20– 23 years old
36
24 – 26 years old 101
27 – 29 years old 26
Gender
Female 39
Male 127
Daily usage of
mobile device
1 – 3 hours 8
4 – 6 hours 44
7 – 9 hours 57
More than 10 hours 57
WEBIST2015-11thInternationalConferenceonWebInformationSystemsandTechnologies
622
The measurements consisted of intention to use
(Ajzen and Fishbein, 1980), perceived usefulness
(Davis, 1989), fun (Venkatesh, 2000), MA (Charlton
and Danforth, 2007) and perceived hedonic and
utilitarian value (Voss et al., 2003). Partial least
square (PLS) was used to analyze the field survey
data because it places minimal restrictions on sample
size and residual distribution (Chin et al. 2003). PLS
employs a component-based approach for estimation
purposes (Lohmoller 1989). In general, PLS is better
suited for explaining complex relationships because
it avoids the problems of inadmissible solutions and
factor indeterminacy (Fornell and Bookstein 1982).
This study thus chose PLS to accommodate the large
number of variables and measuring the moderating
effects. The reliability, convergent and discriminant
validity of the instrument were first examined. Table
2 shows that all but one loading are larger than the
suggested threshold of 0.70 (Chin, 1998). Table 3
shows that all composite reliabilities are larger than
the suggested 0.70 and all AVE values are greater
than the suggested 0.50 indicating a good
convergent validity of the measurement model
(Barclay et al, 1995; and Fornell and Larcker, 1981).
Table 2: Loadings and Cross-Loadings.
PUV PHV PU FUN MA IU
PUV1
0.828
0.417 0.477 0.317 -0.271 0.621
PUV2
0.874
0.515 0.549 0.420 -0.299 0.661
PUV3
0.755
0.450 0.341 0.447 -0.118 0.463
PUV4
0.861
0.508 0.407 0.497 -0.148 0.582
PUV5
0.873
0.514 0.441 0.520 -0.176 0.577
PHV1 0.525
0.811
0.264 0.725 -0.002 0.455
PHV2 0.538
0.864
0.355 0.630 -0.025 0.450
PHV3 0.458
0.868
0.211 0.562 0.049 0.412
PHV4 0.423
0.837
0.323 0.562 0.016 0.364
PHV5 0.471
0.873
0.292 0.646 0.035 0.483
PU1 0.394 0.327
0.829
0.235 -0.184 0.349
PU2 0.339 0.301
0.748
0.207 -0.140 0.214
PU3 0.498 0.233
0.867
0.233 -0.239 0.457
PU4 0.499 0.287
0.846
0.281 -0.295 0.478
FUN1 0.432 0.611 0.197
0.890
-0.045 0.403
FUN2 0.463 0.719 0.318
0.938
0.037 0.363
FUN3 0.526 0.713 0.288
0.930
-0.044 0.431
MA1 -0.195 0.033 -0.180 0.025
0.765
-0.134
MA2 -0.257 -0.092 -0.263 -0.143
0.792
-0.238
MA3 -0.201 -0.072 -0.238 -0.069
0.785
-0.110
MA5 -0.116 0.144 -0.049 0.111
0.675
-0.033
MA6 -0.239 0.039 -0.202 0.044
0.787
-0.223
MA7 -0.089 0.103 -0.118 -0.009
0.532
-0.119
MA8 -0.002 0.130 -0.128 0.103
0.607
0.102
MA9 -0.077 0.124 -0.191 0.121
0.700
-0.052
IU1 0.660 0.493 0.441 0.400 -0.205
0.949
IU2 0.659 0.455 0.450 0.402 -0.255
0.968
IU3 0.674 0.511 0.467 0.432 -0.123
0.929
Reliability was assessed using internal
consistency scores, calculated by composite
reliability scores. Compeau et al. (1999) suggested
that for sufficient discriminant validity to be present,
items should load more strongly on their own
constructs, and the average variance shared between
each construct and its measures should be greater
than the variance shared between the construct and
other constructs. This can be seen in Table 2 that
items load much highly on their own latent
constructs than on any other latent constructs (cross-
loadings).
Table 3: Composite Reliability, Averages Variance
Extracted, and Correlations of First-Order Constructs.
Construct CR AVE
Square Roots of AVEs & Correlations*
1 2 3 4 5 6
1.PUV 0.9220.7050.839
b
2.PHV 0.9290.724 0.572 0.851
b
3 PU 0.8940.678 0.538 0.340 0.823
b
4.FUN 0.9420.845 0.517 0.743 0.293 0.919
b
5.MA 0.8900.506-0.252 0.016 -0.273 -0.018 0.711
b
6.IU 0.9640.900 0.701 0.513 0.478 0.434 -0.204 0.949
b
CR: Composite Reliability, AVE: Average Variance, Extracted,
b
p < 0.01
* The diagonal elements are the square roots of the variance
shared between the constructs and their measurement (AVE).
In addition, Table 3 shows that the square roots
of all AVEs are much larger than all other cross
correlations. Chin (1998) mentioned that
discriminant validity is achieved when the square
root of the AVE or a particular construct is larger
than the correlations between it and the other
constructs. Jointly, these findings suggest adequate
convergent and discriminant validity.
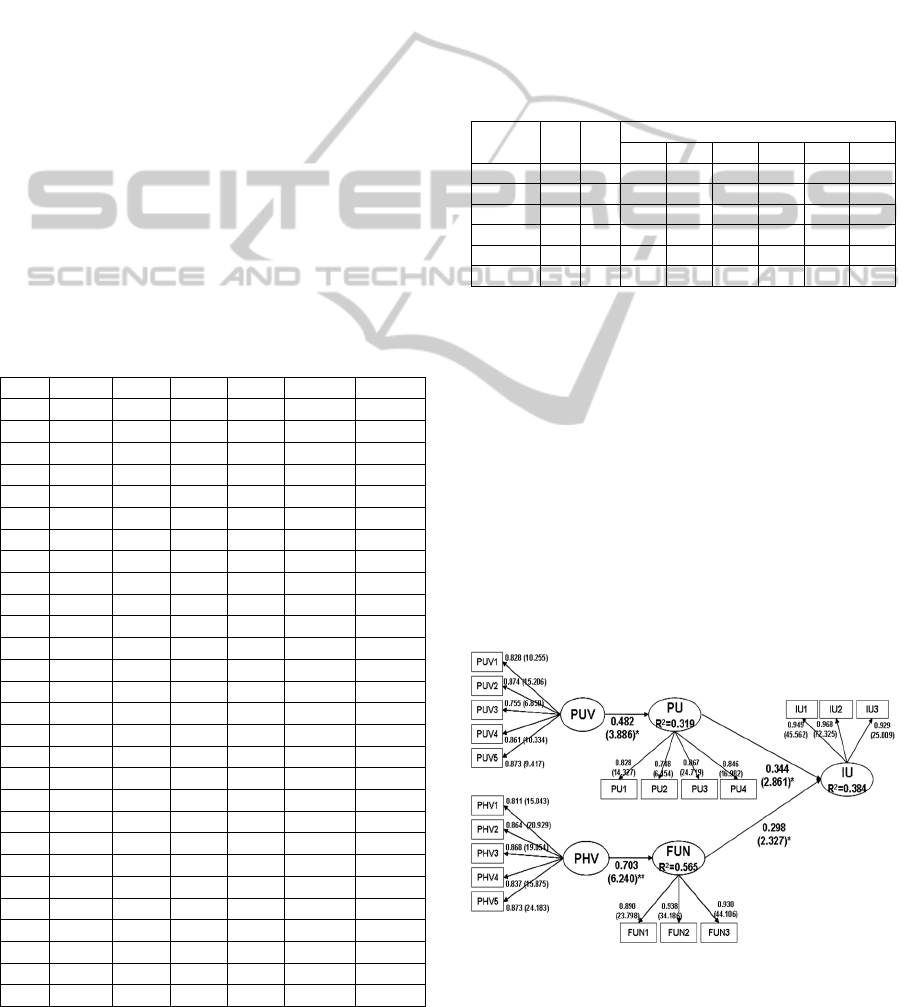
The results from standardized PLS path
coefficients are shown in Figure 2. The results
showed that Hypotheses 1, 2, 3 and 4 are supported.
Figure 2: PLS Results.
UtilitarianValueandHedonicValueofMobileService-FocusingonMobileAddiction
623
4 RESEARCH RESULTS
In order to test the moderating effects of Past
Experience, this study employed the PLS-PS
(product of sum) approach recommended by
Goodhue et al. (2003). The sums of the moderating
factor (Mobile Addiction) and four variables
(Perceived Utilitarian Value, Perceived Hedonic
Value, Perceived Usefulness and Fun) were
multiplied to generate the product of sums.
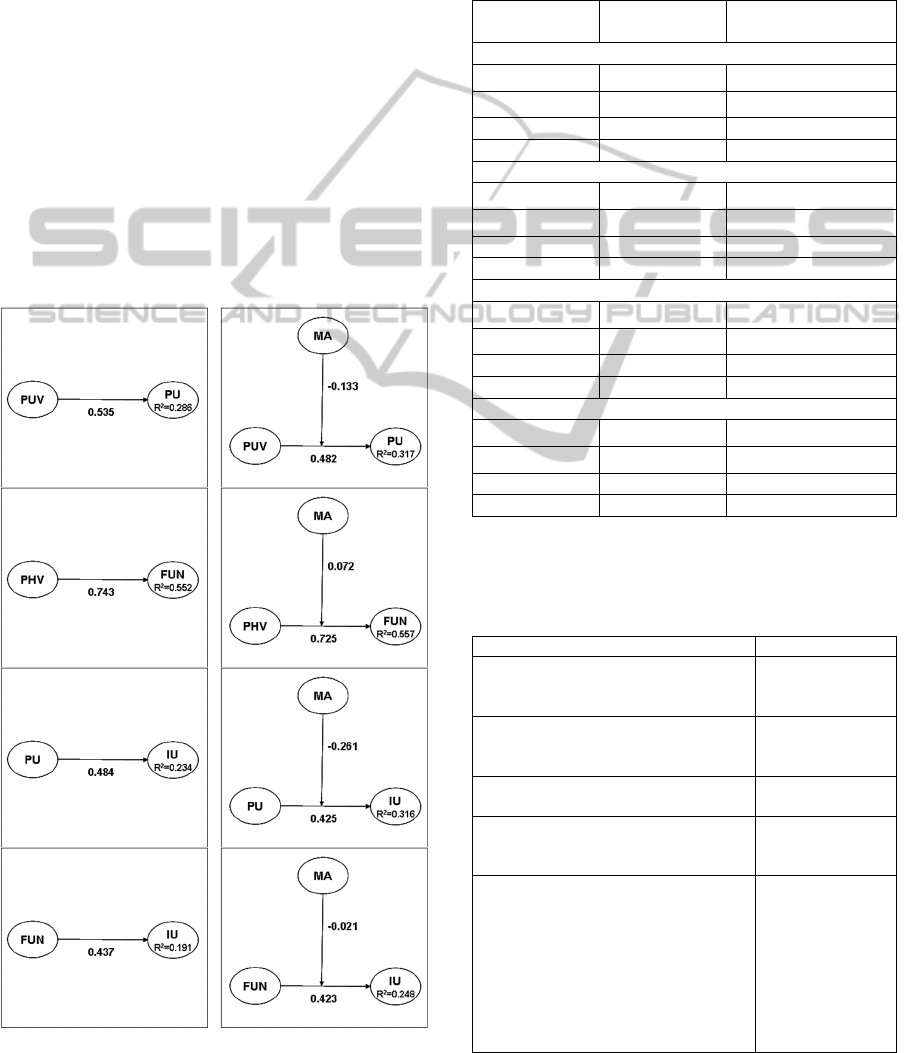
Then, a model including both direct and
moderating effects were examined and Hypotheses
5-1, 5-3 and 5-4 are supported. However, mobile
addiction does not have a moderating effect on the
relationship between perceived hedonic value and
fun, therefore Hypothesis 5-2 is not supported. The
formula recommended by Aguinis and Gottfredson
(2010) was used to compute the F-statistic and the
effect size (f
2
) is calculated by the formula suggested
by Mathieson et al. (2001). Meanwhile, the effect
size result was concluded based on the suggestion by
Figure 3: Direct effect and moderating effect.
Cohen (1988) that 0.02, 0.15 and 0.35 as operational
definitions of small, medium and large effect sizes
respectively. The steps taken to calculate the results
are shown in Figure 3. Meanwhile, the overall
results of the structural model are presented in Table
4.
Table 4: Results of the Structural Model.
Directs Effects
Direct Effects +
Moderating Effects
a. Dependent variable: PU; Independent variable: PUV
R
2
0.551 0.317
∆R
2
0.234 (f
2
= 0.043)
PUV 0.535 0.482
PUV x MA -0.133
b. Dependent variable: Fun; Independent variable: PHV
R
2
0.552 0.557
∆R
2
0.005(f
2
= 0.011)
PHV 0.743 0.725
PHV x MA 0.072
c. Dependent variable: IU; Independent variable: PU
R
2
0.234 0.316
∆R
2
0.082(f
2
= 0.107)
PU 0.484 0.425
PU x MA -0.261
d. Dependent variable: IU; Independent variable: Fun
R
2
0.191 0.248
∆R
2
0.057(f
2
= 0.070)
Fun 0.437 0.423
Fun x MA -0.021
Consequently, the results of hypothesis testing
are summarized in Table 5.
Table 5: Summary of Hypotheses Testing.
Hypotheses Supported?
H1: Perceived utilitarian value of
mobile service has a positive influence
on perceived usefulness.
Yes
H2: Perceived usefulness of mobile
service has a positive influence on
intention to use mobile service.
Yes
H3: Perceived hedonic value of mobile
service has a positive influence on fun.
Yes
H4: Perceived fun in using mobile
service will positively affect intention
to use mobile service.
Yes
H5a: Mobile addiction has a negative (-
) moderating effect on the relationship
between perceived utilitarian value and
perceived usefulness.
H5b: Mobile addiction has a negative (-
) moderating effect on the relationship
between perceived hedonic value and
fun.
Partially
supported. H5b is
not supported as
the effect size is
not significant.
However, H5a,
H5c and H5d are
supported.
WEBIST2015-11thInternationalConferenceonWebInformationSystemsandTechnologies
624

Table 5: Summary of Hypotheses Testing (cont.).
Hypotheses Supported?
H5c: Mobile addiction has a negative (-)
moderating effect on the relationship
between perceived usefulness and
intention to use mobile service.
H5d: Mobile addiction has a negative (-)
moderating effect on the relationship
between fun and intention to use mobile
service.
Partially
supported. H5b
is not supported
as the effect size
is not
significant.
However, H5a,
H5c and H5d are
supported.
5
DISCUSSION AND LIMITATIONS
This paper investigated the two important values in
user acceptance of mobile services, which are
utilitarian and hedonic value. The results gathered
shown that all investigated relationships are
supported. Both utilitarian and hedonic values are
critical perceived values in evaluating users’
acceptance of mobile services. Functionality as well
as the aesthetic value of a mobile service plays a role
in determining users’ acceptance. Therefore, mobile
service providers should consider both values when
developing new services. Secondly, this paper also
investigated the moderating effect of mobile
addiction on all the relationships proposed. The
results gathered shown that three out of the four
relationships are moderated by mobile addiction.
The relationship that was not moderated by mobile
addiction is the relationship between perceived
hedonic value and fun. This means that even if a
user is addicted to their mobile, the results show that
it will not be affecting the relationship between
perceived hedonic value and fun. Instead this
relationship is only effected by users perception of
how fun and enjoyable they are rather than because
they are addicted.
There are a few limitations in this study. As the
participants are university students, factors such as
flexible time could make it easier for them to be
addicted to a mobile service compare to full-time
workers. Furthermore, factors that make them
addicted to mobile service may also be different
compare to different group of users since they may
be exposed to different kind of services. Therefore,
mobile addiction among students is expected to be
more common compare to other group of users.
Secondly, rather than defining mobile service in
general, this study could come out with a better
results if focusing on only one mobile service.
However, this study’s results still are useful in order
to further develop a better study on mobile addiction
in the future.
6
CONCLUSIONS
This paper has highlighted the mobile addiction in
using mobile services. It is important to understand
that the availability of mobile services regardless of
place and time lead to development of addiction
between users and their mobile services. The most
interesting finding in this paper is that moderating
effect does not exist for relationship between
perceived hedonic value and fun. Since perceived
hedonic value is related to intrinsic motivation,
addiction does not have any effect on this
relationship. Instead it is effected by users
perception of having fun and enjoying themselves
rather than because they are addicted.
ACKNOWLEDGEMENTS
This work was supported by the Ministry of
Education of the Republic of Korea and the National
Research Foundation of Korea (NRF-
2014S1A5A2A01014933)
REFERENCES
Adams, DA., Nelson, RR, and Todd, PA. (1992)
Perceived usefulness, ease of use, and usage of
information technology: a replication, MIS Quarterly,
6 (2), 227–247.
Aguinis H and Gottfredson RK (2010) Best-Practice
recommendations for estimating interaction effects
using moderated regression, Journal of Organizational
Behaviour, 31, 776 – 786.
Ajzen I and Fishbein M, Understanding Attitudes and
Predicting Social Behavior, New Jersey: Prentice-Hall,
Englewood Cliffs; 1980.
Babin BJ, Darden W and Griffin M, (1994) Work and/or
Fun: Measuring Hedonic and Utilitarian Shopping
Value, Journal of Consumer Research, 644-656.
Barclay D, Thompson R and Higgins C, (1995) The
Partial Least Squares (PLS) Approach to Causal
Modeling: Personal Computer Adoption and Use an
Illustration. Technology Studies, 2(2): 285-309.
Bruner II GC and Kumar A, (2005) Explaining Consumer
Acceptance of Handled Internet devices, Journal of
Business Research, 58: 553-558.
Charlton JP and Danforth IDW, (2007) Distinguishing
addiction and high engagement in the context of online
UtilitarianValueandHedonicValueofMobileService-FocusingonMobileAddiction
625

game playing, Computers in Human Behavior, 23(3):
1531-1548.
Chin WW, The Partial Least Squares Approach to
Structural Equation Modeling. In: Marcoulides GA,
editor. Modern Methods for Business Research. NJ:
Lawrence Erlbaum, Mahway; 1998. 295-336.
Chin WW, Marcolin BL and Newsted PR, (2003) A
partial least squares latent variable modeling approach
for measuring interaction effects: Results from a
Monte Carlo simulation study and an electronic mail
adoption study. Information Systems Research, 14(2),
189–217.
Chiu HC, Hsieh YC, Li YC and Monle L, (2005)
Relationship Marketing and Consumer switching
behavior, Journal of Business Research, 58, 1681-
1689.
Cohen J., Statistical Power Analysis for the Behavioral
Sciences, Lawrence Erlbaum, Hillsdale, NJ, 1988.
Compeau D.R., Higgins C.A. and Huff S., (1999) Social
cognitive theory and individual reactions to computing
technology: a longitudinal study, MIS Quarterly, 23
(2), 145 – 158.
Davis FD, Bagozzi RP and Warshaw PR, (1992) Extrinsic
and intrinsic motivation to use computers in the
workplace, Journal of Applied Social Psychology,
22(14), 1111–1132.
Davis FD, (1989) Perceived usefulness, perceived ease of
use, and user acceptance of information technology,
MIS Quarterly, 13(3), 319–340.
Davis FD, Bagozzi RP and Warshaw PR, (1989) User
acceptance of computer technology: a comparison of
two theoretical models, Management Science, 35(8),
982-1003.
Davis RA, (2001) A cognitive-behavioral model of
pathological Internet use, Computers in Human
Behavior, 17, 187–195.
Deci E L, Intrinsic Motivation. New York: Plenum Press;
1975.
Fornell C and Bookstein FL, (1982) Two structural
equation models: LISREL and PLS applied to
consumer exit-voice theory, Journal of Marketing
Research, 19, 440–452.
Fornell C and Larcker, D F., (1981) Evaluating structural
equation models with unobservable variables and
measurement error, Journal of Marketing Research, 18
(1), 39 – 50.
Goodhue D, Lewis W and Thompson R, (2003) Statistical
power in analyzing interaction effects: Questioning the
advantage of PLS with product indicators, Information
Systems Research, 18 (2), 211 – 227.
Igbaria M, Parasuraman S and Baroudi JJ, (1996) A
motivational model of microcomputer usage, Journal
of Management Information Systems, 13(1), 127-143.
Igbaria M, Schiffman SJ and Wieckowshi TS, (1994) The
respective roles of perceived usefulness and perceived
fun in the acceptance of microcomputer technology,
Behavior and Information Technology, 13(6), 349-
361.
Lohmoller JB, (1989) The PLS program system: Latent
variables path analysis with partial least squares
estimation, Multivariate Behavioral Research, 23(1),
125–127.
Li SM and Chung TM, (2006) Internet function and
Internet addictive behavior, Computers in Human
Behavior Forthcoming,.
Mathieson K, Peacock F and Chin WW, (2001) Extending
the technology acceptance model: The influence of
perceived user resources, Data Base Advanced
Information Systems, 32(3), 86 – 112.
Mendelson J and Nancy M, The Addictive Personality.
New York: Chelsea House; 1986.
O'Guinn TC and Faber RJ, (1989) Compulsive Buying: A
Phenomenological Exploration, Journal of Consumer
Research, 16, 147-157.
Okada EMJ, (2005) Justification Effects on Consumer
Choice of Hedonic and Utilitarian Goods, Journal of
Marketing Research, 42, 43–53.
Peter JL and Churchill GA, (1986) Relationships among
research design choices and psychometric properties
of rating scales: A meta-analysis, Journal of Marketing
Research, 23, 1 -10.
Sandelands LE, Asford SJ and Dutton JE, (1983)
Reconceptualizing the overjustification effect: a
template-matching approach, Motivation and Emotion,
7(3), 229-255.
Terel, O., Serenko, A. and Giles, P., (2011) Integrating
Technology Addiction and Use: An Empirical
Investigation of Online Auction Users, MIS Quarterly,
35 (4), 1043 – 1061.
Triandis HC, Attitude and Attitude Change. New York:
Wiley; 1971.
Venkatesh V, (2000) Determinants of Perceived Ease of
Use: Integrating Control, Intrinsic Motivation, and
Emotion Into the Technology Acceptance Model,
Information Systems Research, 11(4), 342-365.
Voss KE, Spangenberg ER and Grohmann B, (2003)
Measuring the Hedonic and Utilitarian Dimensions of
Consumer Attitude, Journal of Marketing Research
2003, 40, 310–20.
WEBIST2015-11thInternationalConferenceonWebInformationSystemsandTechnologies
626
