
Electricity and Heat Sector Coupling for Domestic Energy Systems
Benefits of Integrated Energy System Modelling
Akhila Jambagi, Michael Kramer and Vicky Cheng
Energy Efficient and Smart Cities Research Group, Technical University of Munich
Boltzmannstrasse 17, 85748 Garching, Germany
Keywords: Energy System Modelling, Smart Cities, Energy Storage, Thermal Storage, Cogeneration, CHP, Heat Pumps,
Power-to-Heat.
Abstract: A strong focus on reducing carbon emissions as well as the improvements in computing and control
techniques for energy systems make it relevant to design energy systems in an integrated way. Coupling
various energy sectors can offer many benefits in the way of flexibility and better utilisation of resources and
infrastructures. To illustrate the benefits of coupling the heat and electricity sectors, a general model for a
domestic energy system is developed, and two simulations are performed of domestic systems with sector
coupling technologies. Further benefits can be gained by optimising the two systems together, implying that
it can be advantageous to take an integrated optimisation approach for larger numbers of domestic systems.
1 INTRODUCTION
It is becoming important to study energy systems in
an integrated way by coupling various energy sectors,
because two recent developments are making it more
relevant. The first trend is the importance of reducing
carbon emissions, which has resulted in increased
penetration of renewable energy generation. These
are often intermittent in nature, thereby demanding
more flexibility from the grid and demand side.
Coupling the electricity and heat sector can be useful,
as it has been shown that the intermittency can be
combated by using Power-to-Heat technologies such
as heat pumps (Vanhoudt et al., 2014).
Furthermore cogeneration has been shown to be a
very efficient and low carbon energy source,
providing another motivation for sector coupling
(Houwing et al., 2011). This has particular relevance
in the EU, since the Horizon 2020 calls have
specifically promoted the use of renewables and
cogeneration for residential buildings (Brenna et al.,
2012).
The second trend is the movements towards smart
energy systems, supported by improvements in
computing and control techniques. An integrated
control strategy for a multi-carrier energy system can
offer much more flexibility, and could improve the
utilisation of existing resources and infrastructure.
The aim of this study is to investigate the benefits
that can be gained by sector coupling combined with
optimisation techniques. This is shown through the
modelling of two houses with different coupling
technologies, and the further benefits gained by
controlling them together. The focus for this study is
the coupling of the heat and electricity sectors, and is
part of a wider project aiming to develop a multi-
energy carrier framework for the optimisation of
energy systems at a district level.
A literature review on some published multi-
energy carrier models is included in section 2. Section
3 describes the formulation of the model that has been
developed for the study, and the three specific case
studies, for which the results are discussed in section
4. Finally the conclusions and outlook are discussed
in section 5.
2 LITERATURE REVIEW
There are several models that have been constructed
with the purpose of analysing and optimising multi-
carrier energy systems, of which some relevant ones
will be discussed in this section. Firstly, the Energy
Hubs model (Geidl et al., 2007), which formulates an
Energy Hub as a unit where multiple energy carriers
are converted and/ or stored. This model has been
used for applications such as the conception of fuel
cell systems (Hemmes, 2007). The model formulation
66
Jambagi A., Kramer M. and Cheng V..
Electricity and Heat Sector Coupling for Domestic Energy Systems - Benefits of Integrated Energy System Modelling.
DOI: 10.5220/0005481100660071
In Proceedings of the 4th International Conference on Smart Cities and Green ICT Systems (SMARTGREENS-2015), pages 66-71
ISBN: 978-989-758-105-2
Copyright
c
2015 SCITEPRESS (Science and Technology Publications, Lda.)
in this study is based loosely on the Energy Hubs
formulation.
A different approach is the Large Scale Virtual
Power Plant (VPP) concept, as in (Giuntoli, 2013).
This approach takes the popular VPP concept and
distributes the various generation, storage and load
resources over a larger territories, where ownership of
the assets can be varied. The control and operation
however is managed by a centralised scheduling
coordinator that represents the common commercial
interface. This is the control strategy that is used for
the energy system framework developed in this
project.
3 METHODS
3.1 General Optimisation Set up
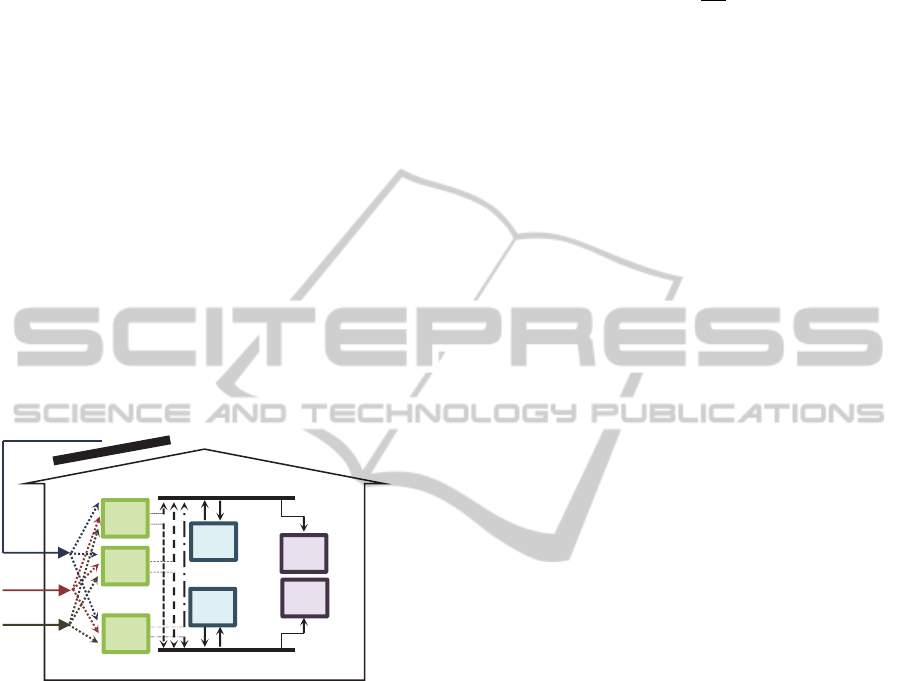
The model describes each house as a collection of any
number of the elements: Power Sources, Converters,
Energy Storage Units, and Loads (Figure 1).
Figure 1: General Architecture for one domestic energy
system, may contain any of the generation, conversion,
storage or load elements.
Optimisation is performed on a 15 minute basis for 24
hours, and it is assumed that within the 15 minute
intervals the power flows remain constant. The Loads
and PV inputs are fixed time series, and therefore the
controllable elements are the grid electricity and gas
inputs, as well as the power flow in and out of the
storage elements.
3.1.1 Model Dynamics
To ensure that the demand is met (1) is enforced,
where
describes the dynamics of the
converters of the specific house. Note that refers
to the duration of a time step (i.e. 15 minutes), and
is the change in State of Charge of the storage unit
during that time step. For simplicity and linearity the
storage elements are considered ideal, and no cycle
efficiency is included.
1
Δ
Δ
(1)
Furthermore various constraints will need to be met
on the power inputs (2), storage energy levels (3) and
the charging levels (4). Note that (1)- (4) have to be
maintained for all time steps of the optimisation
duration.
,
,
∈
,
(2)
,
,
(3)
Δ
,
Δ
Δ
,
∈
,
(4)
Finally a constraint is placed on the charge levels of
the storage elements, that they should be the same at
the beginning and end of the day (5).
(5)
3.1.2 Optimisation Problem
The developed modelling framework can be used to
evaluate any objective function, however for this
study a cost optimisation is performed. Other possible
objectives could be minimising CO
2
emissions, or
peak shaving. A linear programme is formulated
where the objective function is as in (6), where
.and
refer to the grid electricity and gas prices
respectively.
(6)
A price ratio of 1:3 for gas to electricity is assumed in
this study. It is possible to incorporate variable
pricing schemes, however this is currently not
particularly realistic for domestic consumption and
was therefore left out. The optimisation problem
therefore is to minimise (6), subject to (5) and (1)-(4)
for every time step.
3.2 System Setup House 1
Single family house 1 is considered a refurbished old
building with a three person household living on 150
m². A specific annual heat demand of 70 kWh/m² is
assumed. The heat load is covered by a bivalent
heating system consisting of a CHP and a furnace to
cover the peak load. For simplicity of the problem
P
grid
P
gas
P
P
V
C
1
C
2
C
n
…
Converters
E
el
E
h
L
el
L
h
Electrical
Heat
Loads
Storage
ElectricityandHeatSectorCouplingforDomesticEnergySystems-BenefitsofIntegratedEnergySystemModelling
67
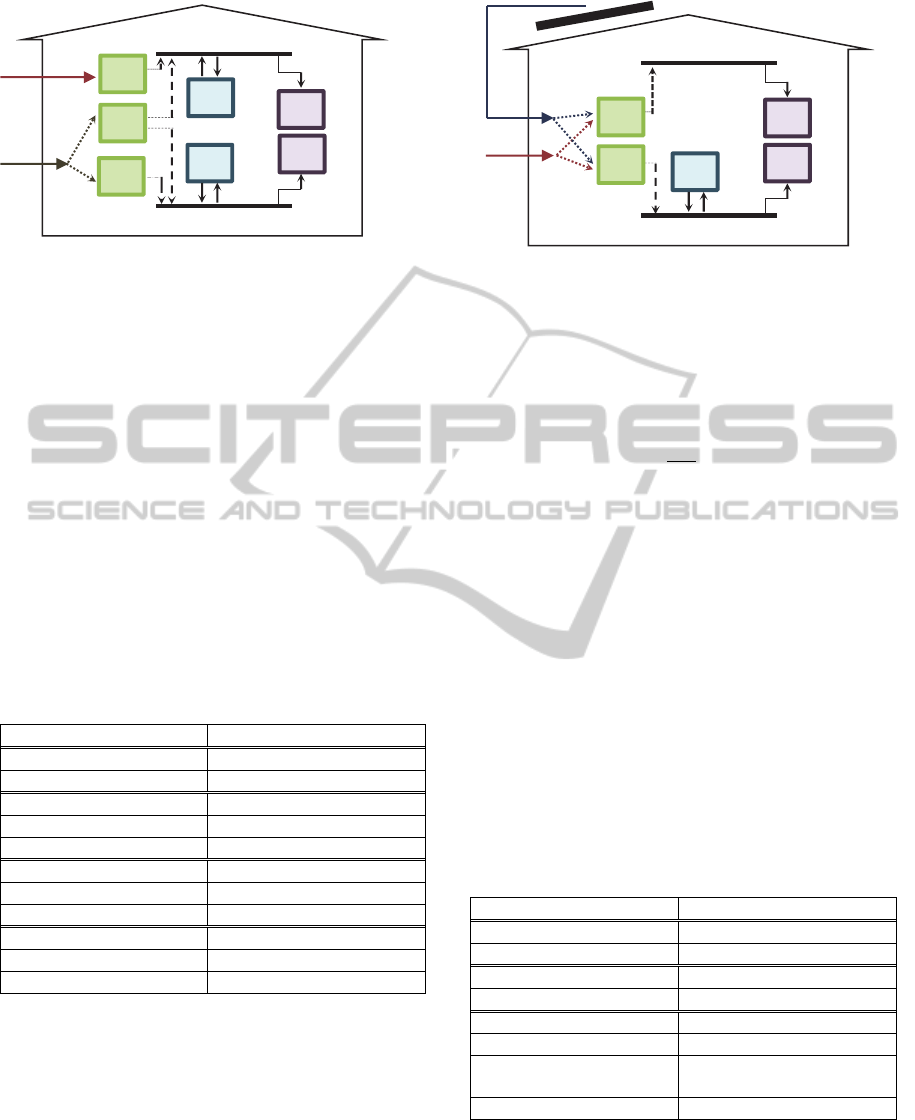
Figure 2: House 1 components - Grid Connection, CHP,
Furnace, and thermal and electrical storage.
formulation the CHP is assumed to be perfectly
modulating. The thermal and electrical efficiencies of
the CHP are assumed to be constant for each
operating point. A buffer functions as thermal storage
and is connected to the heating system as in Figure 2.
The electrical demand of household appliances is
covered either by electricity from the grid or the CHP.
A battery serves as electrical storage and offers the
possibility to decouple the generation and demand of
electricity.
Both thermal and electrical storages are assumed
to have no standby losses and no charging or
discharging losses. This simplification is to keep the
system dynamics linear. The properties of the devices
in House 1 are summarized in Table 1.
Table 1: Parameters for the devices in house 1.
Device Range/Value
P
Grid
0…30 kW
η
grid
1
P
CHP
0…12 kW
η
CHP,thermal
0.65
η
CHP,electrical
0.25
E
Battery
1…5 kWh
P
Battery,charge
0…0.8 kW
P
Battery,discharge
-0.5…0 kW
E
Buffer1
2…10 kWh
P
Buffer1,charge
0…6 kW
P
Buffer1,discharge
-6…0 kW
3.3 System Setup House 2
Single family house 2 is assumed to be a new build
with a better energy standard leading to an annual
heat demand of 50 kWh/m². Household size and
living area are the same as in house 1. The heat
demand is covered by a monovalent heat pump
system connected to a buffer as shown in Figure 3.
Heat pumps produce heat from low temperature
sources as water, air or ground. The delivered
Figure 3: House 2 components - Grid connection, PV, Heat
Pump, and Thermal Storage.
heat flow
is higher than the supplied power
to
the compressor, since the heat pump uses the
surrounding low temperature energy source. The
coefficient of performance (COP) is defined by (7).
(7)
The efficiency of a heat pump depends on the
difference between the source and the output
temperature (Quaschning, 2013). For simplicity a
constant COP of 3 is assumed. Heat pumps are either
available as on- and off-switching or modulating
devices. Same as for the CHP in house 1, the heat
pump is assumed to be perfectly modulating.
The buffer acts as thermal storage for the heating
system in house 2.
A solar power installation of 5 kW on the roof top
of the new build can cover the electrical demand of
appliances and the heat pump. In this scenario, feed-
in of excess electricity generation to the grid is not
considered. The sizing of the devices in house 2 is
summarized in Table 2.
Table 2: Parameters for the devices in house 2.
Device Range/Value
P
Grid
0…30 kW
η
grid
1
P
HP,electrical
0…2 kW
COP 3
E
Buffer2
2…10 kWh
P
Buffer2,charge
0…6
-6…0
P
PV,installed
5 kW
3.4 System Setup Combined Houses
The combined system of the two houses is defined by
electrical interconnections between the CHP and
battery in house 1 and the heat pump and PV in house
P
grid
P
gas
GC
CHP
Fur
E
el
E
h
L
el
L
h
Electrical
Heat
P
grid
P
PV
E
h
L
el
L
h
Electrical
Heat
GC
HP
SMARTGREENS2015-4thInternationalConferenceonSmartCitiesandGreenICTSystems
68
2. Thus the demand of appliances and the heat pump
in house 2 can by supplied by the CHP and the battery
in house 1. In addition, PV generation can supply the
appliance demand of house 1 and feed the battery.
There is no connection between thermal storages or
the thermal output of the CHP or the heat pump.
3.5 Load Profiles
Demand profiles for electricity and heat are generated
based on the reference load profiles for Germany of
the VDI 4655. The guideline can be used to generate
load profiles for single- and multi-family houses to
support the optimal sizing of small scale cogeneration
plants. The heat demand is calculated based on the
buildings specific annual heat demand and its location
in one of fifteen climatic regions of Germany.
Furthermore, different demand profiles are available
for combinations of the season of year, weekdays or
Sundays and fine or cloudy weather conditions (VDI
4655, 2008).
Heat demand and PV generation coincide the
most during the seasonal transition period (Brunner
et al. 2014). To highlight the potential of sector
coupling, the optimisation of the systems is calculated
for a transition period weekday with a clear sky.
The electricity demand profiles are scaled by the
number of household members. An annual
consumption of 1750 kWh per person is assumed.
The demand of domestic hot water is disregarded for
simplicity.
The PV generation profile is based on
measurements in April from a location in the south of
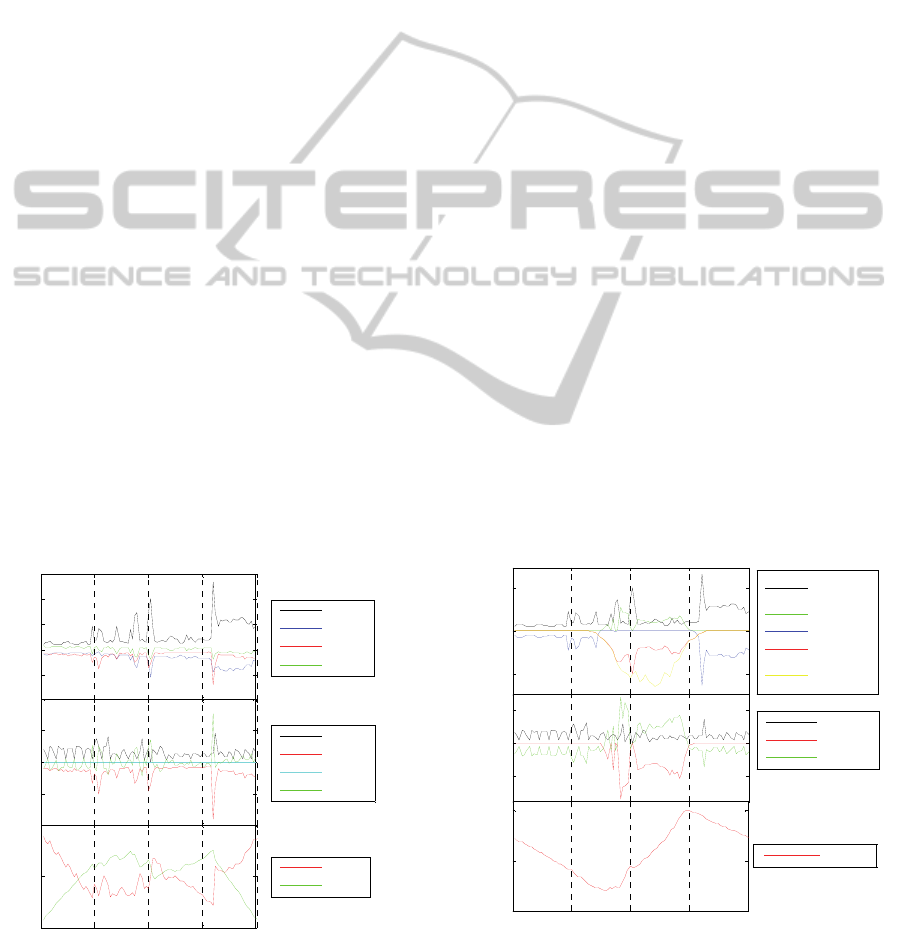
Figure 4: House 1 - Electricity, Heat and Storage time-
series throughout the day.
Germany and scaled by the installed power.
All profiles within the optimisation have a temporal
resolution of fifteen minutes.
4 OPTIMISATION RESULTS AND
DISCUSSION
4.1 House 1
Figure 4 shows the simulation results of demand and
supply for electricity and heating, and the state of
charge in the buffer and the battery.
House 1 can supply its heat demand from the
CHP, the furnace and the buffer. Since the furnace
only operates during peak load, on a transition period
day the heat demand is covered by the CHP and the
buffer i.e. the furnace is not operated at all.
The operation of the CHP and the buffer are
determined by the heat demand. Electricity generated
by the CHP is either used for the demand of
appliances or to charge the battery.
Synergy effects are seen, as charging and
discharging occur at opposite times for the battery
and the buffer. The battery is charged during the early
morning hours and kept constant throughout the day
between 07:00 a.m. and 07:45 p.m. to later supply the
relatively high electricity load during the late
evening. Furthermore the CHP operates more during
the evening hours, after 18:00, when electricity load
is high, and since the heat demand does not match the
buffer is charged instead. The storage devices
Figure 5: House 2 - Electricity, Heat and Storage time-
series throughout the day.
-1
0
1
2
3
Electricity
(kW)
House 1 Simulation Results
Demand
Grid
CHP
Battery
-2
0
2
Heating
(kW)
Demand
CHP
Furnace
Buf f er
00:00 06:00 12:00 18:00 24:00
0,5
0,6
Time
Storage SoC
(kWh)
Buf f er
Battery
-2
0
2
Elec tricity
(kW)
House 2 Simulation Results
Demand
Appliances
Demand HP
Grid
PV us ed
PV
generation
-2
0
2
Heating
(kW)
Demand
HP
Storage
00:00 06:00 12:00 18:00 24:00
0
0.5
1
Time
Storage
(kWh)
Buf f er
ElectricityandHeatSectorCouplingforDomesticEnergySystems-BenefitsofIntegratedEnergySystemModelling
69
discharge in most of the cases when peak demands for
electricity and heat occur.
4.2 House 2
Figure 5 shows the simulation results for demand and
supply for electricity and heat and the state of charge
in the buffer for house 2.
The total electricity demand of house 2 is made up
of the appliances and the HP demand. At times of no
PV generation, all the electrical load has to be
supplied by the grid. As the PV starts to generate
electricity, it is preferred to buying electricity from
the grid.
The example shows the potential of coupling the
electricity and heating sectors with a heat pump.
Between 09:15 a.m. and 18:00 p.m. the PV generation
is mainly utilized to supply the heat pump and to
charge the buffer. The heat demand occurring during
the evening and morning hours is mainly covered by
the buffer to avoid operating the heat pump with
expensive electricity from the grid.
Even though the electricity demand in house 2 is
mainly supplied by the solar power system during the
day, still there is excess PV generation which cannot
be utilized. Realistically this electricity would be sold
back to the grid with a certain feed-in tariff, which
would strongly vary by region. Note that to be able to
compare various scenario’s we have not considered
this as part of the cost optimisation. As a consequence
of the assumed setting, the excess generation has to
be curtailed. This demonstrates the motivation of
supplying the demand or battery in house 2 by
interconnecting the two houses as described in
Section 4.3.
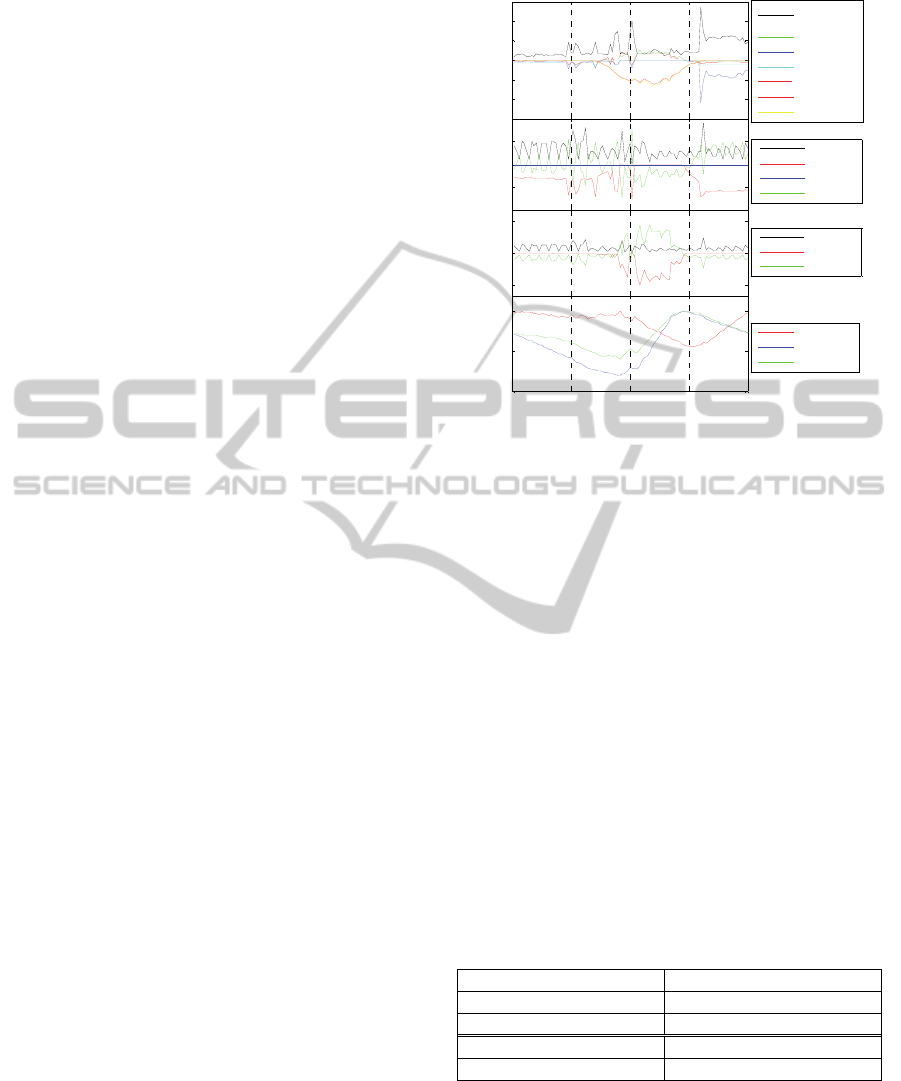
4.3 Combined Houses
The results for the optimisation of the combined
houses are shown in Figure 6.
There is now the possibility to use PV generation
from house 2 in both houses replacing electricity from
the grid whenever the solar power system feeds in.
The amount of unused PV generation for the day is
decreased from 42.6% to 4.1% in the combined
system, illustrating a much better integration of the
renewable energy source.
The battery is charged when PV generation is
high, to later reduce the necessary supply of
electricity from the grid by discharging from the
evening to the early morning hours. Total energy
discharged from the battery increases by almost factor
3 when the houses are combined, leading to a better
utilization of the utilization of the storage device.
Figure 6: Combined System Electricity, Heat and Storage
time-series throughout the day.
The only source of heating energy for House 1 is the
CHP and the buffer which is also heated by the CHP.
Therefore the total CHP production is restricted to the
total heating demand of house 1. The CHP is not able
to increase its overall production beyond that of the
scenario in section 4.1, in order to supply more low
cost electricity. The optimisation utilises the buffer
for some time-shifting. As can be seen in the heating
plot of house 1 in Figure 6, operation of the CHP is
shut down between 12:15 p.m. and 17:15 p.m. during
times of high PV generation. Buffer 1 is discharged
simultaneously, leading to an increase of 46% in total
daily discharged energy in comparison to the
separated case. The operation of Buffer 2 has not
changed from the scenario in 4.2, since it is still
optimal to charge it during times of high PV
generation.
Table 3: Objective function values of the compared
systems.
System Objective Function Value
House 1 194.11
House 2 108.26
House 1+House 2 302.37
Combined Optimisation 229.07 (-24.24%)
PV integration has an effect on the value of the
objective function of the optimisation problem stated
in section 3.1. Table 3 shows the objective function
values for the separated houses and the combined
houses. By interconnecting the houses the overall
variable costs of the sum of the separate houses can
-4
-2
0
2
4
Electricity
(kW)
Combined System Simulation Results
Demand 1+2
Appliances
Demand HP
Grid
CHP
Battery
PV us ed
PV generation
-1
0
1
Heating
House 1 (kW)
Demand
CHP
Furnac e
Buffer 1
-3
0
3
Heating
House 2 (kW)
Demand
HP
Buf fer 2
00:00 06:00 12:00 18:00 24:00
0
0.5
1
Time
Storage
(kWh)
SoC Buf fer 1
SoC Buf fer 2
SoC Battery
SMARTGREENS2015-4thInternationalConferenceonSmartCitiesandGreenICTSystems
70

be reduced by 24.24%. Cost are either caused by
buying electricity from the grid or by burning gas for
the CHP. With PV integrated in house 1, less
electricity has to be purchased from the grid. Since
the CHP generates the same amount of heat during
the day in the separated and the combined cases, the
effect of cost reduction is only caused by the
enhanced integration of PV.
5 CONCLUSIONS AND
OUTLOOK
The results of the three simulations have illustrated a
number of benefits of coupling the heat and electricity
systems of domestic buildings. House 1 results show
the benefits of having both electrical and thermal
storage to support a CHP plant by maximising its
utilisation. House 2 showed the advantage of using a
heat pump to better utilise the PV output. Finally the
combined system shows the further benefits of the
synergy by illustrating that greater benefits can be
gained by optimising on a larger scale. The utilisation
of PV increased, greatly reducing the cost of energy
for both households.
Many simplifications have been made in this
study, for example regarding the efficiency and linear
operation of the energy storage characteristics, and
constant efficiency characteristics for the CHP and
heat pump. A better quantification of the advantages
can be gained by more detailed modelling of the
various components. This will result in non-linear
system dynamics, and therefore more sophisticated
optimisation techniques will be required.
Furthermore the results of this study suggest that
it is worth optimising several domestic buildings or
households together. This will also allow other
technologies to be investigated such as CHP plants
for entire building blocks.
These two components, more detailed modelling,
and a wider scope of households, will guide the
further work. As mentioned the wider project is to
develop a framework for optimising energy systems
at a city district or building block level. Another
important factor that this study has not considered is
the costing of various systems. Correct costing can
allow the modelling framework developed in this
paper to be extended and used for calculations such
as optimal sizing of energy storage units and PV
installations.
Besides sizing, a modelling framework will also
allow for the evaluation of more sophisticated control
techniques within a smart grid framework.
Particularly the use of online control, where system
measurements are used to re-optimise the operation at
every time step has shown to bring cost benefits.
REFERENCES
Brenna, M., Falvo, M.C., Foiadelli, F., Martirano, L.,
Massaro, F., Poli, D., Vaccaro, A., 2012. Challenges in
Energy Systems for the Smart Cities of the Future. In
Energy Conference and Exhibition (ENERGYCON),
Florence, p. 755-762.
Brunner, M., Schäfer, I., Rudion, K., Tenbohlen, S., 2014.
Impacts of different seasons on the contribution of heat
pumps to voltage stability. In VDE-Congress 2014
Smart Cities Proceedings, Frankfurt am Main, no. 46.
Geidl, M., Koeppel, G. Favre-Perrod, P., Klockl, B.,
Andersson, G., Frohlich, K ., 2007. Energy hubs for the
future. In IEEE Power and Energy Magazine, vol. 5,
no. 1, pp. 24–30.
Giuntoli, M., Poli, D., 2013. Optimized Thermal and
Electrical Scheduling of a Large Scale Virtual Power
Plant in the Presence of Energy Storages. IEEE
Transactions on Smart Grid. vol. 4, no. 2, p. 942-955.
Hemmes, K., Zachariah-Wolf, J.L., Geidl, M., Andersson,
G., 2007. Towards multi-source multi-product energy
systems, International Journal of Hydrogen Energy,
Vol 32, Issues 10–11, p. 1332-1338.
Houwing, M., Negenborn, R.R., De Schutter, B., 2011.
Demand Response With Micro-CHP Systems.
Proceedings of the IEEE, 99(1), 200-213.
Quaschning, V., 2013. Regenerative Energiesysteme,
Hanser Verlag. München, 8
th
edition.
Vanhoudt, D., Geysen, D., Claessens, B., Leemans, F.,
Jespers, L., Van Bael, J., 2014. An actively controlled
residential heat pump: Potential on peak shaving and
maximization of self-consumption of renewable
energy, Renewable Energy, vol. 63, p. 531-543.
VDI 4655, 2008. Reference load profiles of single-family
and multi-family houses for the use of CHP systems.
Beuth Verlag, Berlin.
ElectricityandHeatSectorCouplingforDomesticEnergySystems-BenefitsofIntegratedEnergySystemModelling
71
