
Definition of Key Performance Indicators for Energy Efficient
Assessment in the Transport Sector
R. M. Fernanda Mantilla, L. Angelica Nieto and Jose L. Martinez Lastra
FAST-LAB, Tampere University of Technology (TUT), Tampere City, Finland
Keywords: Transport, Key Performance Indicators, Energy, Parameters.
Abstract: The transport sector is constantly growing as well as its complexity and energy consumption. One way to
reduce the involvement and the volume of data to evaluate and monitor the energy efficiency of the sector
for cities authorities is by using Key Performance Indicators (KPIs). This paper describes a set of KPIs to
measure and track energy efficiency in the transport sector. The KPIs that are summarized in this paper
were identified based on a literature review of mobility projects/strategies/policies that had been
implemented in cities around the world. Future applications, which are presented at the end of this article,
will give a better understanding of the systems and its components.
1 INTRODUCTION
City authorities, all around the world, are currently
facing the increasing cost and demand of energy in
which transport sector represent at least a 33% of the
total consumption. At the same time, this sector is
far away to be efficient. High use of private vehicles,
as well as, low levels of Public Transport (PT) and
ALternative Modes (ALM) use and several other
factors had raised the energy requirements.
As a result, governments have been
implementing policies on better use of energy
through improvements in technologies (e.g. bio
fuels, cleaner vehicles etc.) and changes in
inhabitants Transport Choices (TC). In the
meantime, these improvements are generating a
wide range of benefits to the whole mobility system,
as reduction of pollution, general cost
improved health conditions, environmental
sustainability and others (Marcucci et al., 2012)
The evaluation and monitoring of Energy
Consumption (EC) is limited due to the complexity
of the transportation sector. Other sectors with high
complexity, like the industrial or communication
domain have commonly implemented Key
Performance Indicators (KPIs) to simplify the
complexity and the amount of necessary data for
monitoring and evaluation processes. Several
Energy Efficiency (EE) indicators, have been
published in literature from different sectors and
types of studies as the presented in (Zhang et al.,
2012), which focuses on the factory production. In
the transportation sector, KPIs definition and
standardization has not been performed mainly
because the approach of the monitoring and
evaluations processes are still performed in
traditional ways based on authorities previous
experiences and empirical knowledge. As a
consequence, studies from some sectors like the
ones presented in (Bosseboeuf and Richard, 1997;
Marcucci et al., 2012; Litman, 2013, international
Energy agency, 2012, etc.) are not comparable.
Actions from International Energy Agency
(IEA), the organization for economic Co-operation
and development (OECD), and World Energy
Council (WEC) have overcome with common
practices and methods for measuring EE, however
today there is not a universally accepted EE
definition, neither a common way to measure it.
This paper presents a literature review on these
policies and proposes a set of KPIs for performing
energy assessments. This set aim to provide metrics
that will be used to determinate the success of
policies’ actions on the sector as well as the timely
information that authorities need to track for
evaluating the performance of the sector in order to
make changes and achieve sustainable transport
systems. This document is organized as follows:
Section 2 describes the KPIs for transportation
sector and the summary of the identified KPIs is
presented in Section 3. Section 4 gives an overview
of KPIs possible applications. Section 5 describes
how complex system can be evaluated and
monitored by measuring KPIs. Finally, section 6
gives conclusions and future work.
78
M. Fernanda Mantilla R., Angelica Nieto L. and L. Martinez Lastra J..
Definition of Key Performance Indicators for Energy Efficient Assessment in the Transport Sector.
DOI: 10.5220/0005489600780082
In Proceedings of the 4th International Conference on Smart Cities and Green ICT Systems (SMARTGREENS-2015), pages 78-82
ISBN: 978-989-758-105-2
Copyright
c
2015 SCITEPRESS (Science and Technology Publications, Lda.)

2 REVIEW OF KEY
PERFORMANCE INDICATORS
IN THE TRANSPORTATION
SECTOR
Due to the constant increase in EC by the transport
sector, countries had been implementing measures to
reduce its consumption. The measures can be
categorized in technological or cleaner vehicles
strategies and Optimization or mobility management
strategies. The first one tries to promote new
technologies that use less energy/more efficient,
which includes establishment of limits over transport
companies. Equally important, the Optimization or
mobility management strategies optimize the way of
energy use. This means that they change the
mobility patterns by promoting public transport,
connectivity between modes, a higher vehicle’s
occupancy and the use of alternative modes. A
research conducted by Victoria transport Policy
Institute from Canada found that mobility
management strategies generally achieve more
planning objectives than cleaner vehicle strategies,
particularly if cleaner vehicle strategies have
rebound effects (Bosseboeuf and Richard, 1997;
Litman, 2013; Litman, 2007; Usón et al., 2011).
Rebound effects, also called take back effects, refer
to the increase in car use that result from increased
fuel efficiency, cheaper fuels or roadway expansion
that increases traffic speeds.
Although there is not a standard for measuring
EE, several studies agreed that the main inefficiency
comes from irrational use of private vehicles inside
and outside the cities and the lack of alternative
sources of energy (biofuels, electricity, etc.). In
contrast, an study performed by Usón et al., 2011
found, that bus, regional train and on foot transport
modes are more EE and considers several indicators,
such as fuel consumption, infrastructure, time
travelled and environmental cost (defined in term of
cost for nature replacement).
Under those circumstances, the use of private
vehicles should be tracked (measure) and one of the
ways to do it is by looking the availability of them.
Indicators such as the number of vehicles per 1000
inhabitants, reflect not only the availability but also
the potential to implement politics to reduce the use
of cars. Eurostat, the statistical office of the
European Union, calculates that if users of vehicles,
which have not being manufactured could cover
their needs by using PT, the efficiency would
improve by 80%, because the number of vehicles per
1000 inhabitants will drastically decrease from 411
to 250 vehicles (Usón et al., 2011; International
Energy Agency, 2014).
Indirect measurements such as the average
income can reflect the number of vehicles per 1000
inhabitants. Statistics from ADEME (2012) show
that countries with low average income, such as
Romania and countries mostly from Central and
Easter Europe, own less than 500 cars per 1000
inhabitants, with use below 5000 km/year. In
contrast, countries like Finland, Slovenia, France,
UK, Sweden, Germany and Norway, consider as
higher income countries, have a higher average or
equal to 700 cars per 1000 inhabitants with a use
between 12000 and 16000 km/year (Lipscy and
Schipper, 2013).
Furthermore, it is required to know the
composition of the vehicles fleet, such as the age
distribution, type of engines, average travelled
distance, etc., to calculate their contribution to the
final EC. As an illustration, Sweden has the higher
consumption per vehicle compare with Italy, which
is caused by powerful cars and lower share of diesel
engines. On the contrary, Italy has least powerful
cars with a high percentage of diesel engines.
Consequently, the average car size, horsepower and
the percentage share of diesel are important factors
on the EE calculation (International Energy Agency,
2014; Kaparias and Bell, 2011).
Energy Consumption (EC) not only happens
during the travelled time, in fact, there is an energy
cost on manufacture, maintenance, recycling and the
city infrastructure (roads and parking places etc.)
(Usón et al., 2011; Ministry of ecology and
sustainable Development and energy, 2014). Thus,
the EC/carbon footprint (CFP) of vehicles should be
calculated having into account its life cycle as well
as its performance on the road.
As it was mentioned before, energy saving can
be achieved by increasing the efficiency on the
technical performance of the vehicle (technological
or cleaner vehicles strategies). Similarly, decreasing
the car size and/or horsepower, increasing the
average vehicle occupancy, or transforming driving
behaviour can also lead to savings in different
proportions. However, vehicles that are more
efficient, are connected with regressions in driving
behaviour, by a growth in the number of vehicles
and the travelled kilometres; therefore, overall
consumption tends to rise (Bosseboeuf and Richard,
1997). To demonstrate this issue, Japan has one of
the most efficient transport systems, besides, it has a
high amount of mini-cars with average occupancy of
one, and the average fuel use per passenger-km is
similar to US, Japanese cars uses about 15% less
DefinitionofKeyPerformanceIndicatorsforEnergyEfficientAssessmentintheTransportSector
79
fuel/km than US cars. In addition, Japanese cars are
considerably smaller and less powerful. Therefore,
the main reason why those levels are similar is
congestion (Lipscy and Schipper, 2013).
At the present time, other factors like the
increasing population along with the expanding
urbanization rate, the growing health and
environmental concern and rising fuel prices point to
reduce the private vehicle use, which results in the
increase of demand for other transport modes
(Litman, 2013; Frank et al., 2010). In average, cars
require four times more energy to transport one
passenger per km than PT (rail transport and buses),
and five times more energy than rail transport alone
(trains, metros and tramways) (International Energy
agency, 2012). Additionally transport’s specific
consumption for a lorry is around 15 times higher
than using a railway(Usón et al., 2011).
Examples from Italy and France illustrate how
behaviour changes achieve energy savings by
implementing rewards on PT and/or ALM use
(Litman, 2005; Metz, 2013). Although car travel will
not disappear completely, many would prefer to
drive less and rely more on alternatives modes like
walking or cycling if they perceive that there are
enough facilities to make that mode change (Litman,
2013).
Other actions in Belgium and Germany had been
bringing multiple economic and environmental
benefits. In Belgium employees receive 21 cents/km
compensation and in Germany prizes awarded in a
lottery to the employees that satisfy a certain quota
of miles biked to work per year. Not to mention
well known actions for stimulating modal shift such
as: building an attractive environment for pedestrian
traffic, introducing traffic calming measures for
motor vehicles, improving the quality of cycling
routes and adding the missing route links, as well as,
ensuring its proper maintenance (Ministry of
ecology and sustainable Development and energy,
2014; National Action Plan for Walking and Cycling
2020, 2012).
3 IDENTIFIED AND PROPOSED
KPIS FOR THE
TRANSPORTATION DOMAIN
The present section defines a common evaluation
framework for the energy/emissions performance of
smart cities in the form of a set of KPIs, which can
be use in one or more transport modes. They might
be an efficient baseline to compare multiple mobility
projects on their individual impact in the cities’
transport system.
The KPIs that are summarized in this section can
play a key role in the construction of Intelligent
Transport Systems (ITS) towards the improvement
of energy consumption/ carbon emissions of cities.
Table 1 presents the KPIs that where identified from
the aims of the mobility policies/projects (that affect
the EC) that were briefly described in the previous
section.
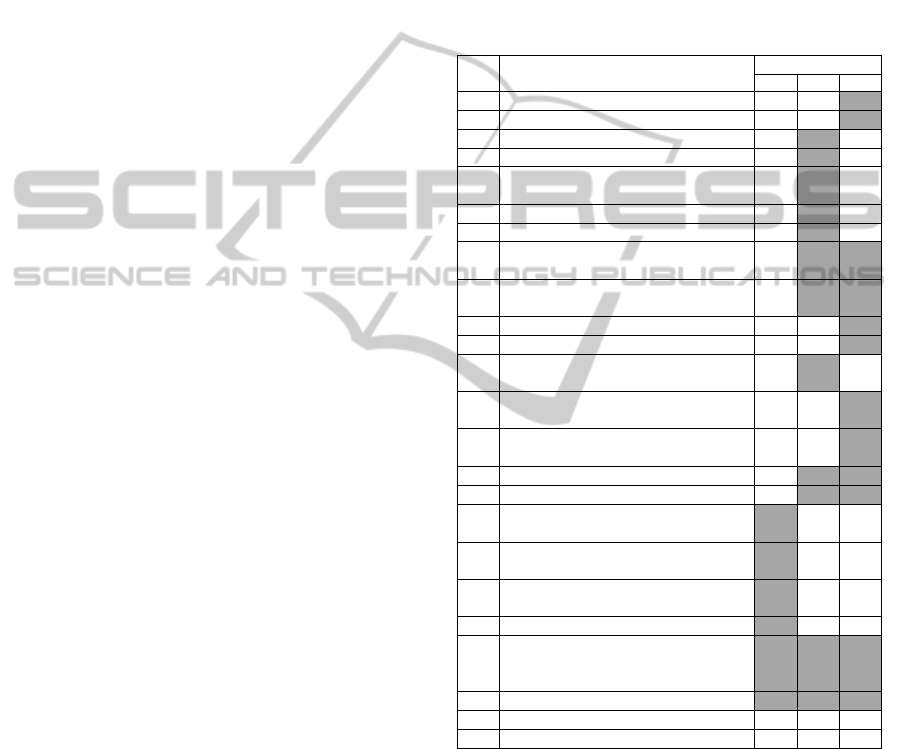
Table 1: Identified KPIS in the transport sector by mode.
ID Name
Mode
ALM PT PV
KP1 Performance of freight transport
KP2 Fuel consume by freight transport
KP3 Unitary gross annual energy savings
KP4 Density of passenger transport
KP5 Number of passenger transported by
fuel unit
KP6 Number of fuel units per passenger
KP7 Offer volume in public transport
KP8 Total CO
2
emissions for travel
(multiple modes) passengers
KP9 Total CO
2
emissions for travel
(multiple modes) freight
KP10 Private vehicles density rate
KP11 Average vehicle power
KP12 Share of diesel engine in total
vehicles
KP13 Share of public transport in total
passenger traffic
KP14 Share of heavy trucks in total freight
traffic
KP15 Share of new units in vehicles fleet
KP16 Presence of alternative fuels vehicles
KP17 Presence of alternative fuels vehicles
offering
KP18 Traffic-free (TF) and on-road (OR)
routes
KP19 Annual usage estimation in
alternative modes
KP20 Facilities density in alternative modes
KP21 Density of links in multimodal
[multimodal=more than one transport
mode]
KP22 Link’s Length in multimodal
KP23 KPI’s change per time unit
KP24 KPI’s percentage of change
4 KPIS FOR EVALUATION AND
MONITORING OF COMPLEX
SYSTEMS
It is well know that manufacturing systems share
with cities transport sector the great complexity of
their systems as they are composed mainly by
several information sources and a great flow of data.
However, in contrast with the transport systems of
SMARTGREENS2015-4thInternationalConferenceonSmartCitiesandGreenICTSystems
80

cities, industry uses KPIs for the monitoring and
evaluation processes. Several applications and
studies have described the process of implementing
those KPIs. In (Florea et al., 2012), presents how the
performance evaluation of several components in
the manufacturing flow can be simplified by
applying a division compose by layers, where KPIs
are used for monitoring and evaluating all their
aspects.
Others applications go further with same idea of
dividing the system in layer, but with other filters,
for example, who can access the information, in
other words, which information is relevant for whom
(Hossain, 2014).
5 POTENTIAL APPLICATIONS
Global studies have shown that the mobility model
that we have today, will not work tomorrow
(“CivitasInitiative | Clean and Better Transport in
Cities,” n.d.; OECD, 2009; Arriaga et al., 2007). The
increasing population and the growing number of
cars in cities compromise all the citizens’ life
aspects (health, destination, time, etc.). Multiples
solutions had been proposed from authorities across
the world, and all have in common “smart”. Cities
need to integrate systems that use real time data that
can optimize personal mobility and as a
consequence, optimize the EC of the whole system.
The integrated systems can also serve as a platform
for monitoring and evaluation for city authorities, in
this case, a simplification of data (set of KPIs)
proposed in this paper can effectively be applied. A
methodology described in (Mantilla R. et al., n.d.)
presents an option for monitoring and evaluating
energy efficient mobility projects in smart cities with
the use of the KPIs explained in this document.
6 CONCLUSIONS
Energy in the transport sector has become a general
issue. In order to decrease its consumption, energy
management should be applied. In this paper KPIs
were proposed, towards an overview of all the
aspects in cities transport energy. In addition,
potential use of these KPIs can be done in
applications that nudge people to make EE transport
choices as well as provide awareness about their
choices consequences inside the system.
Finally, future work will be in the application
side by applying these KPIs in smart cities around
Europe that have substantial differences in their
transport systems, so it will be possible to measure
the impact of the different identified factors.
ACKNOWLEDGEMENTS
This work has partially received funding from
European Union’s Seventh Framework Programme
for research, technological development and
demonstration under grant agreement number
608885, correspondent to the project shortly entitled
MoveUs (ICT Cloud-Based Platform And Mobility
Services Available, Universal And Safe For All
Users).
REFERENCES
Arriaga, J.I.P., Casals, X.G., Mendiluce, M., Miras, P.,
Jesús Sánchez, 2007. La gestión de la demanda de
energía en los sectores de la edificación y del
transporte. Fund. Altern.
Bosseboeuf, D., Richard, C., 1997. The need to link
energy efficiency indicators to related policies: A
practical experience based on 20 years of facts and
trends in France (1973–1993). Energy Policy, Cross-
country comparisons of indicators of energy use,
energy efficiency and CO2 emissions 25, 813–823.
doi:10.1016/S0301-4215(97)00071-2.
CivitasInitiative | Clean and Better Transport in Cities
[WWW Document], n.d. URL http://www.civitas.eu/
(accessed 8.25.14).
Florea, A., Postelnicu, C., Zhang, B., Lastra, J.L.M., 2012.
Ecosystem oriented energy management: An
implementation, in: 2012 IEEE International
Conference on Systems, Man, and Cybernetics (SMC).
Presented at the 2012 IEEE International Conference
on Systems, Man, and Cybernetics (SMC), pp. 912–
918. doi:10.1109/ICSMC.2012.6377844.
Frank, L.D., Greenwald, M.J., Winkelman, S., Chapman,
J., Kavage, S., 2010. Carbonless footprints: Promoting
health and climate stabilization through active
transportation. Prev. Med. 50, Supplement, S99–S105.
doi:10.1016/j.ypmed.2009.09.025.
Hossain, M.M., 2014. Portlet-based presentation of energy
KPIs in SOA-enabled manufacturing facilities
targeting holistic energy management.
International Energy Agency, 2014. Transport Energy
Efficiency Implementation of IEA Recommendations
since 2009 and next steps.
International Energy agency, 2012. Transport energy
efficiency trends.
Kaparias, L., Bell, M.G.., 2011. key performance indicator
for traffic management and Intelligent transport
systems (7th Framework Programme No. Deliverable
3,5). Imperial College London, London.
DefinitionofKeyPerformanceIndicatorsforEnergyEfficientAssessmentintheTransportSector
81

Lipscy, P.Y., Schipper, L., 2013. Energy efficiency in the
Japanese transport sector. Energy Policy 56, 248–258.
doi:10.1016/j.enpol.2012.12.045.
Litman, T., 2013. Comprehensive evaluation of energy
conservation and emission reduction policies. Transp.
Res. Part Policy Pract. 47, 153–166.
doi:10.1016/j.tra.2012.10.022.
Litman, T., 2007. Smart transportation emission reduction
strategies.
Litman, T., 2005. The future isn’t what it used to be. Vic.
Transp. Policy Inst. Www Vtpi Org.
Mantilla R., M.F., Nieto L., A., Martinez Lastra, J.L.,
Kotakorpi, E., n.d. Methodology for energy efficiency
assessment in the transport sector for smart cities.
Unpublished.
Marcucci, E., Valeri, E., Stathopoulos, A., 2012. Energy
efficiency in transport sector: policy evolution in some
European countries.
Metz, D., 2013. Mobility, access, and choice: a new
source of evidence. J. Transp. Land Use 6, 1.
doi:10.5198/jtlu.v6i2.309.
Ministry of ecology, sustainable Development and energy,
2014. Promoting Sustainable Mobility Cycling.
sustainable Development and energy.
National Action Plan for Walking and Cycling 2020,
2012. . Finnish Transport Agency.
OECD, 2009. Reducing transport GHG emissions:
opportunities and costs.
Usón, A.A., Capilla, A.V., Bribián, I.Z., Scarpellini, S.,
Sastresa, E.L., 2011. Energy efficiency in transport
and mobility from an eco-efficiency viewpoint.
Energy, 5th Dubrovnik Conference on Sustainable
Development of Energy, Water & Environment
Systems 36, 1916–1923. doi:10.1016/j.energy.
2010.05.002.
Zhang, B., Postelnicu, C., Lastra, J.L.M., 2012. Key
Performance Indicators for energy efficient asset
management in a factory automation testbed, in: 2012
10th IEEE International Conference on Industrial
Informatics (INDIN). Presented at the 2012 10th IEEE
International Conference on Industrial Informatics
(INDIN), pp. 391–396. doi:10.1109/INDIN.2012.
6301155.
SMARTGREENS2015-4thInternationalConferenceonSmartCitiesandGreenICTSystems
82
