
Parameters Affecting the Energy Performance of the Transport
Sector in Smart Cities
M. Fernanda Mantilla R., Angelica Nieto L. and Jose L. Martinez Lastra
FAST-Lab, Tampere University of Technology (TUT), Tampere City, Finland
Keywords: Transport, Energy, Affecting Parameters, Mobility.
Abstract: The energy requirements of cities’ inhabitants have grown during the last decade. Recent studies justify the
necessity of reducing the energy consumption/emissions in cities. The present paper gives an overview of
the factors affecting the energy consumption of the citizens based on studies conducted in cities across the
globe. The studies cover all the factors that affect citizens’ mobility choice that at the end, affects in the
same way their final energy consumption. The results of the review are being used to support authorities in
mobility decisions in order to achieve a sustainable transport sector in smart cities.
1 INTRODUCTION
Cities authorities have to face a constant growing
population in less space, which not only means
overcrowded systems but also a great demand of
energy. Additionally, it increases traffic jams, health
care problems, etc., resulting in a compromise
quality of life. Solutions to those problems include
integrated systems that use real time data to optimize
individuals’ mobility in a city scale without
compromise travellers’ destination.
It is relevant to understand the factors that
influence individual choice, so authorities can
modify citizens travel patterns. At the moment,
goverments have been changing infrastructures
capacity either by pricing roads or taking back fuel
subsides. However, authorities actions have a
limited impact if the affecting factors, like weather.
have a higher impact on citizen choice.
Currently, city authorities lack a tool to
determinate the future or current energy/emissions in
transport sector. In (Mantilla R. et al., n.d.) a
procedure for cities to measure the energy
performance of the transport sector has been
provided. However, it does not specify the
parameters that can be use to assest energy
efficiency evaluation. A set of performance indicatos
reported in (M. Fernanda Mantilla R. et al., n.d.) and
in the current document, will provide a metric for
authorities to judge the energy efficiency impact of
mobility projects.
This paper present the extensive literature review
that provides a initial stage for the development of
mobility projects, not only for authorities, but also
for all the sectors interested in inhabitants mobility
preferences or individual mobility choices. The
paper is organize as follows: section 2 gives an
overview of the affecting parameters. Section 3
presents the summary of idenfitied affecting
parameters. Section 4 sugest an application, and
section 5 present the conclusions and future work.
2 REVIEW OF PARAMETERS
AFFECTING ENERGY
CONSUMPTION/CARBON
FOOTPRINT VALUES
This section presents the parameters that affect the
Energy Consumption (EC)/Carbon Foot Print (CFP)
values. In the first place, environmental factors such
as a bad weather, may increase congestion, travelled
time, operational cost, or reduce PT reliability. In
this group of parameters, precipitations reduce
average speed on 5-40% with snow and 3-16% with
heavy raining (Leviäkangas et al., 2011). These
reductions leads to longer travel times, higher fuel
consumption, and higher EC from services such as
heating, air-conditioning and lighting (Considine,
2000; Guo et al., 2007).
Another environmental factor is the temperature,
83
Fernanda Mantilla R. M., Nieto L. A. and L. Martinez Lastra J..
Parameters Affecting the Energy Performance of the Transport Sector in Smart Cities.
DOI: 10.5220/0005489700830088
In Proceedings of the 4th International Conference on Smart Cities and Green ICT Systems (SMARTGREENS-2015), pages 83-88
ISBN: 978-989-758-105-2
Copyright
c
2015 SCITEPRESS (Science and Technology Publications, Lda.)

(Guo et al., 2007) which has a correlation between
thermal sensitivity and drive travel demand. High
temperatures increase outdoor activities while on the
contrary low temperatures lead to decline them. In
the case where outdoors activities are in a walk or
cycling distance, the EC does not increase, however
countries like Finland, where the common vacations
are taking in cottages by 4 or 5 hours driving, results
in an increase of energy use and/or carbon
emissions.
Other system that is highly affected by the
weather is the PT. Several studies had shown that
buses are usually more sensitive to weather than
trams/trains, in addition, the trip purpose (work,
leisure, etc.) and time of the week (working days vs
weekend) increases or decreases that sensibility
(Considine, 2000; Guo et al., 2007; Winters et al.,
2007). Despite the weather influence over the
transport sector, the core in the emission levels/EC
depends on each of the people decisions on where to
go and how. In other words, “daily actions of
millions of individual actors. Reducing transports
environmental impact ... will... ultimately require a
more thorough understanding of how individuals
travel decision are motivated and/or constrained by
other factors” (Sitlington, 1999).
The following section describes some of the
variables that affect people’s transport choices.
Having in mind that those decisions are the heart of
the final EC, they represent a great potential for
reducing the overall consumption and/or emissions.
2.1 External Factors
2.1.1 Public Transport
Increases in the use of Public Transport (PT) can
increased by understanding the factors that
discourage its use, such as crowding, service
reliability, high prices, frequency, speed, lack of
information, and accessibility (Guo et al., 2007;
Sitlington, 1999; Paulley et al., 2006). High prices
decrease the PT use, contrary, low prices, increased
number of vehicles and their frequency raise PT
share. Factors with similar effect includes: high
population density, Gross domestic product (GDP)
per capital and the number of buses operating per
1000. G. Santos et.al. (2013) (Santos et al., 2013)
found that passenger’s characteristics such as age,
number of children and gender affects their modal
choice. Fuiji et al. (Fujii and Taniguchi, 2006)
concluded that the primary reason of the citizens for
not using PT is the negative image associated with it
(personal perception). In case of habitual car users,
they had a lack of knowledge about Alternative
Modes (ALM) or PT in terms of perception of time
control (travelled time). Extra facilities like
intermodal connection can change the public PT
perception, by promoting advantages of each of the
modes (Danish Ministry of Transport, 1996).
2.1.2 Cycling and Walking
Precipitation and temperature have strong influences
on cycling choice. Studies found that rain, wind and
temperature have independent effects. In (extremely)
low temperatures people commonly switch from
biking to car/PT, otherwise people walk or cycle,
especially with higher temperatures (>15). Heavy
snow reduces cycling by 60%, slippery surface by
20% and cold weather by 10% (Sabir et al., 2008;
Nankervis, 1999; Flynn et al., 2012). A way to
reduce the impact on biking is by bringing more
infrastructure support such as snow clearing and
sanding of ice along cycling routes, dedicated bike
lines and bike-friendly transit (Winters et al., 2007).
Other factors that increase bicycle use include
traffic-calmed streets, safe and dry and easy access
network, and facilities like parking and PT share
(Sitlington, 1999).
As an example, cities like Örebrö, Sweden has a
priority plan for snow removal and sanding of cycle
paths in the winter time and removal of sand in
spring. Oulu has same priority as well as Zaanstad in
the Netherlands (Heikkilä, 2013). Another example
is Copenhagen, where 80% of cyclists keep on going
in winter, where 90% of Copenhageners own a
bicycle (“Encourage Winter Cycling: Managing
mobility for a better future,” 2014).
Danish are a success story where bicycle is
perceive as a practical alternative for a safe and fast
travel. A survey found that Copenhagen cyclists ride
because: it is easy and fast (54%), for exercise
(19%) and only 1% for environmental reasons
(“Københavns Kommune: Borger,” n.d.). As a
conclusion, providing well usable infrastructure,
encouragement (incentives) and help with bicycle
maintenance can bring higher split percent’s of
cycling riding in cities.
2.1.3 Car Use
The use of private car is less efficient and high
energy demanding. The Environmental Protection
Agency determined that a drop in temperature from
24°C to 7°C increases fuel consumption in urban
trips from 12% to 28% (“US Environmental
Protection Agency,” n.d.; “Fuel Economy in Cold
Weather,” n.d.). This efficiency reduction is caused
SMARTGREENS2015-4thInternationalConferenceonSmartCitiesandGreenICTSystems
84

by several phenomena that happen inside the cars.
One of the causes is the time that takes for the
engine to reach its most fuel-efficient temperature,
warming up the vehicle before starting decreases the
efficiency as car is using fuel without moving.
Additionally, resources in comfort, such as heated
seats, window defrosters, and heater fans, requires
additional power (“Fuel Economy in Cold Weather,”
n.d.).
Authorities all over the globe are encouraging
users to switch to other modes through means of
promotion of energy efficient behaviour, including
energy efficient driving, car-pooling, car sharing,
and car-free zones/areas inside to cities (Danish
Ministry of Transport, 1996). But changes have to
break Travel Choice (TC) processes that are mainly
automatic, people only drive without considering
other alternatives and the cause of this is the
availability of a private vehicle, car ownership is the
principal determinant of car use (Sitlington, 1999;
Scheiner, 2010).
2.1.4 Infrastructure
Infrastructure refers to physical routes, buildings,
etc. that involve long-term capital investment and
determines the drive (car, bicycle etc.) conditions
during the whole year. Winter and spring are the
months for maintenance actions that influence
safety, accessibility, mobility and vehicle cost.
Winter maintenance operations represent a very
substantial portion of year-round maintenance costs
(Guo et al., 2007; Tyrinopoulos and Antoniou,
2013). In Canada $1,3 billion are used annually on
activities related with snow and ice control in public
roads (Leviäkangas et al., 2011). In Finland the cost
of maintenance during winter is 54% of the total
budget.
Additionally, the design of the infrastructure can
determinate the perception of the users. In the case
of PT, distance from start or destination point to
stops as well as the facilities during winter or
autumn (lights and shelter) can change travellers’
waiting and transfer experience. The greatest impact
of the infrastructure is in the mode choice. In
compact cities with high population density and low
available land, short trips are the main kind of trips
and use of PT, walking/cycling mode are the main
choices (Considine, 2000; Tyrinopoulos and
Antoniou, 2013; Scheiner and Holz-Rau, 2007).
2.1.5 Cost and Income
Relative cost of transport modes is an important
factor in TC. In the case of PT, the ticket price
usually reflects the cost of the system. Instead,
private car price is no clear, as it does not include all
their external cost, part of the unclearness comes
from the fact that most of that cost is subsidy for
local governments, representing 7.3% of the
European gross domestic product (Sitlington, 1999).
On the other hand, household income defines the
availability of private car. Results from Mobility
Management and housing program (2008) shows
that higher average income increases the number of
cars per house and their use by 34%. In comparison,
modal split with ALM and PT decreases in higher
proportion (de Jong and van de Riet, 2008;
Tyrinopoulos and Antoniou, 2013; Mobility
Management and housing, 2008).
2.1.6 Trip Characteristics
Some trip characteristics such as trip length, time
flexibility and trip purpose may affect the weather
impact on user’s TC. Long travel distances are more
sensitive to weather because of the exposure time.
Short trip times are less sensitive to weather
conditions. Important trip purpose (e.g. work) might
be more sensitive to weather than leisure ones (Guo
et al., 2007).
Trip length and time travelled are mainly defined
by infrastructure configurations. Basic facilities in
suburban areas such as the closest grocery, can
determinate the TC. If the perception of the distance
is high, car is generally accepted, in contrary, if the
distance is short, the use of bicycle or walk is
acceptable (Scheiner and Holz-Rau, 2007). M. Sabir
et.al. (2008) shows that an additional kilometre of
distance increases car use by 26,7% and PT with
2,2%, contrary to walking and cycling that decrease
by 23,1% and 7,4% respectively (Sabir et al., 2008)
Additionally, TC decisions are mainly done at home
and at work, so land design patterns between these
two destinations are crucial (Tyrinopoulos and
Antoniou, 2013; Mobility Management and housing,
2008; Frank et al., 2007).
2.1.7 Information
At the present time a considerable amount of
information is exchanged from transport system
consultation. Some of that information tried to
motivate car users to switch to PT by empowering
them with localised and advice information about
ALM/PT and leaving the choice to them
(Department of Transport, Australia, 2013). They
found that prioritized and effective distributed
information improves user’s perception (Sitlington,
1999; Department of Transport, Australia, 2013;
ParametersAffectingtheEnergyPerformanceoftheTransportSectorinSmartCities
85

Brög et al., 2002).
2.2 Personal Factors
Several factors can affect the travel behaviour of the
city inhabitants. On one side, personal factors can be
described as social-demographic characteristics,
such as gender, age, education or profession etc.;
and attitudinal factors like values, norms and
attitudes or perceptions about one specific mode.
2.2.1 Social-demographic Characteristics
Social-demographic characteristics, such as age,
gender, income etc., are the source of different
choices on similar conditions. By all means, a
teenager may view snow differently from an elderly
person. M. Sabir et al. (2008) found that age has a
great effect on TC, accordingly, older people (older
than 60) walk more than people younger than 18.
Similar studies in Canada have shown that older
adults and women with lower education and higher
income are much less likely to cycle than teenagers
and men (Winters et al., 2007). However countries
like Netherlands, where cycling is broadly-
entrenched with daily activities, the cycling rates do
not vary across gender or age (Sabir et al., 2008).
Other population that seems to get no affected by
weather conditions is the students. It is probably
cause by their limited transport options (cycling is
cheaper), combined with shorter distance.
Consequently, cities with high proportion of students
have higher cycling and walking rates (Santos et al.,
2013; Scheiner and Holz-Rau, 2007).
2.2.2 Motivations for Change
Initially, to generate some changes, it is required to
define and find the inhabitants habits. J. Prillwitz et
al. (2009) defined habits as an obstructive factor, as
they reduce conscious awareness. Habitual
behaviour simplifies and accelerates transport users’
actions and/or decisions, reducing perception of
travel alternatives, and increase cost for PT/ALM.
Both effects become more significant with an
increasing frequency of use of the TC. In this study
they found two ways to breakup habits, the first one
is by interrupted automatic actions and the second
one, by changing users’ contextual conditions
(Prillwitz and Barr, 2009).
One interrupting action is to introduce moral
considerations and at the same time ALM
information. Web sites such as bike Seasons not
only provide useful tips on how to drive a bicycle in
all seasons, but it is also used for creating cycling
groups. Similar interrupting action is by giving
information about their TC environmental impact,
especially in early ages. “Traffic snake game” in
some countries of Europe, aim to encourage schools,
children and parents to adopt ALM, car sharing or
PT when travelling to and from school (“Game |
Traffic Snake Game,”). In conclusion this kind of
actions break the traditional barriers associated with
ALM/PT like the additional effort and little comfort
perceptions (Prillwitz and Barr, 2009).
To summarize, psychological attachment to car,
lack of information and moral are factors that block
transport behavioural changes. A good quality of PT,
education and moral obligation reduce car use.
2.2.3 Critical Incidents
Another point of view is the critical incidents, where
the changes come from incidents like a crash car or
having a new car. P. van der Waerden et al. (2003)
identified two types of incidents: a change in the
number of available alternatives and a change in its
characteristics (Waerden et al., 2003).
Changes in the number of available alternatives
refer to events that modify the transport
composition. A limited number of studies had
research about life stages and their potential to break
travel habits (Prillwitz and Barr, 2009; Waerden et
al., 2003). Changes on the characteristics of
available alternatives make reference to
modifications in mode like time, cost, and comfort.
3 SUMMARY OF IDENTIFIED
PARAMETERS THAT AFFECT
THE ENERGY EFFICIENCY IN
THE TRANSPOR SECTOR
All the factors that were identified and described in
the previous section are summarized in Figure 1 the
position of the parameter represent a positive effect.
This list of parameters can be compared to the
outcomes of the energy efficiency of the transport
sector when they are under the effects of any (or
several) of them.
4 APPLICATIONS
Mobility authorities have found that, when solving
complex mobility problems, they can give
incentives, so people will figurate out what to do,
SMARTGREENS2015-4thInternationalConferenceonSmartCitiesandGreenICTSystems
86
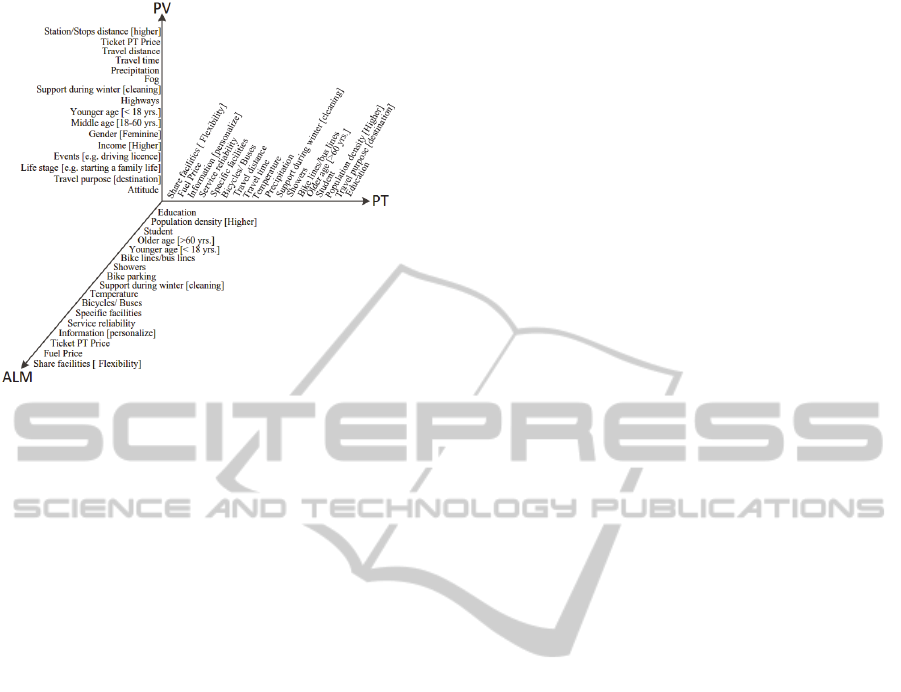
Figure 1: Affecting Parameters: positive effect.
claiming that the system will organize itself. An
example from Stockholm showed reductions of cars
on 20%, in this specific case, the incentive were a
charge in bridges that connect downtown with
surrender neighbourhoods, meaning that somehow
the traffic flow organize itself (Eliasson and
Mattsson, 2006). The factors affecting transport
choices can be applied in a way that authorities can
give incentives in the case where the target mode
(PT or ALM etc.) is affected negatively by the
factors, before users make choices or penalize it in
situations where the factors are affecting positively
so the opportunity for change can be stablished.
5 CONCLUSIONS
Some affecting parameters were presented and
summarized in this paper. They are based on the
numerous studies and research in mobility. The
parameters are significant aspects related to the
energy performance of the smart cities, specifically
transport sector, which should be taken into account
when authorities implement mobility projects.
Therefore applications or services that use the
parameter can have a better approximation or
understanding the transport system performance.
Finally, future work will be in the application of
those parameters in smart cities.
ACKNOWLEDGEMENTS
This work has partially received funding from
European Union’s Seventh Framework Programme
for research, technological development and
demonstration under grant agreement number
608885, correspondent to the project shortly entitled
MoveUs (ICT Cloud-Based Platform And Mobility
Services Available, Universal And Safe For All
Users).
REFERENCES
Brög, W., Erl, E., Mense, N., 2002. Individualised
marketing changing travel behaviour for a better
environment, in: Paper Presented at the OECD
Workshop: Environmentally Sustainable Transport.
pp. 06–12.
Considine, T.J., 2000. The impacts of weather variations
on energy demand and carbon emissions. Resour.
Energy Econ. 22, 295–314. doi:10.1016/S0928-
7655(00)00027-0.
Danish Ministry of Transport, 1996. The Danish
Government’s Action Plan for Reduction of the CO2-
Emissions of Transport Sector.
De Jong, G.C., van de Riet, O., 2008. The driving factors
of passenger transport. EJTIR 3.
Department of Transport, Australia, 2013. TravelSmart /
Living Smart (WWW Document). URL
http://www.transport.wa.gov.au/activetransport/24605.
asp (accessed 8.21.14).
Eliasson, J., Mattsson, L.-G., 2006. Equity effects of
congestion pricing: Quantitative methodology and a
case study for Stockholm. Transp. Res. Part Policy
Pract. 40, 602–620. doi:10.1016/j.tra.2005.11.002.
Encourage Winter Cycling: Managing mobility for a
better future (WWW Document), 2014.EPOMM Eur.
Platf. Mobil. Manag. URL http://www.civitas.eu/sites/
default/files/epomm_eupdate_en_winter_cyling .pdf
(accessed 8.13.14).
Flynn, B.S ., Dana, G.S., Sears, J., Aultman-Hall, L.,
2012. Weather Factor Impacts on Commuting to Work
by Bicycle (No. 12-006). Transportation Research
Center Farrell Hall, Burlington.
Frank, L., Bradley, M., Kavage, S., Chapman, J., Lawton,
T.K., 2007. Urban form, travel time, and cost
relationships with tour complexity and mode choice.
Transportation 35, 37–54. doi:10.1007/s11116-007-
9136-6.
Fuel Economy in Cold Weather (WWW Document), n.d.
URL http://www.fueleconomy.gov/feg/
coldweather.shtml (accessed 8.13.14).
Fujii, S., Taniguchi, A., 2006. Determinants of the
effectiveness of travel feedback programs—a review
of communicative mobility management measures for
changing travel behaviour in Japan. Transp. Policy 13,
339–348. doi:10.1016/j.tranpol.2005.12.007.
Game | Traffic Snake Game (WWW Document), n.d. URL
http://www.trafficsnakegame.eu/game/ (accessed
2.11.15).
Guo, Z., Wilson, N.H.M., Rahbee, A., 2007. The impact
ParametersAffectingtheEnergyPerformanceoftheTransportSectorinSmartCities
87

of weather on transit ridership in Chicago. Presented at
the TRB 2007 Annual Meeting, Massachusetts.
Heikkilä, P., 2013. winter cycling in Oulu- towards new
challenges. Presented at the Winter Cycling Congress,
Oulu, Finland.
Københavns Kommune: Borger (WWW Document), n.d.
URL http://www.kk.dk/da/borger (accessed 8.18.14).
Leviäkangas, P., Tuominen, A., Molarius, R., Kojo, H.,
Schabel, J., Toivonen, S., Keränen, J., Ludvigsen, J.,
Vajda, A., Tuomenvirta, H., Juga, I., Nurmi, P.,
Rauhala, J., Rehm, F., Gerz, T., Muehlhausen, T.,
Schweighofer, J., Michaelides, S., Papadakis, M.,
Dotzek, N., Groenemeijer, P., 2011. Extreme weather
impacts on transport systems.
Mantilla R., M.F., Nieto L., A., Martinez Lastra, J.L.,
Kotakorpi, E., n.d. Methodology for energy efficiency
assessment in the transport sector for smart cities.
Unpublished.
M. Fernanda Mantilla R., Nieto L., A., Martinez Lastra,
J.L., n.d. Definition of Key Performance Indicators
for Energy Efficient Assessment in the Transport
Sector. (Unpublished).
Mobility Management and housing, 2008. Factors
Influence Mobility Behaviour.
Nankervis, M., 1999. The effect of weather and climate on
bicycle commuting. Transp. Res. Part Policy Pract. 33,
417–431.
Paulley, N., Balcombe, R., Mackett, R., Titheridge, H.,
Preston, J., Wardman, M., Shires, J., White, P., 2006.
The demand for public transport: The effects of fares,
quality of service, income and car ownership. Transp.
Policy 13, 295–306.
Prillwitz, J., Barr, S., 2009. Motivations and barriers to
adopting sustainable travel behaviour.
Sabir, M., Koetse, M.J., Rietveld, P., 2008. The impact of
weather conditions on mode choice: empirical
evidence for the Netherlands. Dep. Spat. Econ. VU
Univ. Amst.
Santos, G., Maoh, H., Potoglou, D., von Brunn, T., 2013.
Factors influencing modal split of commuting
journeys in medium-size European cities. J. Transp.
Geogr. 30, 127–137. doi:10.1016/
j.jtrangeo.2013.04.005.
Scheiner, J., 2010. Interrelations between travel mode
choice and trip distance: trends in Germany 1976–
2002. J. Transp. Geogr. 18, 75–84.
doi:10.1016/j.jtrangeo.2009.01.001.
Scheiner, J., Holz-Rau, C., 2007. Travel mode choice:
affected by objective or subjective determinants?
Transportation 34, 487–511.
Sitlington, J., 1999. Moving to Healthier people and
Healthier Places. VicHealth, health promotion
foundation, Autralia.
Tyrinopoulos, Y., Antoniou, C., 2013. Factors affecting
modal choice in urban mobility. Eur. Transp. Res.
Rev. 5, 27–39. doi:10.1007/s12544-012-0088-3.
US Environmental Protection Agency (WWW Document),
n.d. URL http://www.epa.gov/ (accessed 8.18.14).
Waerden, P. van der, Timmermans, H., Borgers, A., 2003.
Key Events and Critical Incidents Influencing
Transport Mode Choice Switching Behavior: A
descriptive analysis, in: The Physical and Social
Dimensions of Travel. Presented at the 10 the
International Conference on Travel Behaviour
Research, Lucerne.
Winters, M., Friesen, M.C., Koehoorn, M., Teschke, K.,
2007. Utilitarian Bicycling: A Multilevel Analysis of
Climate and Personal Influences. Am. J. Prev. Med.
32, 52–58. doi:10.1016/j.amepre.2006.08.027.
SMARTGREENS2015-4thInternationalConferenceonSmartCitiesandGreenICTSystems
88
