
Telco Clouds
Modelling and Simulation
Jakub Krzywda
1
, William T
¨
arneberg
2
, Per-Olov
¨
Ostberg
1
, Maria Kihl
2
and Erik Elmroth
1
1
Dept. of Computing Science, Ume
˚
a University, SE-901 87 Ume
˚
a, Sweden
2
Dept. of Electrical and Information Technology, Lund University, SE-223 63 Lund, Sweden
Keywords:
Mobile Cloud Computing, Telecommunication Infrastructure, Cloud Infrastructure, Modelling, Simulation.
Abstract:
In this paper, we propose a telco cloud meta-model that can be used to simulate different infrastructure config-
urations and explore their consequences for system performance and costs. To achieve this, we analyse current
telecommunication and data centre infrastructure paradigms, describe the architecture of the telco cloud, and
detail the benefits of merging both infrastructures in a unified system. Next, we detail the dynamics of the
telco cloud and identify the components that are the most relevant from the perspective of modelling perfor-
mance and cost. As a number of well established simulation technologies exist for most of the telco cloud
components, we survey existing models in an attempt to construct a suitable composite meta-model. Finally,
we present a showcase scenario to demonstrate the scope of our telco cloud simulator.
1 INTRODUCTION
Recent technological developments have enabled a
union of telecommunication and cloud computing.
Joint management of telecommunication infrastruc-
ture, such as Radio Base Stations (RBS), and Data
Centres (DC) may help to achieve better performance
of hosted applications and reduce the operation costs.
In this paper we refer to this paradigm as telco cloud
computing (Bosch et al., 2011).
Despite the interest in this paradigm, there are no
simulation models capable of simultaneously mod-
elling the dynamics of Mobile Devices (MD), place-
ment and capacity of DCs, and network infrastructure.
Understanding of these relations is important for telco
cloud stakeholders, e.g., Infrastructure Providers (IP)
that can use that knowledge to reduce infrastructure
costs while still delivering competitive performance.
We propose a meta-model of the telco cloud that
facilitates experimentation and evaluation of possi-
ble configurations, such as placement and capacity
of DCs in a joint telecommunication-cloud infrastruc-
ture. The meta-model uses existing, well established
simulation models, e.g., for Radio Access Networks
(RANs) or DCs, for modelling of individual parts of
the infrastructure behaviour.
The contributions of this paper are: describing the
dynamics of the telco cloud, including Quality of Ser-
vice (QoS) and the associated costs of this paradigm
(Section 4); surveying existing models of telco cloud
building blocks (Section 5); and establishing a meta-
model that captures the described dynamics using ex-
isting and composite models (Section 6).
This paper is structured as follows. Section 2
outlines the architecture of the proposed telco cloud.
Next, the simulation motivations, challenges, and re-
quirements that the meta-model has to fulfill are pre-
sented in Section 3. Section 4 describes the telco
cloud dynamics, followed by a survey of existing
models in Section 5. Section 6 introduces the telco
cloud meta-model. Section 7 presents a showcase
simulation scenario, using a prototype implementa-
tion of the introduced meta-model. In Section 8 we
list a few relevant research topics that can be explored
using the proposed model and conclude the paper.
2 THE TELCO CLOUD
ARCHITECTURE
In this section we present issues with current telecom-
munication and cloud infrastructures, an overview of
the proposed telco cloud topology, and how the telco
cloud paradigm can help to remedy these issues.
597
Krzywda J., Tärneberg W., Östberg P., Kihl M. and Elmroth E..
Telco Clouds - Modelling and Simulation.
DOI: 10.5220/0005494805970609
In Proceedings of the 5th International Conference on Cloud Computing and Services Science (CLOSER-2015), pages 597-609
ISBN: 978-989-758-104-5
Copyright
c
2015 SCITEPRESS (Science and Technology Publications, Lda.)

2.1 Current Infrastructure
Currently, telecommunication and cloud computing
infrastructures are separated and managed indepen-
dently. The telecommunication infrastructure is
placed in close proximity to end users and is built us-
ing specialised hardware. The cloud computing in-
frastructure consists of remote DCs that are signifi-
cantly geographically separated from end users, con-
sists of commodity hardware, and is connected with
the telecommunication infrastructure via the Internet.
We identify several issues of the current infras-
tructure. Performance (especially latency) of cloud
services is not predictable, which makes computation
offloading difficult. All data processed in the cloud
are sent over the Internet to DCs, which adds com-
munication latency. For the Internet of Things, with
millions of sensors generating huge amounts of data,
the volume of traffic can cause network congestion.
Moreover, specialised telecommunication hardware is
expensive and hard to upgrade.
As a consequence of the performance bottlenecks,
particularly latency sensitive applications such as in-
dustrial process control and augmented reality con-
text recognition applications have mostly not yet been
cloudified. The low latency, jitter free, and high
throughput connections required by such applications
cannot be provided by the existing telecommunica-
tion and cloud infrastructures (Barker and Shenoy,
2010). Moreover, compute and battery resources in
MDs are limited and coupled. An approach to aug-
menting MD’s capabilities is to offload the execution
of applications to a cloud infrastructure. Such perfor-
mance augmentation can only be seamless if the com-
munication latency is low enough, and both network
bandwidth and service availability are high.
Devices are at an increasing rate gaining access
to the Internet (Atzori et al., 2010). Anything from
small sensors to petrol pumps, flowerpots, helmets,
tumblers, windows, and spark plugs is being con-
nected to the Internet to communicate and monitor
its quantified performance metrics. Most of the con-
nected devices are generating correlated contextual
information, incurring large amounts of Wide Area
Network’s (WAN) traffic. The traffic typically con-
verges to a handful of DCs for analysis and processing
which introduces congestion in the capacity-sparse
and increasingly congested RANs, core networks, and
WANs. Additionally, a portion of the transported in-
formation is only locally relevant and will add no or
very little entropy to a service in a Remote DC.
Wireless access network virtualisation and cloud-
ification of telecom equipment and services proposed
by (Wang et al., 2013), requires careful placement of
Mobile Device
Radio Base Station
Radio Base Station
Controller
Radio Catchment Border
Network
Proximal Data Centers
Remote Data Centre
Figure 1: Overview of telco cloud.
compute capacity as not to introduce significant prop-
agation delay. The placement of the compute nodes
has to reflect the demand for telecom- and cloud-
services in the geographic area which the RAN cov-
ers. Current telecom signalling standards and remote
DCs do not interoperate well and are often not able to
meet telecom latency requirements.
2.2 Introducing the Telco Cloud
A telco cloud is an infrastructure consisting of MDs
(known also as user equipment), stationary devices
(sensors), access networks, intermediate WANs (con-
necting the access networks to the backbone net-
works), backbone (Internet) networks, and DCs. We
here include two main types of DCs: Remote Data
Centres (large DCs located far from the access net-
works) and Proximal Data Centres (smaller DCs lo-
cated close to the access networks).
The telco cloud topology paradigm proposes
a closer integration between access networks and
a cloud infrastructure than the current topological
model where the telecom and cloud infrastructures
are unaware of each other. When coexisting with
cloud infrastructure, telecommunication functionality
can be virtualised and augmented to the adjacent DCs.
When virtualising RAN functions large portions of an
RBS and the RAN control functions can be executed
in a DC (Baroncelli et al., 2010).
Cloud capacity will reside in geographically dis-
tributed DCs. The telco cloud topology is composed
of multiple DCs that are dispersed in a mesh structure,
ranging from complete adjacency with the telecom in-
frastructure, Proximal DCs, to more traditional, Re-
mote DCs, as depicted in Figure 1.
A group of telco cloud DCs can be provisioned
and load balanced as one resource or act as indepen-
CLOSER2015-5thInternationalConferenceonCloudComputingandServicesScience
598

dent DCs. In the former case, a control plane will
need to coordinate services and the shared resources
by for example optimising locality and proximity to
all entities by geographically placing services accord-
ingly. Proximal DCs will thus have to be managed in
a distributed and coordinated manner.
The cloud services hosted in Proximal DCs are ac-
cessed through the RAN. The MDs are assumed to
possess varying degrees of mobility, with an equiv-
alent likelihood of passing between a particular set
of macro/micro-RBS
1
over time. In an effort to be
able to enforce DC management constraints and to
globally avoid unnecessary migration, an MD is not
strictly associated with the closest DC or the DC that
its current RBS cell is associated with.
The telco cloud infrastructure topology will need
to reflect the capacity and latency objectives of the
virtualised RBSs, and to give access to the telco
cloud-hosted services given the networks local capa-
bility and diversity at a sufficient service level. The
prevailing 4G/LTE topology is centred around hierar-
chical macro- and micro-cells that very much resem-
bles that of its predecessors. The telco cloud topol-
ogy will evolve with mobile access technology gen-
erations, shifting and/or dispersing compute capacity
at various levels of mobile, Metropolitan Area Net-
work (MAN), and WAN networks to best suit the pre-
vailing services and throughput channels.
2.3 Benefits of the Telco Cloud
We identify four main benefits of the telco cloud.
First, it provides cloud applications with better and
more predictable performance. Second, it supports
computation off-loading for resource-bounded MDs.
Third, the telco cloud reduces network utilization by
processing part of data closer to its producer or con-
sumer. Fourth, it enhances cost-efficiency and flexi-
bility of telecommunication infrastructure.
Thanks to a geographically distributed cloud in-
frastructure, application developers and telecommu-
nication operators can take advantage of the signif-
icantly lower round-trip times. Moreover, we ex-
pect that the average network throughput will increase
when communicating with Proximal DCs in compar-
ison to Remote DCs. Additionally, users offloading
MD applications will benefit from a low latency com-
munication with a DC, where the code is executed.
The large amount of information generated by
sensors can be filtered through the intermediate hier-
archical cascade of DCs to prevent congestion in the
intermediate WAN. Data that is only locally relevant
1
What is considered a traditional rural/urban cell, con-
stituted by a high power RBS, mounted on a tower.
can be kept and consumed locally, while redundant
and highly covariant information can be more easily
identified in a local context and discarded.
Through the telco cloud traditional proprietary
hardware-bound telecom services can be virtualised,
migrated, and executed in Proximal or Remote DCs.
Multiple RBSs can be consolidated to increase the
aggregate utilisation of the infrastructure. Executing
RBSs on cloud infrastructure will allow for greater
use of cost-effective commodity hardware and generic
software. With the availability of the telco cloud, we
expect that an RBS in future mobile infrastructure
generations will only consist of a radio interface. The
management of the RAN, individual radio channels,
signalling, services, and signal processing, will be all
virtualised and executed in a Proximal DC.
3 SIMULATION CHALLENGES
Simulation of a telco cloud is motivated by several
factors, e.g., lack of existing infrastructure and appro-
priate control plane standards. The desired simulator
has to fulfil many requirements, such as, to be able to
simulate hundreds of thousands of various entities at
fine grained time granularity (milliseconds) for long
periods of time (hours). We here motivate and de-
scribe identified requirements and challenges in sim-
ulation of the telco cloud. Addressing the challenges
and fulfilling the requirements is crucial while design-
ing a meta-model and implementing a simulator.
Telco cloud stakeholders will benefit from being
able to investigate the consequences of possible in-
frastructure configurations. For example, IPs respon-
sible for building and maintaining the infrastructure
may use the simulator for planning placement and ca-
pacity for new DCs, as well as modifying capacity
and connectivity of existing DCs. Service providers
that use infrastructures to host services are interested
in comparing different strategies for placement of ap-
plication components. Moreover, developers that im-
plement mobile applications utilising a telco cloud,
need to determine what application components could
benefit from offloading. To answer these and simi-
lar questions, tests with various infrastructure config-
urations need to be performed and results compared.
There are two options for performing these tests: by
simulation or by running them in real test beds.
Currently, there is no existing infrastructure that
can be used for testing the telco cloud. Creating
a physical test bed for large-scale testing of a telco
cloud in different configurations is economically in-
feasible and small-scale test beds will not be able to
capture phenomena occurring in reality, e.g., user mo-
TelcoClouds-ModellingandSimulation
599
Workload
- Application
- Mobility
Objectives
- QoS
- Cost
Setup
- Topology
- Capacity
- Service
placement
Figure 2: Dependencies between elements of a telco cloud.
bility patterns or latency issues.
For these reasons, we believe that simulation is
the most feasible option to evaluate the telco cloud.
However, we have identified several requirements that
make simulation of telco clouds challenging. First of
all, the scale of simulation is large in terms of number
and types of entities. The simulation of a telco cloud
has to concurrently cover hundreds of thousands of
MDs moving around a simulated area, each gener-
ating requests; hundreds of RBSs providing an ac-
cess to the core network; and tens of DCs, running
services that process requests. Another challenge is
the ratio between time precision and length of simu-
lation. We are interested in a very fine-grained latency
simulation, that requires precision of at least millisec-
onds. However, to capture the daily patterns of MD
movement (e.g., moving between home, work, and
shops) caused by migrations of users carrying them,
the whole system needs to simulate several run-time
hours. Moreover, simulation of application stateful-
ness, and of transferring those states when MDs are
moving, have not yet been described in the literature
and requires new models to be developed.
4 TELCO CLOUD DYNAMICS
Before constructing a meta-model of the telco cloud
we first need to understand fundamental telco cloud
dynamics, in terms of the relations between system
input, configuration and output. Later, we will use the
knowledge of these dynamics to build the intended
simulation meta-model.
Figure 2 visualizes the dynamics inside the telco
cloud. The workload is an input to the system that IPs
have no influence over. It includes: applications, with
a request generation model (rate and size), a resource
requirements model (the amount of resources needed
to process a request), and application statefulness (the
overhead of transferring user’s state between DC); as
well as, the mobility of users carrying MDs.
Next, objectives describe required output charac-
teristics of the system. We have identified two funda-
mental objectives. Firstly, QoS, which imposes per-
formance requirements, e.g., latency or throughput
through Service Level Objectives (SLO). Secondly,
the monetary cost associated with energy consumed
for computation and maintenance of an infrastructure.
The objectives can be used when constructing an op-
timisation problem with QoS as conditions and cost
as the function that should be minimised.
Finally, setup is that part of the system that can
be adjusted by designers or operators to achieve de-
sired objectives when processing existing workloads.
Setup includes topology, location, capacity of DCs
and the network that interconnects MDs and RBSs
with DCs, as well as resource management policies
that control placement and migration of services.
The above mentioned elements are all dependent
on each other. The setup of a telco cloud is related
to the existing workload. The capacity of a DC is de-
fined by the resource demands of the services, e.g.
how memory-, CPU-, network-, and disk-intensive
the services are. The locations and topology of DCs
are defined by the geographic and demographic scope
of the services, the number of MDs that reside in that
domain, and the capacity of the associated telecom-
munication infrastructure.
In addition, workload influences objectives. For
example, user mobility is inducing delays during ser-
vice migrations and potentially causes QoS penalties.
Moreover, application statefulness introduces addi-
tional costs of storing data in a DC and transmitting
data between Proximal DCs. It may also increase la-
tency due to an additional time necessary to send the
state data before processing of the request can begin.
Finally, objectives depend on the setup: QoS is
proportional to the proximity and capacity of DC –
a smaller DC catchment (the geographic area the DC
serves) translates to greater locality and reduced prop-
agation latency, while higher capacity allows hosting
of more services. Moreover, the capacity and catch-
ment of DCs determine telco cloud costs. Costs are
proportional to the dispersion of computing capac-
ity. There is an overhead of each DC, irregardless of
its capacity, e.g., building, cooling infrastructure, and
connection to energy or network. In addition, disper-
sion increases costs of maintenance, e.g., technicians
have to travel between locations. Therefore, costs are
proportionally higher in smaller, dispersed DCs be-
cause of high initial costs and proportionally lower in
larger, centralized DCs due to the economy of scale
(Armbrust et al., 2010).
5 EXISTING MODELS
To support creation of a meta-model that incorporates
workload, setup, and objectives of the telco cloud de-
scribed in the previous section, we here survey exist-
CLOSER2015-5thInternationalConferenceonCloudComputingandServicesScience
600

ing models in the following categories: application re-
quest generation and resource requirements, MD mo-
bility, networks, DCs, and infrastructure costs.
Most of the models and simulators are assigned
to only one of the above mentioned categories, how-
ever capabilities of four surveyed simulators extend to
many categories, so we summarise them in Table 1.
Table 1: Overview of surveyed simulators.
Framework RG RR M N DC
NS-3 X X X
OMNeT++ X X X
CloudSim X X
GreenCloud X X
RG – Request Generation, RR – Resource Require-
ments, M – Mobility, N – Network, DC – Data Centre.
5.1 Workload Models
Applications running in the telco cloud consist of a
mobile client and a server processing offloaded com-
putations. Therefore, they should be modelled from
two perspectives: request generation that describes
how requests are created and sent to the DCs; and re-
source requirements that describes how much compu-
tational resources are needed to process the requests.
Request Generation
Request generation models capture the user’s be-
haviour by primarily representing interaction times or
the timing clicks through a stochastic process, often
Poissonian in nature. A user behaviour model can
be further refined by introducing a stochastic model
for how long time a user consumes a certain type of
content. Additionally, the transition between types of
content is often modelled as a Markov process.
Furthermore, the request generation characteris-
tics are commonly modelled with multiple stochas-
tic processes, encompassing the number of packets
in a session, and the size of each packet. Request
generation models are either closed or open looped.
In an open loop model, the generation of each new
session is typically a Poisson process independent of
the resulting DC action. Conversely, in a closed loop
model, the generation of new sessions is dependent
on timing of the response from the DC and thus the
properties of the previously generated session.
In the packet-level event driven network simula-
tors, NS-3 (Riley and Henderson, 2010) and OM-
NeT++ (Varga et al., 2001), a node can act as either
a client or server, by the mechanism of either send-
ing packets provided by a stochastic model, at a given
rate, within a certain time period, or at a certain in-
terval; or processing received packets from a buffer,
at a given rate. Both server and client models can be
augmented with a more complex system of queues to
such an extent that they can represent an abstract DC
that hosts multiple applications.
Resource Requirements
CloudSim (Calheiros et al., 2011), a simulator of
cloud infrastructure, provides an application model
that describes computational requirements – the
amount of resources that needs to be available (e.g.
number of cores, memory and storage); and com-
municational requirements – the amount of data that
needs to be transferred. GreenCloud (Kliazovich
et al., 2012), a packet level simulator based on NS-
2, apart from computational and communicational
requirements, describes also QoS requirements, ex-
pressed by an execution deadline. The application
model may also include the size of the code that has
to be offloaded and dependencies on other services,
e.g., in terms of amount of data that has to be sent or
received (Kovachev, 2012).
Mobility
The NS-3 and OMNeT++ nodes described above can
be set into motion given a certain stochastic mobility
model. They can for example traverse the space as
pedestrians, or in auto mobiles, with corresponding
velocity and rate of change. The spatial relationship
between nodes and RBS affects the channel properties
and RBS-to-node associations. Node mobility will
also result in handover between RBSs, which in turn
will alter the paths of the node-generated workload in
the network.
5.2 Setup Models
Below, we describe existing models and simulators of
networks and DCs, which can be used to configure the
setup of the telco cloud meta-model.
Network
There are several well-established event-driven
frameworks that are capable of modelling computer
networks, mobile networks, applications, packet-level
network traffic, infrastructure, and independent users.
The two primary examples are, as mentioned in the
previous section, NS-3 and OMNeT++. These two
are commonly deployed in academic network re-
search and provide detailed results on network utili-
sation, throughput, congestion, and latency.
TelcoClouds-ModellingandSimulation
601

Both NS-3 and OMNeT++ are comprehensive
packet-level network simulation frameworks that in-
clude wired and wireless standards, and are able to
simulate communication channel conditions. Fur-
thermore, both frameworks have detailed models for
channel definition, such as propagation delay, inter-
ference, data rate, and medium access schemes. In
addition, both NS-3 and OMNeT++, support control
plane signalling for a number of wireless standards
and complex network topologies.
Both frameworks have support for modelling dif-
ferent types of network nodes, ranging from com-
puters to routers and switches. Each edge and node
pair has a defined communication and medium access
standard, such as TCP/IP and Ethernet. Each packet
that is sent over the network is treated in accordance
with the prevailing network’s transport protocols and
routing standard. In both, the events of arrival and
departure of packets drive the simulation clock.
Furthermore, they require detailed configuration
of all communication modes and node behaviour,
making it very time-consuming to implement and ver-
ify systems with different levels of abstractions, and
are thus cumbersome to model abstract systems.
As the telco cloud topology is yet to be de-
fined with unspecified control planes, it would be
counter-intuitive and time consuming to implement
telco cloud topologies in either NS-3 or OMNeT++.
In some instances, some modules would have to be
completely redesigned, and others would have to be
specified to a much greater detail than the telco cloud
can offer at this stage.
Data Centre
The purpose of this section is to survey the DC mod-
els that are the most suitable for inclusion in the
telco cloud meta-model. An extensive list of mathe-
matical models, simulation approaches, and test beds
can be found in (Sakellari and Loukas, 2013), while
(Ahmed and Sabyasachi, 2014) provides a survey of
twelve cloud simulators. After careful examination,
we chose the ones that best suit our goals.
We compare DC models and simulators based on
descriptions provided by the authors of the simulators.
For each model we describe: Resource Provisioning
– what resources are included and how they are mod-
elled; QoS – what performance indicators are mea-
sured; Costs of computation in the DC; Performance
of simulator – an estimation of the time needed to per-
form a simulation.
CloudSim is an event-based simulator imple-
mented in Java, for simulation of cloud computing
system and application provisioning environments.
Resource Provisioning. The CloudSim simulation
layer offers dedicated management interfaces for
CPU, memory, storage and bandwidth allocation, as
well as, defining policies in allocating hosts to Vir-
tual Machines (VM) – VM provisioning. Hosts are
described by processing capabilities (in MIPS) and
a core provisioning policy, together with an amount
of available memory and storage. A model sup-
ports time-sharing and space-sharing core provision-
ing policies on both host and VM levels.
Latency (QoS). The latency model is based on con-
ceptual networking abstraction, where the communi-
cation delays between each pair of entity type (e.g.
host, storage, end-user) are described in a latency ma-
trix as a constant value expressed in simulation time
units (e.g. milliseconds).
Costs. CloudSim provides a two-layered cost model,
where the first layer relates to Infrastructure as a Ser-
vice (IaaS), with costs per unit of resources, while the
second one relates to Software as a Service (SaaS),
with costs per task units (application requests). This
model allows calculation of the costs of using the
cloud from the end-user perspective or the revenue
from the IP perspective.
Performance. CloudSim is able to perform large-scale
simulations, e.g., it can instantiate an experiment with
1 million hosts in 12 seconds. Moreover, memory
usage grows linearly with the host number and even
with 1 million hosts it does not exceed 320 MB.
CloudAnalyst (Wickremasinghe et al., 2010) is
a simulator of geographically distributed large-scale
cloud applications, that is developed in Java and
utilises CloudSim and SimJava.
Resource Provisioning. Cloud Analyst uses the re-
source provisioning model of CloudSim.
Latency (QoS). A latency model allows configuration
of network delays, available bandwidth between re-
gions, and current traffic levels. CloudAnalyst fa-
cilitates experiments with latency by producing the
following statistical metrics: average, minimum, and
maximum response time of all user requests; and re-
sponse time grouped by time of the day, location, and
DC.
Costs. CloudAnalyst supports calculation of costs for
using cloud resources, such as cost per VM per hour
and cost per Gigabit of data transfer.
Performance. To improve performance of simulation
entities are grouped at three levels: clusters of users,
cluster of requests generated by users, and clusters of
requests processed by VM.
GreenCloud is a packet level simulator based on
NS-2, for simulation of energy-aware clouds.
Resource Provisioning. Servers are modelled as sin-
gle core nodes with defined processing power limit (in
CLOSER2015-5thInternationalConferenceonCloudComputingandServicesScience
602

MIPS or FLOPS), size of memory and storage, and
implementing different task scheduling mechanisms.
Latency (QoS). Full support for the TCP/IP protocol
reference model is provided and the simulator calcu-
lates communication latency with high accuracy.
Costs. GreenCloud allows detailed modelling of en-
ergy consumption by implementing energy models
for every DC element.
Performance. Given that GreenCloud has to simulate
the full stack of Internet protocols, each simulation
may take even tens of minutes for a DC with a few
thousands of nodes.
5.3 Costs Models
The above mentioned DC models focus mostly on the
costs of running applications in DCs from the end-
user perspective. Since we want to model costs of
DCs from the IP point of view, additional models are
needed for capital expenditures (CAPEX) and operat-
ing expenditures (OPEX).
CAPEX includes costs of infrastructure that needs to
be built and servers that have to be bought.
Infrastructure Costs. Costs of building, power distri-
bution, (and cooling can be estimated using a follow-
ing equation: $200M · (1+ c
m
)/a
i
, where c
m
is the
cost of money
2
, and a
i
is the time of infrastructure
amortisation [in years] (Greenberg et al., 2008).
Server Costs. Costs of servers can be modelled as
n
s
· p
s
·(1 + c
m
)/a
s
, where n
s
is the number of servers,
p
s
is the price of one server [in $], c
m
is the cost of
money, and a
s
is the time of server amortisation [in
years] (Greenberg et al., 2008).
OPEX consists of power and personnel costs.
Power Costs. To estimate costs of power, the follow-
ing equation can be used, n
s
· pc
s
/1000 · PUE · p
kWh
·
24 · 365, where n
s
is the number of servers, pc
s
is
the power consumption of one server [in W], PUE
is Power Usage Efficiency, and p
kWh
is the price of
electricity [in $ per kWh] (Greenberg et al., 2008).
Personnel Costs. Costs of personnel can be calcu-
lated using M
1
·C
1
+ M
2
·C
2
+ M
3
·C
3
, where M
1
is
the number of IT personnel per rack, M
2
is the num-
ber of facility personnel per rack, M
3
is the number
of administrative personnel per rack, and C
1
, C
2
, C
3
are the average costs per person for each of the above
mentioned categories (Patel and Shah, 2005).
From another perspective, Mu
˜
noz et al., provide
an evaluation of telecom, storage and computing costs
for cloud infrastructure (Mu
˜
noz et al., 2011)
2
Cost of money is the rate of interest or dividend pay-
ment on borrowed capital.
Radio Base Station
Data Centre
User State
Application Queue
Request
Figure 3: Visualisation of telco cloud meta-model.
6 TELCO CLOUD META-MODEL
We here detail how we have composed the above sur-
veyed models into a telco cloud meta-model. Figure 3
depicts the visualisation of the meta-model. MDs,
such as cell phones or laptops, are carried by end-
users, who are in motion. The MDs generate requests
which are sent over the network to a DC. It is also
possible that requests are generated by sensors that
may be static (e.g. traffic cameras) or mobile (e.g.
trains). The requests are processed in the DC and the
response is sent back to the MD or sensor. Processing
requests, in case of stateful applications, generates a
user state that has to be migrated with the end-user if
he moves to the catchment of another DC.
The primary objective of the meta-model is to cap-
ture the interactions between application workload,
MD mobility, network topology, and DC character-
istics, and their influence on QoS and costs of telco
cloud. The parameters that define the meta-model are
presented in Table 2 and described in detail below.
6.1 Workload Model
The first group of parameters in Table 2 describes the
mobility of end-users carrying MD and the character-
istics of requests generated by these MDs.
Request Generation
Many services may run in the telco cloud at the same
time and their number is defined by N
ser
. We model
a service application as a stateful web service. Each
session is separated in time with a Poisson process
λ
ses
(Reyes-Lecuona et al., 1999). Each session pro-
duces N
req
requests, sampled from an inverse Gaus-
TelcoClouds-ModellingandSimulation
603

Table 2: Fundamental meta-model parameters.
Type Parameters Unit Description
WORKLOAD
Request
Generation
N
ser
Total number of services
λ
i
ses
, where i = 1, 2,... ,N
ser
s Session arrival rate to DC
N
i
req
, where i = 1, 2,... ,N
ser
Number of requests per session
S
i
req
, where i = 1, 2,... ,N
ser
KB Size of requests
D
i
req
, where i = 1, 2,... ,N
ser
s Inter-request time
Resource
Requirements
CPU
i
idle
, CPU
i
req
, where i = 1, 2,... ,N
ser
MI CPU cycles used by service
mem
i
idle
, mem
i
req
, where i = 1, 2,... ,N
ser
MB Size of memory used by service
disk
i
idle
, disk
i
req
, where i = 1, 2,... ,N
ser
MB Size of storage used by service
state
i
, where i = 1, 2,... ,N
ser
MB Size of user’s state per request
Mobility
N
MD
Number of Mobile Devices
s
i
t
, a
i
t
, θ
i
t
, ω
i
t
, where i = 1, 2,... ,N
MD
Movements of Mobile Devices
SETUP
Network
N
RBS
Number of Radio Base Stations
d
RBS
m Dimensions of an RBS cell
D
net
s Cumulative network delay
Data Centre
N
DC
Number of Data Centres
N
i
S
, where i = 1, 2,... ,N
DC
Number of servers in Data Centre
N
j
CPU
, where j = 1, 2, ..., N
i
S
Number of CPUs per server
s
j
CPU
, where j = 1, 2, ..., N
i
S
MIPS CPU’s speed
memory
j
, where j = 1, 2, ..., N
i
S
MB Amount of memory per server
storage
j
, where j = 1, 2, ..., N
i
S
GB Amount of storage per server
network
i
bw
, where i = 1, 2,... ,N
DC
Mb/s Network bandwidth
t
init
, t
idle
, t
term
s Times of VM transitions
Service Placement placement ={every, n-closests, ...} Service placement policy
OBJECTIVES
Quality
of Service
RT
i
, where i = 1, 2,... ,N
ser
s Application response time
T P
i
, where i = 1, 2,... ,N
ser
req/s Application throughput
Costs Cost $ Total costs of infrastructure
sian distribution, where each request is separated in
time by Log-Normal distributed delay D
req
in sec-
onds. The size of each request is given by S
req
KB
and is drawn from a Pareto distribution.
Resource Requirements
To model application resource requirements we pro-
pose a linear model specifying the needed amount
of resources, both for an idle service and per pro-
cessing each request. An idle service uses CPU
idle
CPU operations, mem
idle
amount of memory, and
disk
idle
amount of storage. Additionally for each pro-
cessed request, the service uses CPU
req
CPU opera-
tions, mem
req
amount of memory, and disk
req
amount
of storage. The amount of user’s state data created
by each request is defined by state and expressed in
absolute value or percentage of request size S
req
.
Mobility
The network is populated by N
MD
MDs, each sub-
scribing to a subset of the N
ser
available services. The
2-dimensional, multi modal, mobility model detailed
in (Bettstetter, 2001) provides us with an on-average
uniform distribution of users, with movement propor-
tional to the duration of a session and the scale of the
mobile network. The aforementioned model defines
the properties of an MD’s movement. A MD’s mo-
mentary movement is defined by its velocity consti-
tuted by the current speed s and current direction θ.
Changes in mobility are defined by multiple stochas-
tic processes that describe the duration of its state. An
entity’s speed s is independent of direction θ and is
maintained for T
s
seconds, after which acceleration a
between a
min
and a
max
is applied for time T
a
, until it
reaches s
min
or s
max
. Furthermore, direction θ is main-
tained for time T
θ
until the next change-event where
CLOSER2015-5thInternationalConferenceonCloudComputingandServicesScience
604
the direction θ is altered for T
ω
seconds with at the
rate of ω radians per second. T
s
, T
a
, T
θ
, and T
ω
, de-
scribing the timing of each change-event, are set for
each mobility mode, and are each defined by a proba-
bility distribution bounded by a maxima and minima.
6.2 Setup Model
The second group of parameters in Table 2 charac-
terises the network and DCs.
Network
In our model, the core network introduces a cumu-
lative propagation, switching, and routing delay and
it is modelled with a Weibull delay D
net
in multiples
of the number of network nodes between the source
and the destination (Papagiannaki et al., 2003). The
network distance between RBSs is equal to the cell di-
mension d
RBS
. The associated RBSs are equidistant to
their common DC, and are for the sake of simplicity
assumed to be separated by one network edge.
Furthermore, forthcoming cell planing practices
aim to increase area energy efficiency by favouring
smaller cells in urban areas (Shahab et al., 2013;
Fehske et al., 2009). Our model employs a small
homogeneous mobile network composed of N
RBS
equidistantly distributed RBSs.
In the absence of a specific mobile generation
standard, an MD is handed over between RBSs at the
geographic point where they cross the cell boundary
distinguishing two independent RBSs defined by the
width of the rectangular cells d
RBS
.
Data Centre
The DC model captures the influence that its capac-
ity has on performance and costs of computation, as
described in Section 4.
To capture the influence on performance, quan-
tity and quality of each DC resource is described.
DC consists of N
S
servers, that can differ in spec-
ification. Server contains N
CPU
CPUs capable of
executing s
CPU
operations in every second. Values
of memory and storage specify the total amount of
available memory and storage, respectively. The net-
work bandwidth is specified with network
bw
. The DC
model includes also a provisioning model, that de-
scribes how available resources are shared among sev-
eral applications, e.g., time-sharing or space-sharing.
A DC hosts services in VMs. A service can be
distributed over multiple VMs. Incoming workload
is load-balanced by either a method of round-robin,
random selection, or placed in the VM with the low-
est load. However, a user’s requests are always for-
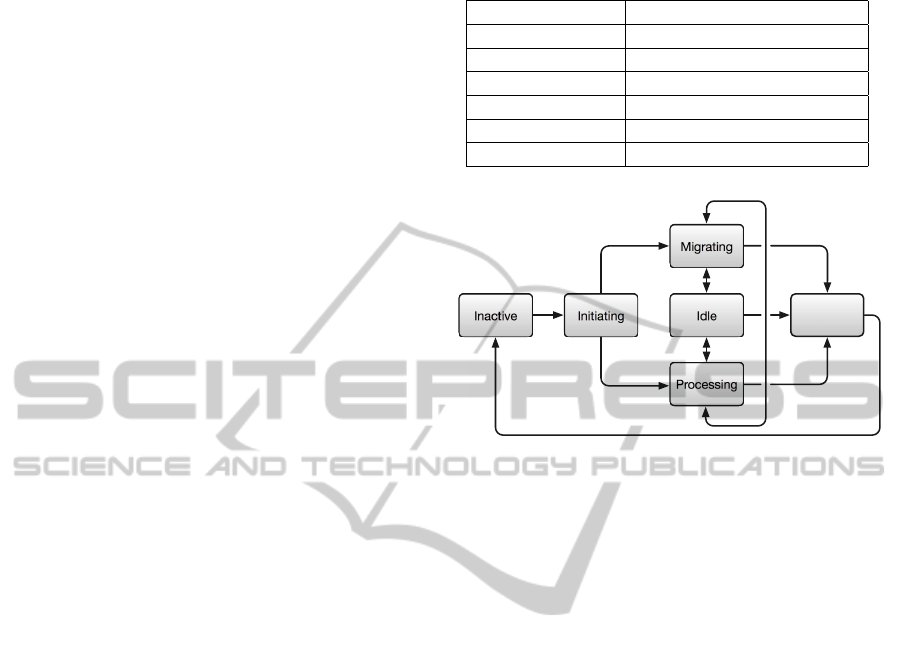
Table 3: States of Virtual Machine.
Name Description
INACTIVE VM is turned off.
INITIATING VM is booting up.
PROCESSING VM is serving requests.
IDLE VM is waiting for requests.
MIGRATING VM is transmitting data.
TERMINATING VM is shutting down.
Inactive Initiating Idle
Processing
Migrating
Terminating
Figure 4: Transitions between Virtual Machine states.
warded to the VM that served his first request. A ser-
vice can specify a minimum and maximum number of
VMs it requires. The DC scales the application within
these bounds based on the load-balancing outcome.
To emulate the life-cycle of a VM we have defined
six VM states as described in Table 3. The transitions
between the states are presented in Figure 4. At the
beginning all VMs are in INACTIVE state. A VM
is initiated when the first request arrives to a DC. It
takes t
init
seconds before VM is ready to start process-
ing requests or receiving migrated requests and user
state from other DC. We assume that a VM is not able
to process requests and handle migrations at the same
time, so it changes state between PROCESSING and
MIGRATION over the time. Moreover, we give mi-
grations a higher priority than processing, so process-
ing is paused if there are any migrations to perform.
When there are no requests to process and no migra-
tions to handle a VM goes into IDLE state. A VM
is terminated if IDLE state lasts for longer than t
idle
seconds, and the VM termination takes t
term
seconds.
Service Placement
Service placement policies define in what DC(s) a ser-
vice should be hosted, what number of replicas should
be running, and when a service should be migrated
between DCs. These decisions depend on the mo-
bility of users, the size of users’ state that has to be
migrated, and QoS requirements. For example, a ser-
vice can be hosted in n Proximal DCs closest to the
majority of its users (n-closests), or in the case of la-
TelcoClouds-ModellingandSimulation
605

tency sensitive services in every Proximal DC that is
needed to provide acceptable QoS (every).
6.3 Objectives Model
The third group of parameters in Table 2 describes
QoS and costs of the telco cloud.
Quality of Service
Combining the resource requirements model, which
describes the amount of resources an application
needs, with a DC model, allows to simulate how co-
location of different services in a DC influences their
response times RT
i
and throughputs T P
i
.
Costs
In our opinion the cost models available in the liter-
ature and described in Section 5.3 are very ”country
dependent”, because of the inclusion of variable pa-
rameters such as salaries, costs of energy or costs of
property. They are also not taking into account pa-
rameters important from the perspective of the telco
cloud, such as the size of DC. Therefore, we model
the costs of the telco cloud using a basic heuristic
based on observation that dispersion of infrastructure
causes additional costs, e.g.: increase of administrator
travel time between locations, and higher unit costs
of computation in proximal DCs because of smaller
scale and high initial costs.
Cost ∝
N
DC
∑
DC
N
S
(1)
As shown in Equation 1, the total cost of a telco
cloud is directly proportional to the number of DCs
and inversely proportional to the total number of
servers in all DCs. It means that distributing the same
number of servers among many DCs is more expen-
sive than placing them in a single DC.
6.4 Limitations
The proposed meta-model has several limitations.
The application model assumes that all requests gen-
erated by one application are homogeneous and that
each of them consumes the same amount of resources.
The mobile access network model does not take into
account the physical layer, channel provisioning, and
cell load balancing. Additionally, the radio access
network functions as a mechanism to associate MDs
with DCs propagation, and system processing delays
are thus not modelled.
7 SIMULATION SHOWCASE
We have implemented a coarse grained simulator us-
ing SimJava (Howell and McNab, 1998) as the under-
lying event-driven simulation framework. All mod-
ules are implemented from scratch but are based on
the meta-model presented in Section 6. The simula-
tor fully implements the proposed request generation
and network models, but has implemented more ab-
stract mobility, resource requirements, DC, and ser-
vice placement models.
To demonstrate the scope of the telco cloud meta-
model and the simulator we introduce an elementary
showcase scenario below. The scenario is designed
to reveal the basic relationship between workload –
MD mobility, setup – Proximal DC catchment, and
objectives – the aggregate utilisation of a telco cloud.
7.1 Experiments
For the sake of clarity we present a simplified sce-
nario. Only one service is considered and the size of
the simulation is reduced when compared to the de-
sired scale. The VM scalability and placement mod-
els are included as proof-of-concepts. The goal is
to obtain conclusions about the relation between MD
mobility and DC catchment, and avoid the interfer-
ence of other elements. The scenario is described in
detail below.
The telecommunication infrastructure is com-
posed of 16 RBSs, in a 4x4 layout. The cells are
tangent but not overlapping and are dimensioned as a
typical LTE micro-cell at 750 m, as detailed in (Sha-
hab et al., 2013). The number of DCs varies be-
tween the experiments and thus so, also the DC catch-
ment defined as the ratio between DCs and RBSs,
changes between (1:1) and (1:16). In abstract terms,
the (1:1) catchment represents a setup with one Prox-
imal DCs per RBS. In contrast, the (1:16) catchment
approaches a more traditional case of a Remote DC
serving all users in the domain.
To reveal the effects of DC catchment, all DCs are
of the same capacity. The number of VMs in each
DC is scaled proportionally to the number of users
they serve. The DC in the (1:16) catchment scenario
has 16 VMs, while the DC in the (1:1) scenario has
just one VM. The workload is balanced among avail-
able VMs, and new sessions are forwarded to the least
loaded VM. To reveal the full extent of the effect of
user mobility, user states and requests are strictly mi-
grated to the geographically nearest DC.
We use a request generation model with a ses-
sion arrival rate of λ
ses
described by a Log-Normal
distribution with the parameters µ = 3 and σ = 1.1.
CLOSER2015-5thInternationalConferenceonCloudComputingandServicesScience
606
The number of requests per session N
req
is taken from
an inverse Gaussian distribution with the parameters
λ = 5 and µ = 3. Inter-request time is D
req
seconds
and is modelled with with an exponential distribution
with λ = 0.1. The simulation domain is populated by
480 MDs, all subscribing to the same service. Due
to the size and simplicity of the network topology in
the scenario, we are deploying a Markov-based mo-
bility model. The mobility model is based on a car
and is as specified in Section 6.1, with parameters
from (Bettstetter, 2001). To allow the mobility and
workload models to jointly reach a steady state, the
simulation is run for 8 simulated hours. This results
in an average processing load of 30%, which gives
enough time for migrations to complete successfully.
The user state is proportional to the aggregate size
of that user’s sessions with the application it sub-
scribes to and is defined by a 5
th
order AR-process
with linearly decaying parameters. In our simulation,
initialisation of a VM takes t
init
= 81s, similarly as for
m1.small VM type in Amazon EC2 (Ostermann et al.,
2010). A VM is terminated if it remains in the IDLE
state longer than t
idle
which is equal to the mean inter-
session time. It takes t
term
= 21s to terminate a VM.
To investigate the influence of Proximal DC catch-
ment on the performance of the telco cloud we ob-
serve the life cycle of the VMs by recording the
amount of time they spend in each state. We run
two sets of experiments. In the first set, end users
are static. The second set introduces mobility.
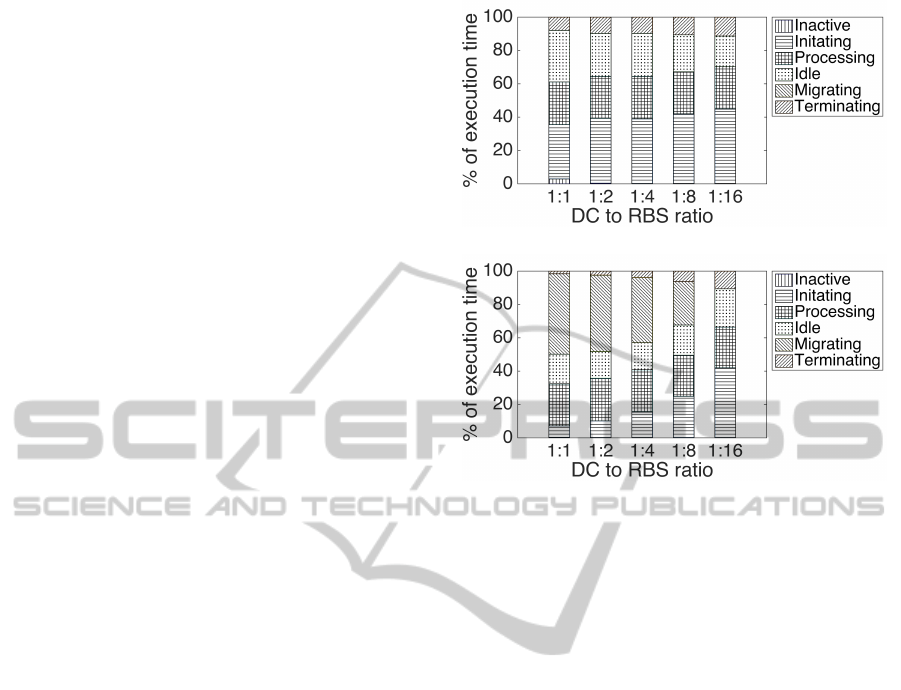
7.2 Results
Figure 5(a) shows the breakdown of the mean time
spent in each VM state in the system per DC catch-
ment. With a (1:1) DC catchment the utilisation suf-
fers from the proportion of time spent in IDLE state
due to the relatively low request arrival rate gener-
ated by one sixteenth of all users. The inefficiency
is caused by the time the system spends in the IDLE,
INITIATING, and TERMINATING states. The com-
position of time spent in these states changes with
DC catchment, and is a reflection of the number of
VMs in a DC and load-balancing effort. Reducing
the time spent on starting and terminating VMs would
free up more resources and perhaps also make the sys-
tem more reactive to sudden workload changes. The
management of VM scalability and placement in telco
clouds is clearly something that requires optimisation.
Figure 5(b) reveals the overhead of user mobility
and the migration effort it incurs. Depending on the
DC catchment, different migration dynamics come
into play. As migrations are more frequent in the (1:1)
case than in the (1:8) case, user states do not have the
(a) Static users
(b) Mobile users
Figure 5: DC catchment vs. time spent in each VM state.
time to grow as much between migrations in the for-
mer case. The migration effort is therefore not a fac-
tor eight lower in the (1:8) case versus the (1:1) case,
but rather, they spend 26% and 47% of their time in
the MIGRATING state, respectively. The system dy-
namics revealed by Figure 5(b), where at worst, 47%
of the execution time is spent migrating users, points
to the need to find scaling mechanisms for the telco
cloud that take into account mobility and inactivity,
so that resources can be freed dynamically for other
active applications. A policy of strictly migrating user
states and requests to the geographically closest DC,
irregardless of DC catchment, in order to obtain min-
imal propagation and communication latency, is sub-
optimal.
8 CONCLUSIONS
In this paper we present a way to combine existing
models of user mobility, mobile and core networks,
and DCs into a meta-model capable of capturing dy-
namics of the telco cloud. We also implement a pro-
totype simulator based on a simplified meta-model.
The meta-model can be used by telecommuni-
cation operators as well as equipment developers
to model existing infrastructures and to plan future
changes. Researchers can test algorithms for resource
management, e.g., migration of services between geo-
distributed DCs. Also developers can benefit from us-
TelcoClouds-ModellingandSimulation
607

ing the simulator to observe how their mobile appli-
cations behave in telco cloud environments.
Future work will be focused on enhancing the
functionality of the simulator to incorporate other pa-
rameters from the presented meta-model. Then, using
the simulator we would like to explore the following
telco cloud challenges: minimising the trade-offs be-
tween costs and performance of telco cloud depend-
ing on the DC placement and capacity, and optimal
placement and migration of services between DCs.
ACKNOWLEDGEMENTS
This work is funded by the Swedish Research Council
(VR) project Cloud Control and the European Union’s
Seventh Framework Programme under grant agree-
ment 610711 (CACTOS). Maria Kihl and William
T
¨
arneberg are members of the Lund Center for Con-
trol of Complex Engineering Systems (LCCC) funded
by the Swedish Research Council. Also, they are
members of the Excellence Center Link
¨
oping – Lund
in Information Technology (ELLIIT).
The authors thank Johan Eker (Ericsson Research)
who contributed with feedback during several dis-
cussions and Tania Lorido-Botran (University of the
Basque Country) for her critical comments on early
drafts of the paper.
REFERENCES
Ahmed, A. and Sabyasachi, A. S. (2014). Cloud computing
simulators: A detailed survey and future direction. In
2014 IEEE International Advance Computing Confer-
ence (IACC), pages 866–872. IEEE.
Armbrust, M., Fox, A., Griffith, R., Joseph, A. D., Katz,
R., Konwinski, A., Lee, G., Patterson, D., Rabkin, A.,
Stoica, I., et al. (2010). A view of cloud computing.
Communications of the ACM, 53(4):50–58.
Atzori, L., Iera, A., and Morabito, G. (2010). The internet
of things: A survey. Comp. net., 54(15):2787–2805.
Barker, S. K. and Shenoy, P. (2010). Empirical evaluation
of latency-sensitive application performance in the
cloud. In Proc. of the 1st annual ACM SIGMM con-
ference on Multimedia systems, pages 35–46. ACM.
Baroncelli, F., Martini, B., and Castoldi, P. (2010). Net-
work virtualization for cloud computing. Annals of
telecommunications, 65(11-12):713–721.
Bettstetter, C. (2001). Smooth is better than sharp: A ran-
dom mobility model for simulation of wireless net-
works. In Proc. of the 4th ACM Int. Workshop on Mod-
eling, Analysis and Simulation of Wireless and Mobile
Systems, MSWIM ’01, pages 19–27. ACM.
Bosch, P., Duminuco, A., Pianese, F., and Wood, T. L.
(2011). Telco clouds and virtual telco: Consolidation,
convergence, and beyond. In 2011 IFIP/IEEE Inter-
national Symposium on Integrated Network Manage-
ment (IM), pages 982–988. IEEE.
Calheiros, R., Ranjan, R., Beloglazov, A., De Rose, C., and
Buyya, R. (2011). CloudSim: a toolkit for modeling
and simulation of cloud computing environments and
evaluation of resource provisioning algorithms. Soft-
ware: Practice and Experience, 41(1):23–50.
Fehske, A., Richter, F., and Fettweis, G. (2009). Energy ef-
ficiency improvements through micro sites in cellular
mobile radio networks. In GLOBECOM Workshops,
2009 IEEE, pages 1–5.
Greenberg, A., Hamilton, J., Maltz, D. A., and Patel, P.
(2008). The cost of a cloud: Research problems in
data center networks. SIGCOMM Comput. Commun.
Rev., 39(1):68–73.
Howell, F. and McNab, R. (1998). Simjava: A discrete
event simulation library for java. Simulation Series,
30:51–56.
Kliazovich, D., Bouvry, P., and Khan, S. (2012). Green-
cloud: a packet-level simulator of energy-aware cloud
computing data centers. The Journal of Supercomput-
ing, 62(3):1263–1283.
Kovachev, D. (2012). Framework for computation offload-
ing in mobile cloud computing. Int. J. of Interactive
Multimedia and Artificial Intelligence, 1(7):6–15.
Mu
˜
noz, V. M., Kaci, M., Gadea, A., and Salt, J. (2011).
On the Economics of Huge Requirements of the Mass
Storage-A Case Study of the AGATA Project. In
CLOSER, pages 507–511.
Ostermann, S., Iosup, A., Yigitbasi, N., Prodan, R.,
Fahringer, T., and Epema, D. (2010). A performance
analysis of EC2 cloud computing services for scien-
tific computing. pages 115–131. Springer.
Papagiannaki, K., Moon, S., Fraleigh, C., Thiran, P., and
Diot, C. (2003). Measurement and analysis of single-
hop delay on an IP backbone network. IEEE J. on
Selected Areas in Communications, 21(6):908–921.
Patel, C. D. and Shah, A. J. (2005). Cost model for plan-
ning, development and operation of a data center.
Reyes-Lecuona, A., Gonz
´
alez-Parada, E., Casilari, E.,
Casasola, J., and Diaz-Estrella, A. (1999). A page-
oriented www traffic model for wireless system simu-
lations. In Proc. ITC, volume 16, pages 1271–1280.
Riley, G. F. and Henderson, T. R. (2010). The ns-3 net-
work simulator. In Modeling and Tools for Network
Simulation, pages 15–34. Springer.
Sakellari, G. and Loukas, G. (2013). A survey of mathemat-
ical models, simulation approaches and testbeds used
for research in cloud computing. Simulation Mod-
elling Practice and Theory, 39(0):92 – 103.
Shahab, S., Kiong, T., and Abdulkafi, A. (2013). A Frame-
work for Energy Efficiency Evaluation of LTE Net-
work in Urban, Suburban and Rural Areas. Australian
J. of Basic and Applied Sciences, 7(7):404–413.
Varga, A. et al. (2001). The OMNeT++ discrete event simu-
lation system. In Proceedings of the European simula-
tion multiconference (ESM’2001), volume 9, page 65.
Wang, A., Iyer, M., Dutta, R., Rouskas, G. N., and Baldine,
I. (2013). Network virtualization: Technologies, per-
CLOSER2015-5thInternationalConferenceonCloudComputingandServicesScience
608

spectives, and frontiers. Journal of Lightwave Tech-
nology, 31(4):523–537.
Wickremasinghe, B., Calheiros, R., and Buyya, R. (2010).
Cloudanalyst: A cloudsim-based visual modeller for
analysing cloud computing environments and applica-
tions. In 2010 24th IEEE International Conference on
Advanced Information Networking and Applications
(AINA), pages 446–452.
TelcoClouds-ModellingandSimulation
609
