
Reverse Engineering an IPhone Applications using Dynamic Analysis
Philippe Dugerdil and Roland Sako
Geneva School of Business Adminsitration, Univ. of Applied Sciences Westen Switzerland (HESSO),
7 route de Drize, CH-1227 Geneva, Switzerland
Keywords: Reverse Engineering, Mobile Application, Dynamic Analysis.
Abstract: Mobile applications are becoming very complex since business applications increasingly move to the
mobile. Hence the same problem of code maintenance and comprehension of poorly documented apps, as in
the desktop world, happen to the mobile today. One technique to help with code comprehension is to reverse
engineer the application. Specifically, we are interested in the functional structure of the app i.e. how the
classes that implement the use cases interact. Then we adapted, to the iPhone, the code analysis technique
we developed for the desktop applications. In this paper we present the reverse engineering process and tool
we used to reverse engineer the code of an iPhone app and show, in a case study, how these tools are used.
1 INTRODUCTION
According to several surveys, mobile business
applications are the trend of the day, although not all
surveys agree on the strength of the trend
(Appcelerator/IDC, 2013); (IDC, 2013); (Zend,
2013) (Wasserman, 2011). With the growing interest
in B2B and B2E mobile apps (IDC, 2013) mobile
development becomes mainstream (IBM, 2014)
(Hammond, 2013). Then the very same problems of
application maintenance and understanding arise as
in desktop applications. There are no reasons to
believe that mobile apps will be any easier to
maintain than desktop ones. In particular the lack of
documentation could even be higher, on average,
than on traditional desktop platform since these
applications are notoriously developed using agile
approaches such as Scrum which leaves a lot of
freedom to the developer as to what documentation
to produce. Then we decided to develop a mobile
version of our methodology for the reverse
engineering of applications. This is a complete set of
techniques and tools to analyze the functional
structure of an application (Dugerdil and Niculescu,
2014) to improve its understanding hence its
maintenance. Indeed it is known for a long time that
to “understand” a large software system, the
structural aspects of the system are more important
than any single algorithmic component (Tilley et al.,
1996). Since there are several views of software
architecture (Clements et al., 2002), each targeting a
particular purpose, we developed a new one
specifically targeted at software understanding. The
latter is what we call the functional structure of the
system (Dugerdil and Niculescu, 2014) i.e. the
structure of the components of the system that
implement the high level business function of the
software, together with their relationships. Our
approach rests on dynamic analysis techniques i.e.
the analysis of the execution trace of the program
corresponding to some scenario (use-case) relevant
to the business. One key problem in dynamic
analysis is to cope with the amount of data to
process. In fact, the execution trace file can contain
several hundreds of thousands of events. To cope
with this data volume, we developed a trace
segmentation technique (Dugerdil, 2007) that has
showed to be very efficient at analyzing the
interactions between the components of the system.
In this paper we first present our reverse engineering
framework for software system (Section 2). Then we
show the tools we developed specifically to adapt
our framework to the reverse engineering of
Objective-C applications on the iPhone (Section 3).
Next, in Section 4, we present a case study. Section
5 presents the related work and Section 6 concludes
the paper.
2 REVERSE ENGINEERING
The goal of our reverse engineering process is to
261
Dugerdil P. and Sako R..
Reverse Engineering an IPhone Applications using Dynamic Analysis.
DOI: 10.5220/0005498002610268
In Proceedings of the 10th International Conference on Software Engineering and Applications (ICSOFT-EA-2015), pages 261-268
ISBN: 978-989-758-114-4
Copyright
c
2015 SCITEPRESS (Science and Technology Publications, Lda.)
recover the functional structure of the program
((Dugerdil and Niculescu, 2014) i.e. to analyze what
classes or components support the high level
function of the application. The process starts with
the recovery of the use-cases of the system, if they
are not readily available from the documentation of
the app (which is generally the case), by watching
the users interacting with the system. We simply ask
the user to go through all the business-relevant
scenario and we take note of all the actions he does
with the app. (In the case of legacy desktop
applications we even video-record the actions of the
user. But this is not required here because the use-
cases for mobile apps are usually much simpler).
Starting from the use cases allows us to concentrate
on scenarios of business value. Next we instrument
the source code of the program to be able to generate
the execution traces (i.e. the sequence of method
calls in a given run of the system). Code
instrumentation consists of inserting extra statements
in the source code to record events when the
methods are executed. An event is generated when
the method is entered and exited. Next the system is
run according to the use-cases and the corresponding
execution trace is recorded. Finally, an off-line
analysis of the execution trace is performed to
recover the functional structure of the system using
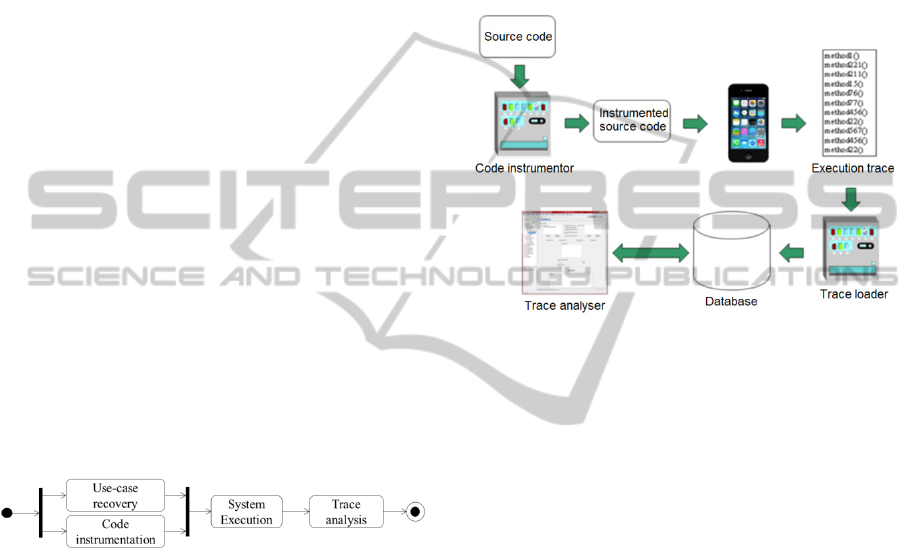
many views. Figure 1 illustrates a simplified version
of the reverse engineering process with only the key
tasks.
Figure 1: Reverse Engineering process.
This process has been implemented using a set of
tools that are presented in Figure 2. To instrument
the source code, many variants exist among which:
• developing an instrumentor for the programing
language of the system;
• leveraging an AOP environment to inject the
“instrumentation aspects” into the code.
Depending on the programming language
considered, the second option may not be available.
For Objective-C it is indeed the case and we
developed our own code instrumentor that will be
detailed in the next section. Once the code has been
instrumented it is compiled and shipped onto the
iPhone. Then the app is run according to the use-
cases and the execution trace is recorded in a file on
the device. Next, the file is downloaded from the
device and uploaded into a trace database using a
trace loader which performs a few integrity checks.
Finally, the trace is analyzed using our trace analysis
tools. The latter is able to present the information
from the trace using several views. Since Objective-
C does not have any package construct, the
identification of the events uses only the class name.
There are two formats for the events to be recorded
in the execution trace. The first is for method entry
and the second for method exit. By recording these
two kinds of events, we can reconstruct the call
graph with the call hierarchy.
Figure 2: Tools workflow.
The syntax of the events is the following:
[SCI] [DCI] ’[‘ [TN] ’]’ [Sign] ’AS’ [Type] ‘[‘ [TS] ‘]’ [Param]
Or
‘END’ [SCI] [DCI] ’[‘ [TN] ’]’ [Sign] ’AS’ [Type] ‘[‘ [TS] ‘]’
With :
[SCI] : Static class identifier : the class in which
the executed method is implemented.
[DCI] : Dynamic class identifier : the class of the
instance that executed the method.
[TN] : Thread number.
[Sign] : Method signature.
[Type] : Type of the element returned by the
method.
[TS] : Time stamp of the event
[Param]: List of the comma-separated values for
the primitive-typed parameters of the
method. Non primitive-typed values are
replaced by ‘_’.
The first event represents the entry into a method
and the second, headed by the keyword ‘END’,
indicates the exit from the method. The thread
number allows us to gather all the events that belong
to the same thread for further analysis.
ICSOFT-EA2015-10thInternationalConferenceonSoftwareEngineeringandApplications
262

3 APP INSTRUMENTATION
Dynamic analysis as opposed to static analysis aims
at observing the application’s behavior while it is
running. Although many techniques can be used
(Hamou-Lhadj and Lethbridge, 2004) we decided to
use code instrumentation because, on the mobile
device, there are not many alternatives. Indeed one
cannot install any profiling or debugging
environment without deeply impacting the behavior
of the code. The least intrusive technique is simply
to add lightweight tracing statements in the
application source code to write the events in a flat
file. Each of the recorded events must contain the
signature of the method called. As for the class
identifier we record the name of the class and, in
case of the languages using module or package
declarations, the package or module in which the
class is defined. Once the trace file is generated (that
could contain millions of events), it is loaded into a
database for further processing. Many of the existing
dynamic techniques focus on the monitoring of the
low level instructions of the program, in particular
when the purpose is to analyze an app for which
only the compiled code is available. Since we wish
to reverse engineer the functional structure of the
app, access to the source code is a must.
The first step to build our own instrumentor for
Objective-C is to be able to parse the source code.
To build such a parser, several possibilities exist.
Tools like JavaCC (JavaCC, 2014) YaCC (YaCC,
2014) or ANTLR (ANTLR, 2014) are capable of
generating a parser given the syntax definition of the
programming language in the EBNF format. Such
parser is completed by adding some extra parsing
instructions in the target language. The main
difference between these tools is the language in
which the parser is generated. Our choice was
JavaCC which generates a parser in Java. This is
because JavaCC -encoded grammars are available
for several programming languages, including
Objective-C, and also because we had some
previous successful experience with it. However we
do not only need to parse the code, we also need to
build an abstract syntax tree (AST) of the code in
memory so that we could add the extra trace event
generation code to some of the nodes in the AST.
We used the Java Tree Builder (JTB, 2014) to
produce the AST. Some Visitor (Gamma et al.,
1995) classes are generated by the same tool to visit
each node of the AST. We use the “Visitor” classes
to add the instrumentation instructions at the proper
locations in the code: as the first statement of each
method and right before each of the methods’ exit
statements. The output of the parser generation
process is represented by two packages named
syntaxtree and visitor which respectively
contain the AST elements and their associated
“visitors”. Because every single abstract syntax tree
element comes with its own “Visitor” class, we
focused on the ones responsible for the handling of
methods. The added instructions in the source code
must satisfy two conditions:
1 Do not produce any changes to the application
semantics;
2 Limit as much as possible the impact on the
application processing time.
The first constraint is self-evident. The second
condition aims at avoiding any impact on the
scheduling of multi-threaded applications. To be
able to record the events during the execution of the
app, we need to build a little runtime program, called
HEGTrace, to write the events to a flat file. Then the
instructions we insert into the source code of the
methods are simple calls to the function of
HEGTrace. The latter contains:
• A class with two methods to write an event at
the entry and at the exit of the instrumented
method.
• A class responsible for converting the
primitive-typed values of the parameters into
NSString, to write these values in the trace
event (see the [Param] element of the trace
event grammar).
Every iOS application has its own set of directories
in which it can read and write files. An application’s
private file system is called a Sandbox (Apple iOS,
2014) and it is specific to the application. Inside a
sandbox, there are three predefined directories:
Documents, Library and tmp
. To store a trace
file, the HEGTrace program can write in either the
Library or Documents directory. But we should
avoid tmp, since its content may be cleared away by
the system when the application stops running.
Because these folders generally contain user-
generated content and other resources used by the
application’s logic, we need to make sure the trace
files we write will not interfere with the existing
files. To do so, we create the trace files in a custom
folder inside the Library folder:
<Application_Home>/Library/HEG_TRACE/trace_[timestamp].
This will not only ensure that our tool does not
hamper the application’s behavior but also allows
the running of our use-cases in sequence to get
several trace files all at once. Next, to upload the
trace file into the desktop machine for further
ReverseEngineeringanIPhoneApplicationsusingDynamicAnalysis
263
analysis we pull it out of the iPhone using iExplorer
(iExplorer, 2014) which gives access to the part of
the device’s file system where the applications
reside. A technique to shortcut the creation of the
trace file could have been to embed a socket
communication module in our HEGTrace program
to “pipe” all the data in real time to a listening
socket. However this would require a permanent
connection to server and this would not respect our
second constraint to have as little an impact on the
processing time as possible. Another alternative
technique to trace file writing could have been to
monitor the application execution using an
embarked version of a debugger such as GDB
(GDB, 2014). Unlike C++ or Java, the runtime of
Objective-C (Objective C, 2014) uses a specific
syntax to do message sending. A message sending is
a statement like [object1 foo:@”arg”]
meaning that object1 is sent a message whose
“selector” is foo: and whose argument is “arg”.
This syntax is converted to
objc_msgSend(object1,foo(“arg”))
by the Objective-C runtime. Then, using the
debugger, we would set a break on every
objc_msgSend to monitor the execution. As the
iOS devices use the ARM processor, fetching the
right registers could give access to all the methods’
execution context. But this technique would delay
the program execution at each message sending and
then would exaggeratedly slow down the whole
application, therefore not respecting the second
constraint. The chosen instrumentation technique
using our own instrumentor has the extra advantage
to be applicable to any programming language
provided that a LALR-analyzable grammar is
available. Hence the technique presented in this
paper can be extended to the Android platform
(Parada and de Brisolara, 2012) since it uses Java as
the programming language.
4 CASE STUDY
We chose to reverse engineer an app that is used to
search and display the acts and articles of the Swiss
Law recorded in the device. With our reverse
engineering technique we can quickly identify what
classes are involved in the delivery of a given
functionality and what are the dynamic caller-callee
relationships for the use-case. As an example, here is
the analysis of the classes involved in the use-case
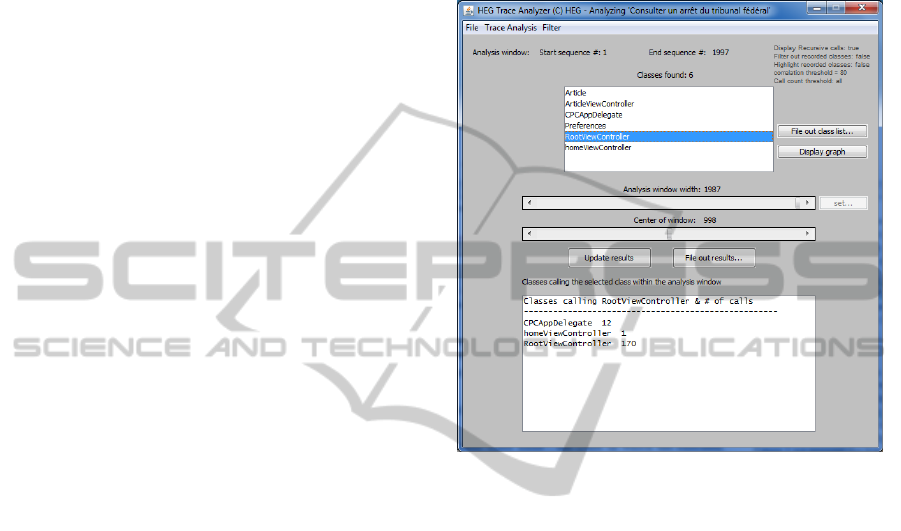
“Read a judgment of the Swiss Federal Court”. In
Figure 3 the trace analyzer tool displays the classes
involved in the use-case and specifically what class
calls what other class. As we can see in the display,
the class RootViewController is called by 3
other classes:
• CPCAppDelegate 12 times
• homeViewController only once
• RootViewController 170 times.
Figure 3: Trace analyzer.
Figure 4 displays the call graph with all the involved
classes. In this figure we can see that four classes are
coupled bi-directionally which, on the point of view
of program quality, could be something to
investigate further. But this is neither the case of the
ArticleViewController nor the
Preferences classes. The call graph is generated
by our tool using the Graphviz open source library
(Graphviz, 2015). Now we are interested to know
when, in the course of the execution, the classes are
involved. Then our trace analysis tool could display
a “time series” graph of the classes’ presence in the
trace. But the problem is that the trace is quite huge.
Then the display of each and every method in the
trace would lead to a very dense graph. To overcome
the problem we introduce a little bit of statistical
processing: we segment the trace in contiguous
segments of a predefined size and, for each segment,
we count the number of times a given class is called.
Therefore the size of the horizontal display is now
given by the number of segments in the trace which
is user-defined.
ICSOFT-EA2015-10thInternationalConferenceonSoftwareEngineeringandApplications
264
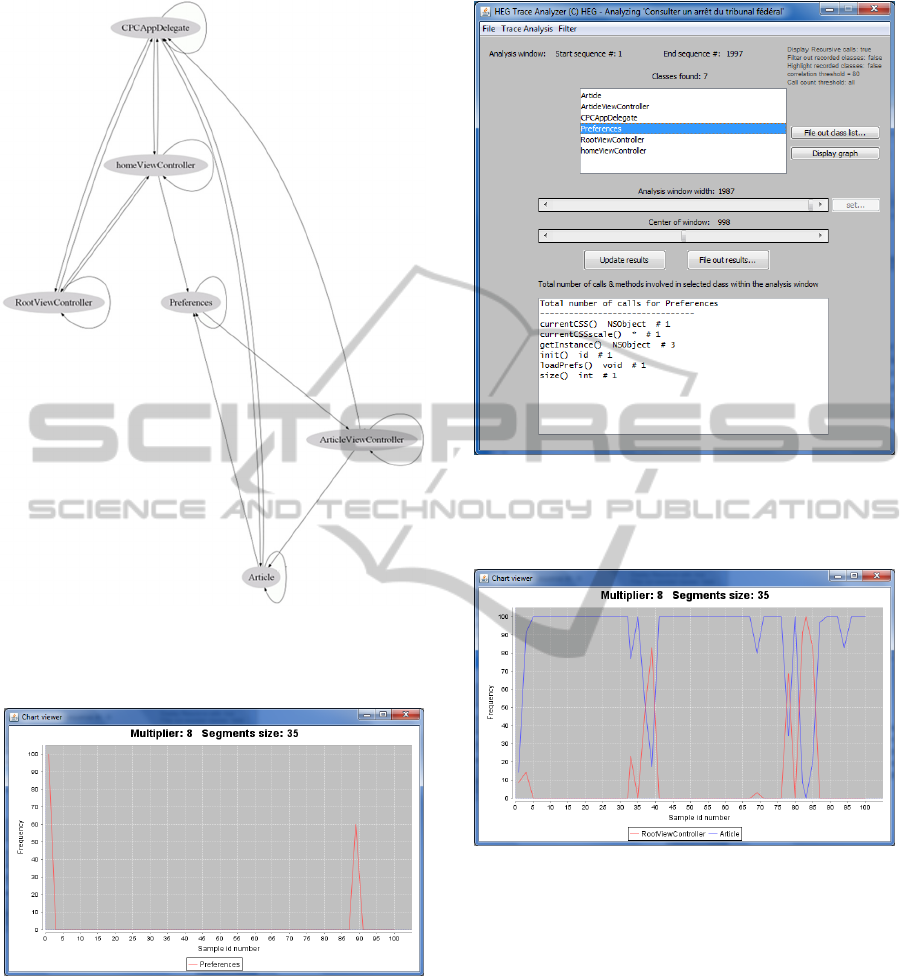
Figure 4: caller-callee graph.
Figure 5 presents such a time series graph for the
Preference class.
Figure 5: Preference class time series.
As we can see, the class is used at the beginning of
the processing and close to the end. Figure 6
displays the methods that are called in the
Preferences class. We observe that very few
calls are made in this class. Indeed this class holds
the application’s preferences parameters. All the
behavior, showed by Figure 5 and 6, rightfully
represents what we could expect from a class which
holds preferences information. Next, we could
compare the time series of two classes.
Figure 6: Methods called in Preference class.
Figure 7 shows the joint time series for the classes
RootViewController and Article.
Figure 7: Joint time series for 2 classes.
Interestingly, the involvement of these two classes
seems opposite. In the few segment where the
Article class is much less involved then the
RootViewController class is heavily involved.
A further source code investigation revealed that the
hundreds of Article objects (i.e. articles of the
law) to be loaded in memory from a file are loaded
all at once. Because this process is not in a dedicated
thread, it blocks everything else until it is
finished.The RootViewController contains a
UITableView and implements its delegate and
datasource protocols (Apple UITableView, 2014).
Because the structure of the law acts and articles is
hierarchical, a RootViewController is
reclusively created every time the user browses a
ReverseEngineeringanIPhoneApplicationsusingDynamicAnalysis
265
subcategory of the law acts and articles. Then the
relevant Article objects are accessed in memory,
inserted into the UITableView cells and the
RootViewController is quit. This explains the
sudden “bursts” of activity of the
RootViewController following the activity on
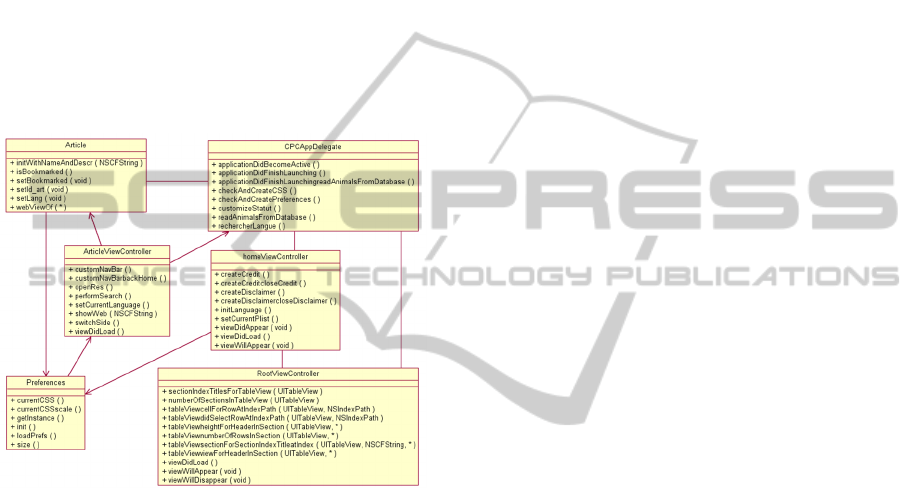
Article objects. With this information we can
now reconstruct the dynamic UML class diagram
corresponding to the executed use case (Figure 8).
This diagram represents the implementation classes
of the functional structure of the system in relation to
the use-case. It contains the classes, methods and
dynamic associations involved in the execution of
the use-case. In some sense this represents a
“projection” of the use-case to the whole system.
Figure 8: Class diagram of the functional structure.
Today, this UML class diagram is built by hand
from the output of the tool. We intend however to
integrate our tool with the software modeling
environment we use (IBM’s Rational Software
Architect) so that this class diagram could be created
automatically.
5 RELATED WORK
Dynamic analysis of iOS applications has been a
subject of interest for a few years. For example, it
has been used to check the security of the app when
its source code is unavailable and specifically to do
black-box penetration testing. However, when the
source code of the app is available, the tester
generally turns to static code review and white box
testing. Gianchandani (Gianchandani, 2014) uses
snoop-it (Snoop-it, 2014) to hook into a chosen
application’s process and to monitor network and
file system activities. He also uses Introspy
(Introspy, 2014) which is composed of a tracer
module and an analyzer module. After having
selected the API to trace, the tracer will log the
corresponding calls to a database. Next, the analyzer
will produce a human readable report in HTML.
However the tool does not target all the custom
application classes but focuses on the specific ones
related, but not limited to cryptography, data storage
and networking. Szydlowski M. et al (Szydlowski et
al., 2011) proposed a technique to performs
automatic dynamic analysis of iOS applications by
hooking to the application’s delegate and triggering
all of the UI controls on every view. The result is a
state model of the application. However, most of the
dynamic analysis methods operate on the low level
instructions. Hence, hooking to the running process
is needed. But Apple does not include any default
debugger on the device and installing one requires to
jailbreak the iPhone. An alternative consists of
running the application on the iOS Simulator (iOS
Simulator, 2014) that comes with XCode then
monitoring its process using GDB (GDB, 2014) or
LLDB (LLDB, 2014). But the dynamic analysis of a
simulated application using a debugger does not
provide as much information as is available when
writing the trace events to a file and analyzing the
file off-line. Indeed the latter method let us perform
statistical analysis which is difficult when using a
debugger. Moreover, working on a simulated device,
the technique does not allow analyzing apps that
involve sensors such as accelerometer, compass or
camera as they cannot be reproduced in the iOS
Simulator.
6 CONCLUSIONS
The contribution of this paper is to present a reverse-
engineering process and the associated tools to
reverse-engineer iPhone applications. Of course, the
technique is not limited to iPhone apps since the
core of the technique is to generate a trace file by
instrumenting the source code of the app. Then it is
applicable to whatever environment, provided that
we can build a source code instrumentor for the
associated programming language. In particular,
since we already developed an instrumentor for
Java, we are ready to analyze any Android
application. The trace analyzer we developed
provides a rich set of view through which the
maintenance engineer can study the running of the
code. In our simple case study, we observed that the
“time series” technique can visually present the
ICSOFT-EA2015-10thInternationalConferenceonSoftwareEngineeringandApplications
266

mutual behavior of the classes in a convenient
format. It provides some useful clues as to how
classes interact when running the use-cases. The
dynamic UML class diagram of the functional
structure of the use-case conveniently summarizes
all the programming elements involved in the
execution of the use-cases.
The drawback of our reverse-engineering technique
is that we are unsure to go through the all the
alternative paths in each of the scenarios since the
latter are recovered from the observation of the
users. For example, in the case of legacy desktop
applications, we investigated a semi-automated
technique to recover the use case from the legacy
code (Dugerdil, Sennhauser, 2013) with moderate
success however, due to the complexity of the task.
Indeed, use-case recovery from source code is still
an open problem. As future work we will integrate
our tool with IBM’s RSA to be able to generate the
dynamic UML class diagram automatically. We also
intend to develop new views to represent the
dynamic business-level application semantics.
Indeed we are building domain concept ontologies
whose concepts will be dynamically identified in the
executed code. This technique will help to close the
semantic gap between the high level business
domain concepts and the code level.
REFERENCES
ANTLR 2014. ANother Tool for Language Recognition.
http://www.antlr.org/ Accessed on Oct 12, 2014.
Apple iOS 2014. File System Programming Guide https://
developer.apple.com/library/mac/documentation/File
Management/Conceptual/FileSystemProgrammingGui
de/FileSystemOverview/FileSystemOverview.html.
[Accessed on Oct 12, 2014].
Appcelerator/IDC 2013. Mobile Developer report. www.
appcelerator.com.s3.amazonaws.com/pdf/developer-
survey-Q2-2013.pdf. [Accessed on March 5, 2015].
Apple UITableView 2014. UITableView Class Reference,
https://developer.apple.com/library/ios/documentation/
UIKit/Reference/UITableView_Class/. [Accessed on
Oct 12, 2014].
Clements P., Kazman R., Klein M. 2002. Evaluating
Software Architecture. Addison-Wesley.
Dugerdil Ph. 2007 - Using trace sampling techniques to
identify dynamic clusters of classes. IBM CAS
Software and Systems Engineering Symposium
(CASCON) October 2007.
Dugerdil Ph., Sennhauser D. 2013. Dynamic Decision
Tree for Legacy Use-Case Recovery. 28th ACM
Symposium On Applied Computing (SAC 2013)
Coimbra, Portugal, March 18-22, 2013.
Dugerdil Ph., Niculescu M. 2014. Visualizing Software
Structure Understandability. 23rd Australasian
Software Engineering Conference (ASWEC) 2014.
Sydney, 2014. IEEE Digital Library.
Gamma E., Helm R., Johnson R., Vlissides J. 1995 Design
Patterns. Elements of Reusable Object Oriented
Software. Addison-Wesley.
Gianchandani P. 2014. Damn Vulnerable iOS Application
(DVIA). http://damnvulnerableiosapp.com/#learn
[Accessed on Oct 12, 2014].
GDB. 2014. GNU Debugger http://www.gnu.org/software
/gdb/ [Accessed on Oct 12, 2014].
Graphviz 2015. http://www.graphviz.org/Home.php.
[Accessed on April 17, 2015].
Hammond J.S. 2013. Development Landscape: 2013,
Forrester Research.
Hamou-Lhadj A., Lethbridge T.C. 2004. A Survey of
Trace Exploration Tools and Techniques. Proc. of the
IBM Conference of the Centre for Advanced Studies
on Collaborative Research.
IBM 2014. IBM Mobile First initiative. www.03.
ibm.com/press/us/en/presskit/39172.wss. [Accessed on
Oct 12, 2014].
IDC 2013. IDC Predictions 2013 Competing on the 3rd
Platform. www.idc.com/getdoc.jsp?containerId=
WC20121129 [Accessed on March 5, 2015].
iExplorer 2014. http://www.macroplant.com/iexplorer/
[Accessed on Oct 12, 2014].
Introspy-iOS 2014. https://github.com/iSECPartners/Intro
spy-iOS. [Accessed on Oct 12, 2014].
iOS Simulator, 2014. https://developer.apple.com/library/
ios/documentation/IDEs/Conceptual/iOS_Simulator_
Guide/GettingStartedwithiOSStimulator/GettingStarte
dwithiOSStimulator.html. [Accessed on Oct 12, 2014].
JavaCC 2014. Java Compiler Compiler – The Java Parser
Generator. https://javacc.java.net/ [Accessed on Oct
12, 2014].
JTB 2014. Java TreeBuilder.http://compilers.cs.ucla.edu/
jtb/ [Accessed on Oct 12, 2014].
LLDB 2014. LLDB Debugger, http://lldb.llvm.org/.
[Accessed on Oct 12, 2014].
Objective C 2014. Runtime Reference. https://developer
.apple.com/library/mac/documentation/Cocoa/Referen
ce/ObjCRuntimeRef/Reference/reference.html.
[Accessed on Oct 12, 2014].
Parada A.G., de Brisolara L.B. 2012. A model driven
approach for An-droid applications development.
Proc. Brazilian Symposium on Computing System
Engineering (SBESC).
Snoop-it 2014. https://code.google.com/p/snoop-it/
[Accessed on Oct 12, 2014].
Szydlowski et al. 2011. Challenges for Dynamic Analysis
of iOS Applications. Proc. of the IFIP WG 11.4
international conference on Open Problems in
Network Security.
Tilley S.R., Santanu P., Smith D.B. 1996. Toward a
Framework for Program Understanding. Proc. IEEE
Int. Workshop on Program Comprehension.
Wasserman A.I. 2011. Software Engineering Issues for
Mobile Application Development. Proc. 2nd Workshop
ReverseEngineeringanIPhoneApplicationsusingDynamicAnalysis
267

on Software Engineering for Mobile Application
Development MobiCase'11.
YaCC 2014. Yet Another Compiler-Compiler. http://
dinosaur.compilertools.net/yacc/. [Accessed on Oct
12, 2014].
Zend 2013. Developer Pulse Survey - Second Quarter
2013. http://static.zend.com/topics/Zend-Developer-
Pulse-report-Q2-2013-0523-EN.pdf [Accessed on
March 5, 2015].
ICSOFT-EA2015-10thInternationalConferenceonSoftwareEngineeringandApplications
268
