
Experimental/FEM Optimization of Medium Voltage Rubber
Insulated Electric Cables Vulcanized with Steam Water
Differential Scanning Calorimetry (DSC) and Rheometer Experimental Results
Gabriele Milani
1
and Federico Milani
2
1
Technical University in Milan, Piazza Leonardo da Vinci 32, 20133, Milan, Italy
2
CHEM.CO Consultant, Via J.F.Kennedy 2, 45030, Occhiobello (RO), Italy
Keywords: Power Cables Production Lines, EPDM Elastomers, Peroxide Vulcanization, Steam Curing, DSC
Characterization, Experimental Rheometer Curves.
Abstract: The standard industrial process to produce medium voltage electric cables based on EPDM consists of
crosslinking by peroxides with high temperature steam (pressurized water vapor). Suboptimal material
crosslinking is usually due to a decrease of the temperature along the vulcanization pipe. Temperature
variations are connected to variations in steam pressure into pipe system. In the present paper a combined
numerical and experimental approach to optimize the production process of medium voltage rubber
insulated electric cables vulcanized with steam water is presented. The numerical part, discussed in an
accompanying paper, is based on the utilization of Finite Elements and an optimization Genetic Algorithm
(GA) approach. Here, attention is focused on the experimental investigation. In particular, the final
crosslinking degree is experimentally obtained by means of a DSC determination of non-decomposed
peroxide from the external layer to the core of the cable insulation. The final task is to minimize the
difference between numerically predicted and experimentally determined crosslinking degree using a steam
temperature profile along the pipe to explain the variations. A preliminary evaluation of kinetic reaction
constants of rubber cured with peroxides is here provided by means of a previously presented kinetic model.
1 INTRODUCTION
The continuous vulcanization process of cables has
been developed more than fifty years ago.
Nevertheless, the use of advanced mathematic
studies to predict polymer compounds performance
is not commonly applied, despite the fact it could
play an important role in industrial technical
development.
In the last few years, high voltage cables have
been produced by using ethylene propylene co- and
ter-polymers EPM/EPDM, Milani and Milani
(2008), due to their good dielectric strength, aging
resistance and partial discharges resistance. The
capability to set up and to tune the plant conditions
according to cable structure and compound
properties plays a critical role in cable production
and quality.
The industrial process of crosslinking, Roberts
and Verne (1984), of power cables is usually
obtained by means of horizontal (catenary
continuous vulcanization CCV) systems, Figure 1.
In Figure 1 the CCV plant considered in the present
paper is described.
Pressure, temperature and production speed
should be kept under severe control in order to
guarantee a designed crosslinking degree.
In order to prevent undesirable low level of
crosslinking of the cable, authors conducted an
experimental campaign crosslinking a medium
voltage electric cable in four different conditions.
Preliminary rheometer characterizations at
different temperatures and concentrations of the
curing agents were performed to find out the most
suitable crosslinking conditions. Several meters of
cured samples were produced in order to measure
the crosslinking degree. The level of crosslinking
was evaluated through differential scanning
calorimetry DSC, i.e. by the content of the unreacted
peroxides, on five different radial positions of the
cable, from the core to the external layer.
Experimental results of DSC analysis are reported in
the paper.
The determination of the unreacted quantity of
63
Milani G. and Milani F..
Experimental/FEM Optimization of Medium Voltage Rubber Insulated Electric Cables Vulcanized with Steam Water - Differential Scanning Calorimetry
(DSC) and Rheometer Experimental Results.
DOI: 10.5220/0005502900630068
In Proceedings of the 5th International Conference on Simulation and Modeling Methodologies, Technologies and Applications (SIMULTECH-2015),
pages 63-68
ISBN: 978-989-758-120-5
Copyright
c
2015 SCITEPRESS (Science and Technology Publications, Lda.)

peroxide is not evaluable by the well-known relation
between temperature and half time life of peroxide (
2/1
t
) because the curing agent used is a mixture of
peroxides. To overtake this limitation, authors
applied a recently proposed quite robust kinetic
model based on multiple rheometer characterization,
which has been integrated in the thermal analyses.
2 PEROXIDE CURING PROCESS,
KINETIC MODEL FOR
PEROXIDE MIXTURES
This section provides a numeric assessment of the
results obtained experimentally and a brief
description of the numeric model used to fit
experimental data. The model is based on the kinetic
of the reactions occurring in EPDM cured by
peroxide through the following steps:
Translation of chemical reactions into
mathematical differential equations (set of first
order ordinary differential equations, ODE
system);
Manipulation of the ODE system to reduce the
problem to a single nonlinear ODE;
Solving of the nonlinear equation through a
standard numeric tool;
Estimation of the kinetic constants entering into
the model by means of standard least squares
fitting of the experimental rheometer curves.
The basic chemistry of peroxide curing of EPDM
has been reviewed by van Duin and co-workers
(2002) and could be summarized by the following
partial reactions that occur in series and parallel:
1
ROOR RO R'
2
initiation
EP(D)M-H RO /R' EP(D)M ROH/R'H
H-abstraction
2EP(D)M EP(D)M-EP(D)M
(combination)
EP(D)M EP(D)M EP(D)M EP(D)M EP(D)M EP(D)M H
(addition)
(1)
Where the exact meaning of the symbols can be
found in e.g. Milani et al., 2014, where the reader is
referred to.
In the numeric model we adopted the kinetic
scheme for the peroxide crosslink reactions
summarized previously because it reproduces the
most important steps occurring during peroxide
curing and it is simple to handle.
It can be proved that polymer concentration (P)
vs time (t) can be estimated using xyz method after
suitable mathematical manipulation:
02
1
1
0212
2
2
2
o
ttK
PeIKK
dt
dP
PK
dt
dP
P
dt
Pd
(2)
Further details on equation derivation (2) could be
found in Milani et al., (2014).
The nonlinear differential equation (2) may be
solved numerically with a standard Runge-Kutta
algorithm to find concentration P(t).
The knowledge of P(t) allows the determination
of quantity R(t) and
*
P
(residual polimer after de-
vulcanization):
*
4
2
*
32
*
)()( PKPKtPtRK
dt
dP
(3)
Equation (3) is again solved using a Runge-Kutta
numeric approach.
The combined application of equation (2) and (3)
with least squares minimization allows to estimate
the kinetic constants entering into reaction scheme.
Figure 1: Real industrial production line considered.
=270 mm
2
m
extruder
P
=210 mm
slope 11°
slope 3°
1
3
t
o
t
a
l
l
e
n
g
t
h
5600 mm
t
o
t
a
l
l
e
n
g
t
h
o
f
t
h
e
l
i
n
e
:
1
0
3
m
Free surface water level
T
4
4
m
T
3
4
m
T
2
5
m
capstan
P: vapour pressure measure T evaluation
T
1
1
T , if not submerged normally 10-20°C less than T
21
T and T always submerged: from 70°C to 35°C
34
C
o
o
l
i
n
g
p
h
a
s
e
H
e
a
t
i
n
g
p
h
a
s
e
Suspended cable for 30-35 meters, then resting on the lower part of the tube
H
e
a
t
i
n
g
p
h
a
s
e
Water pool
diameter change
SIMULTECH2015-5thInternationalConferenceonSimulationandModelingMethodologies,Technologiesand
Applications
64

3 DETERMINATION OF
TEMPERATURE PROFILES IN
THE VULCANIZATION TUBE
A short overview of the mathematical basis of the
numeric approach employed for the determination of
cable temperature profiles under curing is reported.
The production line is supposed to be constituted by
a vulcanization pipe (with water steam at high
temperatures) followed by a water cooling phase (at
lower temperature) as reported in Figure 1.
Steam temperature adopted by manufacturers
usually depends on the peroxide employed for the
EPDM crosslinking. Linear speed of the cable
determines the exposition time at fixed pipe length.
At fixed exposition time and temperature
crosslinking degree of each layer can be numerically
estimated applying standard heat transmission
physical laws.
The analyses hereafter conducted refer to a real
CV line. Its basic scheme is sketched in Figure 1.
The head of the extruder is connected to the
vulcanization pipe. After extrusion, the cable passes
into a pipe containing water steam under pressure.
Finally the tube is connected with a submerged
equipment with cooling water. Linear speed of the
cable is controlled by the capstan at the end on the
line.
The CV pipe considered in this work is 103
meters long and exhibits an initial inclination of 11°
for approximately one third of its length. After this
zone, the pipe shows a slight residual slope of 3°.
Diameter of the pipe is initially equal to 270 mm and
reduced to 210 mm starting from one half of the
length.
Two meters after the head of the extruder is
located an analogic manometer used to measure the
steam pressure acting during the vulcanization
process. In the last 15 meters of the pipe, the cable is
cooled by a water-pool at 35-40°C. Also the capstan
is partially submerged. Considering as reference the
free surface of the water in the pool the depth of the
extruder head is equal to 5.6 meters. In the initial
part the cable is suspended inside the pipe, but after
30-35 meters it rests on the lower part of the
vulcanization device because of the combined action
of gravity and slope change, posing also doubts on
the effective symmetric crosslinking of the item
under such physical conditions. Since the cable
enters into the last portion of the line in
correspondence of the lower part of the pipe, it
immediately comes in contact with the cooling
water-pool. Water level has therefore to be checked
with particular care in order not to vary significantly
the length of heating zone.
Three thermometers are placed in the last 15
meters at a mutual distance of 5 meters and labeled
in Figure 1 as T
2
, T
3
and T
4
respectively.
Theoretically, T
2
should measure the same
temperature deduced from the pressure measure at
the beginning of the line (i.e. T
1
), but in practice this
never occurs, because T
2
is usually 10-20 °C lower
than T
1
near the surface of the water. This issue
depends intrinsically on the design of the plant and
partially on initial temperature imposed. In some
cases, it occurs that T
2
section is submerged
vanishing the temperature check at the end of the
heating phase. No thermometer probes are installed
in intermediate position from the begging to the end
of the heating phase. T
3
and T
4
thermometers have
the role to monitor the temperature of the water-
pool.
The experimental campaign has been conducted
under the following four different crosslinking
conditions:
Test #1: temperature T
1
=202°C, total curing time
t
c
=5.6 minutes;
Test #2: temperature T
1
=212°C, total curing time
t
c
=5.6 minutes;
Test #3: temperature T
1
=202°C, total curing time
t
c
=7.7 minutes;
Test #4: temperature T
1
=212°C, total curing time
t
c
=7.7 minutes.
Table 1: Experimental data set analyzed, EPDM
composition in grams.
Polymer
(Exxon)er Manufactur
35.3 100°C 4)+(1 MLMooney
0.9 % in wt. rnenevinylnorbo-VNB
76.2 % in wt. Ethylene
1703P VISTALON
100
Silane treated calcinated kaolin 55.5
Antioxidants 14.8
LDPE Riblene MR 10 MFI= 18.7
(ASTM D1238)
11.1
PE WAX 1.8
Peroxide mixture M3 1.1
4 EXPERIMENTAL
RHEOMETER CURVES AND
KINETIC MODEL
The polymer used is a commercial EPDM, with
properties furnished by the provider and summarized
Experimental/FEMOptimizationofMediumVoltageRubberInsulatedElectricCablesVulcanizedwithSteamWater-
DifferentialScanningCalorimetry(DSC)andRheometerExperimentalResults
65
in Table 1. The mixture (M3) of peroxides used as
curing agent is a composition of three different
peroxides: Trigonox T, Perkadox BC-FF and
Perkadox 14S. For the composition and use of the
mixture of peroxides M3 the reader is referred to
Milani and co-workers (2014).
The amount of peroxide, referred to 100 grams
of polymer, is variable. The chosen standard
concentration, labeled as “+/-0%”, is equal to 5.037
millimoles per 100 g of polymer. It was considered
as “reference” because this was the concentration
used in the standard industrial production of the
compound.
M3 +150% 160°C
-a
M3 +150% 180°C
-b
M3 +150% 200°C
-c
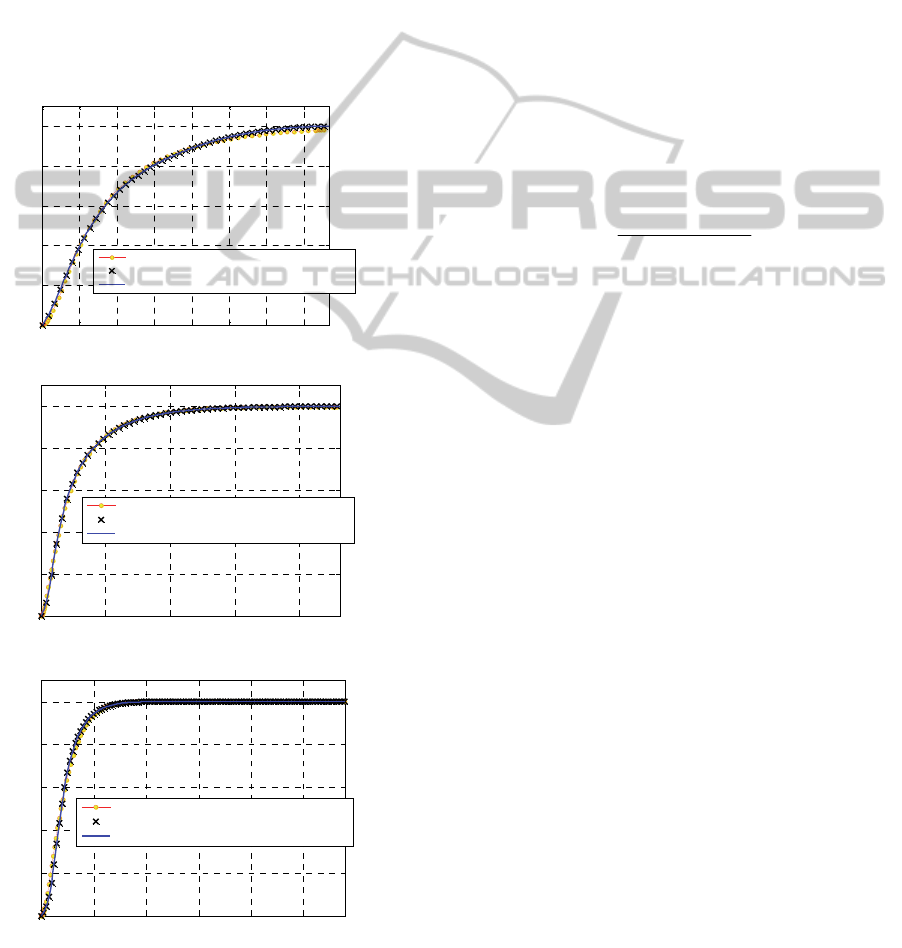
Figure 2: M3 curing agent. Comparison between
normalized experimental rheometer curve and numeric
model predictions. –a: 160°C. –b: 180°C. –c: 200°C.
Four additional concentrations were tested,
called -50%, +50%, +100% and +150%. Labels
indicate the molar concentration of the curing agent
with respect to the standard concentration. For
instance, a +50% concentration indicates that 1.5
moles with respect to the standard one were used.
Three different vulcanization temperatures where
inspected, typical for the curing of medium/high
voltage electric cables, namely 160°C, 180°C and
200°C.
DSC analysis are used to quantify the unreacted
crosslinking agents and Rheometer curves to obtain
an indirect information on the state of cure or cure
efficiency of the crosslinking agent, as extensively
demonstrated by Sun and Isayev (2009).
The average M(t) curves obtained may indeed be
used to calculate the evolution of the crosslinking
degree exp(t) using Sun and Isayev (2009) relation:
00
minmax
min
exp
TT
T
MM
MtM
t
(4)
where:
M
minT
is the minimum value of torque S’ during a
cure experiment at temperature T. Before
reaching this minimum value, exp is considered
equal to zero.
M
minT0
and M
maxT0
are the minimum and
maximum torque values, obtained for a cure
experiment at a temperature T
0
low enough to
allow neglecting reversion. In this way,
rheometer curves to fit always range between 0
and 1, with a maximum torque sensibly lower
than 1 for high vulcanization temperatures.
Experimental results rely into a thermal
characterization to determine the state of cure of
each sample conducted by means of a standard ODR
(oscillating disc rheometer), and mechanical
characterizations, in particular tear and tensile
strength tests.
5 THE NEW SIMPLIFIED
MECHANISTIC MODEL
PROPOSED
Experimental data exhibit a maximum torque close
to 55 dNm that lowers at low concentrations
(especially at -50%), whereas a concentration
increase results in a beneficial effect.
The absence of reversion (decrease of torque
after reaching the maximum) and the homogeneity
0 5 10 15 20 25 30 35
0
0.2
0.4
0.6
0.8
1
Time [min]
Normalized torque M
t
/M
tmax
Present model solution
Experimental data utilized to set numerical model
Full experimental data curve
0 5 10 15 20
0
0.2
0.4
0.6
0.8
1
Time [min]
Normalized torque M
t
/M
tmax
Present model solution
Experimental data utilized to set numerical model
Full experimental data curve
0 2 4 6 8 10
0
0.2
0.4
0.6
0.8
1
Time [m i n]
Normalized torque M
t
/M
tmax
Present model solution
Experimental data utilized to set numerical model
Full experimental data curve
SIMULTECH2015-5thInternationalConferenceonSimulationandModelingMethodologies,Technologiesand
Applications
66
M3
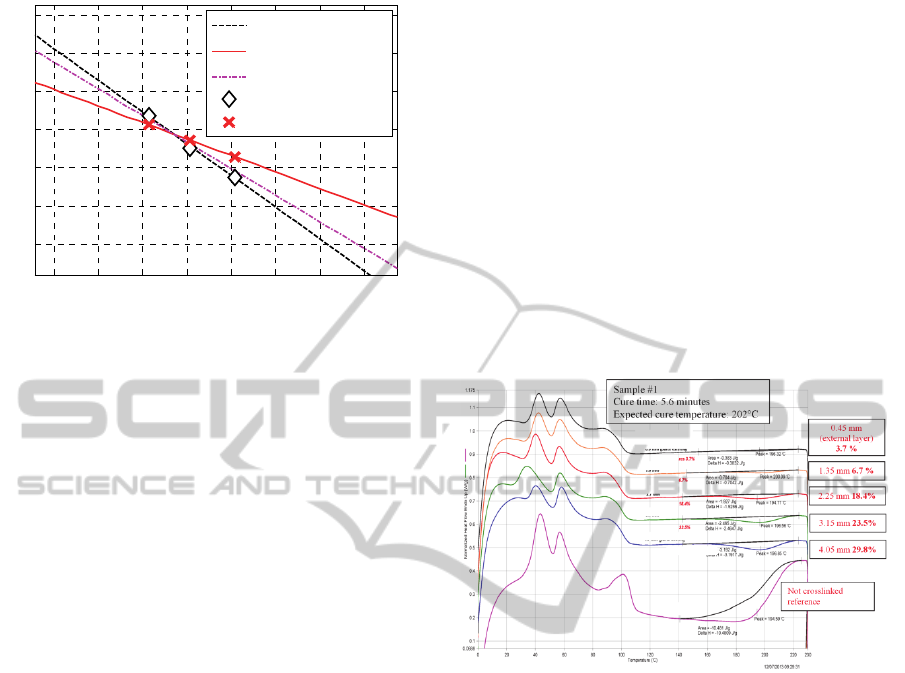
Figure 3: Linear regression interpolation of the kinetic
constants
1
K
and
2
K
provided by the single differential
equation model and the resultant linear regression
obtained as weighted sum of
1
K
and
2
K
of minimum and maximum values of the torque at
the three temperatures allow the normalization of the
analysis simply dividing each value of the torque by
the maximum torque, measure during the test. For
the cases where reversion is present, the reader is
referred to Milani (2013).
Experimental evidences show that maximum
crosslinking density could be obtained with at
double amount of peroxide in comparison to the
standard one (+100% concentrations).
Kinetic constants of the mixture M3 are
evaluated numerically with the kinetic model
previously discussed. Numerically predicted
rheometer curves resulting from the fitting process
are depicted and compared with experimental ones
in Figure 2 (-a: 160°C, -b: 180°C and –c: 200°C).
The numeric fitting overlaps almost perfectly the
experimental curves. Numeric curves were obtained
using a nonlinear least square procedure. As
extensively demonstrated in Milani and co-workers
(2014), the fitting of experimental response is rather
satisfactory by superposition of calculated curves
with experimental data.
Considering the numeric values obtained for the
two constants
1
K
and
2
K
at three distinct
temperatures (the other constants are close to zero,
indicating that no reversion is experienced), the lines
passing from such values in the Arrhenius plane was
plotted. In this space, the horizontal axis is
represented by the inverse of the absolute
temperature,
T/1 , whereas the vertical axis is
i
Klog
, where
i
K
is the ith kinetic constant. The
calculated lines are plotted in Figure 3.
6 DIFFERENTIAL SCANNING
CALORIMETRY (DSC)
The differential scanning calorimetry (DSC) has
become the most used thermal analyzing technique.
We have used this technique in order to quantify the
vulcanization degree and hence the unreacted
peroxide after the crosslinking process recovering
samples across the sample section.
Five samples were cut at 1 mm of distance along
the cross section (0.9 mm external surface, 1.8, 2.7,
3.6, 4.7 mm internal surface). The analyses were
carried out on 10-15 mg samples in the temperature
range from 0 to 230°C at the scanning rate of
20°C/min under inert atmosphere (N
2
) in punched
aluminum pans.
Figure 4: sample #1, DSCs on different positions from the
external layer compared with DSC of the not crosslinked
sample.
The residual unreacted peroxide has been
calculated in order to evaluate the crosslinking
degree according to the equation:
Res = H
r
/ H
0
(5)
where H
r
is referred to the peroxide in the sample
and H
0
to the peroxide in the not crosslinked
compound used as reference (100% of crosslinking
residue).
In Figure 4 the results of the DSC performed for
Sample #1 with the corresponding evaluation of the
unreacted peroxide concentration are represented. In
each figure six curves are reported. Five refer to the
different positions across the cable section whereas
the last one is the reference curve for the sample
before crosslinking. The representation refers to the
measured normalized heat flow plotted against
temperature.
1.9 2 2.1 2.2 2.3 2.4 2.5 2.6
x 10
-3
-3
-2
-1
0
1
2
3
1/T [K]
l
og
(
K
i)
K
1
=K
10
e
E
a
/R
g
T
K
2
=K
20
e
E
a
/R
g
T
1/3[2*log(K
1
)+log(K
2
)]
Numerical data K
1
Numerical data K
2
Experimental/FEMOptimizationofMediumVoltageRubberInsulatedElectricCablesVulcanizedwithSteamWater-
DifferentialScanningCalorimetry(DSC)andRheometerExperimentalResults
67

7 CONCLUSIONS
The experimental study on CV line crosslinked
EPDM allows drawing the following considerations:
1. Optimization of final mechanical properties
could be obtained with a detailed mechanical
characterization at different concentrations of the
curing agent;
2. A mixture of peroxides shows the interesting
feature to reduce the gap between tensile and tear
strength performances.
DSCs and classical rheometric curves are key tools
to double check the unreacted peroxide
concentration and the efficiency of the used curing
agent. In an accompanying paper (Milani and Milani
2015) a comprehensive numerical investigation
basing on the kinetic mathematical approach here
presented and coupled with Finite Element
computations will be presented and applied to the
experimental case study here discussed, assuming in
the numerical model a drop of the steam temperature
along the length of the pipe to minimize the error
between experimentally obtained data and
numerically predicted output.
Residual values of peroxide are collected in
Table 2 and Table 3, where the results of the DSC
experimental campaign are synoptically represented.
Table 2: experimentally determined quantity of unreacted
peroxide, test #2 and #4, temperature equal to 202°C.
Curing time Distance from the surface
0.9 mm 1.8 mm 2.7 mm 3.6 mm 4.7 mm
5.6 min (#1) 3.7 6.7 18.4 23.5 29.8
7.0 min (#3) 0 0 0 2.1 3.7
Table 3: experimentally determined quantity of unreacted
peroxide, test #2 and #4, temperature equal to 212°C.
Curing time Distance from the surface
0.9 mm 1.8 mm 2.7 mm 3.6 mm 4.7 mm
5.6 min ( #2) 0 0 0.9 3.6 11.4
7.7 min (#4) 0 0 0 0 0
REFERENCES
Ding R., Leonov I., J. Appl. Polym. Sci., 61, 455 -1986.
Isayev A.I., Deng J.S., Rubber chemistry and technology,
61(2), 340-361 -1988.
Milani G., Galanti A., Cardelli C., Milani F., Journal
Appl. Polym. Sci., 131(8) 2014, paper #40075. DOI:
10.1002/app.40075.
Milani G., Journal of Mathematical Chemistry, 51(8),
2038 -2013.
Milani G., Milani F., Computers and Chemical
Engineering, 32, 3198 – 2008.
Milani G., Milani F., Experimental/FEM optimization of
medium voltage rubber insulated electric cables
vulcanized with steam water. Numerical simulations
and inverse analyses. In Proc. 5
th
International
Conference on Simulation and Modeling
Methodologies, Technologies and Applications
SIMULTECH2015, Colmar, France, 21-23 July 2\015.
Roberts B. E., Verne S., Plastic and Rubber Processing
and Applications, 4(2), 135 – 1984.
Van Duin M., Kautsch. Gummi Kunstst., 55, 150 – 2002.
SIMULTECH2015-5thInternationalConferenceonSimulationandModelingMethodologies,Technologiesand
Applications
68
