
Salt Seller
Realization of a Business Game
Felix Kiechle, Corinna Uhr, Mario Schlereth, Yao Zhang, Leon O. Burkard
Andreas C. Sonnenbichler and Andreas Geyer-Schulz
Institute of Information Systems and Marketing, Karlsruhe Institute of Technology, Zirkel 2, Karlsruhe, Germany
Keywords:
Salt Seller, Business Games, Gaming Simulation, Simulators, Business Simulation, Browser, Multi-player.
Abstract:
This paper describes the realization and implementation of a business game named Salt Seller. Salt Seller was
first described by John Sterman in 2014 and implemented for the MIT Sloan School of Management. However,
Sterman only provided a high-level description of Salt Seller and no low-level details about the realization or
the market model were revealed. Our first aim is to fill this gap. As our second contribution introduces a
generalized n-person framework for round-based games which serves as an abstract game architecture and
encapsulates the round synchronization mechanisms. Utilizing this framework we provide a detailed view
on a possible model of the market mechanisms for Salt Seller. We describe all the market functions which
are needed to calculate the game outputs in each period. Our work aims to improve decision making in
management and to support teaching. To support this third goal we implemented the game using modern web
technologies allowing us to use the game in students’ lessons at the KIT. All input and output parameters of
every round are stored in a database for later analysis of the players’ behaviour. Generally, our implementation
demonstrates how general round-based multi-player games can be realized in a browser, our architecture
supports various other 2-player round-based games.
1 INTRODUCTION
Simulations are an essential tool to teach pilots, power
plant operators, managers and experts in complex de-
cision situations. Simulations are used to train regu-
lar work processes as well as emergencies: Landing a
plane during a storm can be best trained with the help
of realistic simulators.
Management simulations are used to train man-
agers, experts, and students to get a better understand-
ing of the effects of decisions in complex systems, e.g.
markets and supply chains. One of the earliest exam-
ples is the Beer Distribution Game (Forrester, 1961;
Jarmain, 1963; Sterman, 1989). It demonstrates the
dynamics of a supply chain and illustrates the bull-
whip effect. Simulators and games like the Beer Dis-
tribution Game or the Salt Seller Game are designed
to teach management principles, strategy, dynamics
and sustainability.
The most complex decisions managers have to
make are price decisions in competitive markets. The
Salt Seller is one of the most basic simulators to
understand the general dynamics of stable markets
(Sterman, 2014, p.90ff.). It reduces the dimensions
of competition in industry to pricing giving ”partic-
ipants the opportunity to set prices for a commodity
in an important industry“ (Sterman, 2014, p.92) and
to experience the effects of their decisions on market
shares and profits. The salt seller 2-person game re-
duces complexity by the following assumptions: Con-
stant marginal production costs, symmetric cost struc-
ture, an undifferentiated product and a stable mar-
ket with low rates of entries or exits, slow demand
growth, slow technological changes and few oppor-
tunities for cost reductions. In spite of these strong
assumptions, ”understanding the basic dynamics of
such markets is fundamental“ (Sterman, 2014, p.92).
In the Salt Seller game the players represent two
salt producers who have the same factors of produc-
tion and who face the same marginal costs. They pro-
duce salt of the same quality and each of them has
enough capacity to cover the whole salt demand of
the world market. The only factor the players can in-
fluence is the price per ton and round (period) they
sell their salt at. Depending on this price in relation
to the price of the opponent their market shares, sales
127
Kiechle F., Uhr C., Schlereth M., Zhang Y., O. Burkard L., C. Sonnenbichler A. and Geyer-Schulz A..
Salt Seller - Realization of a Business Game.
DOI: 10.5220/0005503501270135
In Proceedings of the 12th International Conference on e-Business (ICE-B-2015), pages 127-135
ISBN: 978-989-758-113-7
Copyright
c
2015 SCITEPRESS (Science and Technology Publications, Lda.)

and profits per round will be calculated. After a fixed
number of rounds the game ends and the player with
the highest total profit wins the game.
This paper is structured as follows: In section 2
the term business game is defined in relation to the
history of business games, other business games are
cited and related work is discussed. Section 3 gives a
brief review of the taxonomy of business games and
classifies Salt Seller. Section 4 introduces a general
framework for n-player round-based games. As ap-
plication of the general framework of section 4 we
describe in section 5 the Salt Sellers’ market model
which consists of parametrized market functions in
order to calculate the game’s outputs in each period.
The implementation which is presented in section 6 of
the market model functions and the multi-player ar-
chitecture has been done with the help of the Python
Web application framework Django (Django, 2015)
followed by an evaluation and a conclusion in section
7 and 8.
2 BUSINESS GAMES
A gaming simulation which can be traced back to a
Chinese war game Wei Qi (game of encirclement) as
far as 3000 BC consists of interactions among groups
of players (decision makers) placed in a predefined
setting and constrained by a set of rules and proce-
dures. In a gaming simulation a player fulfills a pre-
scribed role with a defined task in a particular realistic
situation (Hsu, 1989).
Business games (BGs) are games within a busi-
ness environment that can lead to one or both of
the following results: the training of players in busi-
ness skills (hard and/or soft) or the evaluation of
players’ performances (quantitatively and/or qualita-
tively) (Greco et al., 2013).
Triggered by the integration of developments in
war games, operations research, computer technol-
ogy and education theory, BGs arrived on the scene
in the late 1950s for example with development of the
American Management Association (AMA) decision
simulation game (Ricciardi and Marting, 1957). In
the following years games such as the Beer Distribu-
tion Game (Sterman, 1989; Jarmain, 1963; Forrester,
1961) or the Markstrat Simulation Game (Larr
´
ech
´
e
and Gatignon, 1977) were released and remained pop-
ular until today (Stratx Simulations, 2015). An ex-
haustive survey about the historical development of
the field of business games is presented by Wolfe
(Wolfe, 1993).
Today the field of business games is influenced
by current technology developments such as natu-
ral language and advanced graphics processing, new
business models like learning on demand and online
feedback mechanisms based on artificial intelligence
(Summers, 2004). BGs also serve as experimental en-
vironment for training artificial agents and for study-
ing deviations of human players from rationality. Fur-
thermore, BGs are used as incentives to make crowd
based online work (crowdsourcing) more attractive
and effective (Rokicki et al., 2014). They are imple-
mented by global enterprises like Google, Microsoft,
American Express, Caterpillar, etc. to train their em-
ployees and managers (Uskov and Sekar, 2014).
Since their inception the main purpose of BGs
has been to teach. Over the years BGs became very
popular in management education. Nowadays, al-
most every MBA program requires students to play
one or more management simulations, and BGs are
even more commonly applied at the undergraduate
level (Faria, 1998). In addition, role-playing in the
business context can improve soft-skills such as team
work, leadership, and practicing concepts and skills
used in strategic management, marketing, finance,
and project management.
3 GAME CLASSIFICATION OF
SALT SELLER
Eilon’s early taxonomy (Eilon, 1963) classifies BGs
according to design characteristics (computer/non-
computer, total enterprise/functional, ...) and ex-
pected use (management training, selling purpose, re-
search).
Other taxonomies focus on a specific aspect of a
game, such as the web technologies used in order to
provide distant education (Bernard, 2014) or the skills
that are mediated (product development, project man-
agement, logistic skills, risk management) (Riedel
and Hauge, 2011).
A complete taxonomy of BGs is presented by
Greco et al. (Greco et al., 2013) which combines and
extends previous work (Maier and Gr
¨
oßler, 2000;
Aarseth et al., 2003; Elverdam and Aarseth, 2007)
in this field. Greco et al. classify BGs along five
dimensions: application environment; elements of
the user interface; target groups, goals, and feed-
back; user relation; and model. Each dimension is
described by an enumeration of characteristics and
sub-characteristics. One game can be categorized
by a subset of characteristics. Below, Salt Seller is
classified according to this taxonomy.
Application Environment. Salt Seller is a stand-
alone simulation which means it is currently not
ICE-B2015-InternationalConferenceone-Business
128

integrated into any learning environment such as an
undergraduate teaching course. However, its modular
implementation and high configurability facilitate an
integration in the future. Salt Seller is played over
a computer network (LAN, Internet) on the HTTP
stack.
Elements of User Interface (UI). The user interface
of Salt Seller is browser based and includes texts and
charts. Gaming results and the complete decision
making process are stored in a database for further
investigation. The game behaves like a black box
since the user is not supposed to have detailed
information about the market mechanisms (= the
simulation model and the choice of parameters).
The game is round-based in contrast to e.g. a flight
simulator where interventions within the simulation
are almost continuous. Each round (period), the
players take quantitative decisions (price for salt).
Every player must enter his or her decision for the
next period independent from each other within a
certain time. The time frame to take a decision
is synchronized between all parties which means
the players act simultaneously. If one party does
not respond within the time frame the game will
be terminated so all parties have the same time to
reflect and take a decision. In contrast to alternating
rounds, e.g. chess, where one player decides after
the other, decisions in the Salt Seller game are made
simultaneously. Furthermore, since a timer counts
down the remaining time to submit a price, haste is
present; real time can alter the game state and remove
one player from the game if he takes too much time
for his decision.
Target Groups, Goals and Feedback. The goal
of Salt Seller is to achieve a higher total profit than
the opponent and to develop an understanding for
the behaviour of a duopoly market. The goal is not
absolute (fixed score on a scale) but relative to the
opponent. It is easy to explain and thus the game is
not restricted to a special target group as for example
economy students. Salt Seller is supposed to be a
teaching game and can also be used in research in
order to analyse the strategies of the players. Target
audience are undergraduate students or bright pupils
with minor economic prior knowledge. So far it
provides only basic feedback mechanisms like input
validation or status messages. Debriefing is not
provided either.
User Relation. In this implementation Salt Seller is
a two player game and teams are not supported. The
users are evaluated individually. Interaction between
the users is indirect since they submit their price
decisions independently from each other. There are
no means of direct interactions, e.g. an integrated
communication channel. Salt Seller has not the
character of a role-playing game, where users take
roles and interact socially with each other. Alliances
do not exist in competitive two-person games. There
is neither a players’ nor a developers’ community
(like a Facebook page, mailing list etc.). It is open
to the game moderator respectively the intention of
the game session in question whether communication
between the players is prohibited or not.
Model. The domain of Salt Seller is realistic in con-
trast to a fantasy game or a game which plays in
the past or in the future. All parts of the game be-
have deterministically even though some components
as the total salt demand could be modelled stochasti-
cally/randomly in the future (see section 8). The game
is not influenced by external data such as exchange or
inflation rates. It is highly configurable since all mar-
ket functions of the model are parametrized and can
be adjusted (see section 5).
4 GENERAL FRAMEWORK FOR
n-player ROUND-BASED
GAMES
In this section we introduce a general framework for
n-player round-based games by utilizing inputs, out-
puts, fixed parameters, result functions, an objective
function, and a stop condition. We will apply the Salt
Seller game to this framework in section 5.
We define a n-player round-based game through
the 6-tuple (In
t
,P,F ,Out
t
,ob j
t
,sc) with t ∈ T repre-
sents one round of all rounds T . We call a round also
turn or period.
• In
t
is a vector of inputs in turn t. E.g., in Salt
Seller the prices the two players choose for their
offer.
• P is a set of fixed parameters (constants), e.g. a
pre-defined number of rounds.
• F is a set of result functions transforming the state
from turn t to t + 1. We provide examples for the
Salt Seller game in section 5.
• Out
t
is a vector of outputs of turn t calculated by
inputs In
t
, parameters P, and the result functions
F .
• ob j
t
is an objective function weighting the outputs
related to the target of the game. In Salt Seller the
objective function is the cumulative profit over all
turns.
SaltSeller-RealizationofaBusinessGame
129

• sc is a stop condition. If the condition is met, the
game ends. In Salt Seller the stop condition is a
pre-defined number of turns.
Please note that in many games the players do not
receive complete information about all game describ-
ing variables. Additionally, P, F , and sc can be gen-
eralized and defined dependent on t as well, e.g. in
Skat F is defined differently when playing “Null”.
Furthermore, all tuple parts could also been made de-
pendent on the number of players n.
In each round, n players or a random number gen-
erator or a stochastic distribution submit l = |In
t
| in-
put values which results in the input matrix In
t
. We
assume l constant in t. Thus, In
t
is of the dimension
l × n. The domain of In
t
has to be chosen depend-
ing on the game, generally, R can be a good choice.
The output Out
t
is a matrix of the dimension k × n,
k = |Out
t
| is the number of outputs for n players, again
k is assumed constant in t. Like In
t
the domain of Out
t
is game-dependent.
The state transformation functions F are used to
calculate the outputs of a round t. Each f ∈ F is de-
fined as f : In
t
× P → Out
t
.
The result of the entire game for each player
i is defined with the (linear) objective function
ob j
t
: (Out
t
× W ) → R. W is a weighting vector of
dimension k.
It is:
ob j
t
=
t
∑
s=1
k
∑
j=1
w
j
∗ Out
s
ji
, for 1 ≤ i ≤ n, w
j
∈ W (1)
5 SALT SELLER GAME MODEL
This section describes our game and market model
of Salt Seller. It explains how the game’s outputs
of each round are calculated from its inputs. The
model consists of three parametrized functions which
are described further in the following three subsec-
tions. Subsection 5.5 shows how these functions work
together in order to calculate the outputs of a game
period.
5.1 Formal Game Model
Following the general game framework from section
4 we define Salt Seller as:
• In
t
= {price
1
t
, price
2
t
}
being two turn-dependent prices for players 1 and
2.
• P = {maxrounds,MC, SI,ZR,ZDP,ZDPr,MaxD}
MC being the marginal costs, SI sensitivity index,
ZR zero rate, ZDP zero delay percentage, ZDPr
zero demand price, MaxD maximal demand. All
parameters are covered in the next subsections.
• F is a set of 4 market functions: Market share
(equation 5), Sales (equation 6), Profit (equation
7), and total salt demand (equation 4). We refer to
the next subsections.
• Out
t
= {market share, sales, profit, total salt de-
mand};
• ob j
t
=
∑
t
s=1
∑
k
j=1
(w
j
∗ out
s
ji
), for i ∈ {1, 2};
with the weighting factor W = (0,0,1,0) since
only the output profit is maximized in Salt Seller’s
objective function. The objective function calcu-
lates the cumulative profit over all so-far player
periods for a player i.
• sc : t > maxrounds
The stop condition checks whether the current
round t is greater than the pre-defined number of
rounds maxrounds.
5.2 Market-Price-Sensitivity
This class of functions describes the market’s sensi-
tivity towards price differences between the two com-
petitors. It thus provides a mapping between the
price-ratio
p
1
p
2
or
p
2
p
1
and the market share of the first
or the second player. Please note, we omit the in-
dex t for the sake of readability, however, all prices
and ms (see below) are set per turn. In our model,
the market share is defined as the continuous function
ms: [1, ∞) → [0, 1].
ms(x) =
1
2
− zc
ms
∗ (x − 1)
1
/(2∗SI−1)
, 1 ≤ x ≤ ZR
0, x > ZR.
(2)
In this function, x is the price ratio of the higher
price divided by the lower price ( =⇒ x ≥ 1) and
ms(x) is the market share of the competitor with the
higher price. The zero coefficient zc and the Sensitiv-
ity Index SI are explained below. The market share
of the competitor with the lower price is calculated as
1 − ms(x). We denote the market share of player i by
ms
i
.
For the salt seller game Sterman (Sterman, 2014,
p.100) describes market-price-sensitivity as ”sensitiv-
ity of product attractiveness to price“. This corre-
sponds to the standard economic concept of the price
elasticity of demand. For the general problems of
measuring the price elasticity of demand we refer
to (Wilson, 1997). One approach is by experimen-
tal markets, see e.g. for scientific information (Neu-
mann, 2007). Function 2 is a simple approximation
of the price elasticity of demand.
ICE-B2015-InternationalConferenceone-Business
130
The rationale behind the function ms is the
following: At equal prices (x = 1) the market shares
are equal. We assume that a price ratio exists at which
all customers buy from one player only. We call this
the Zero Rate (ZR). The simplest price elasticity
of demand function is linear. In order to provide a
family of price elasticity of demand functions we
chose power functions, parameterized by the second
parameter SI. SI defines the speed of convergence.
For SI = 1 the function reduces to a linear function.
Sensitivity Index (SI). This parameter defines the
average sensitivity of salt customers towards price
differences between the two salt producers. It is
chosen from N. The higher the value of SI, the higher
the customers’ awareness for price differences. A
high value of SI thus signifies, that even small price
differences will lead to a huge gain of market share
for the price leader in the current period. At SI = 1,
ms is a linear function.
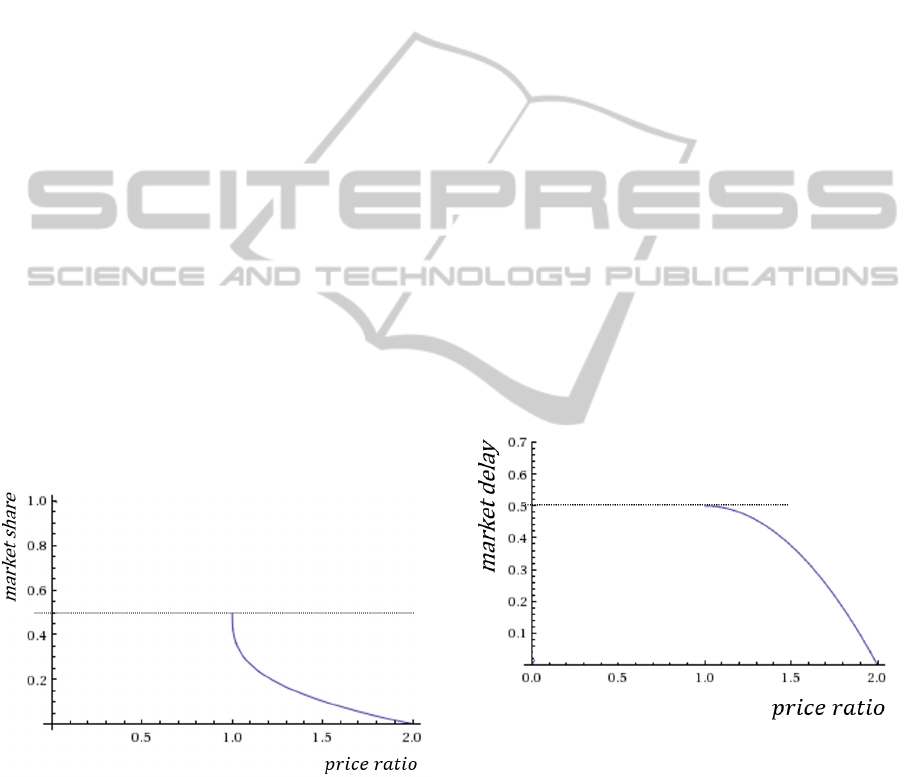
Zero Rate (ZR). This parameter defines the price
ratio from up to which the price leader will win the
complete market in the current period. For instance,
if ZR = 3 and p
1
= 50, p
2
≥ 150, the first competitor
will have a market share of 100% in the current
period. In figure 1 this is the crossing of the market
share function ms with the x-axis.
Zero Coefficient (zc
ms
). Find zc
ms
so that ms(ZR) = 0
for a fixed SI.
Figure 1: Market-price-sensitivity function for SI=2 and
ZR=2.
Figure 1 shows a plot of ms for SI = 2 and ZR = 2.
In this example, the derived zero coefficient zc
ms
is
1/2.
ms is easy to calibrate: It suffices to determine two
points of the function ms. This can be done either
by choosing proper values for ZR and SI or by ex-
perimental markets, as e.g. described in (Neumann,
2007).
5.3 Market Delay Percentage
To simulate a more realistic market behaviour the cus-
tomers in Salt Seller are divided into two groups: The
first group, the “early adaptors”, reacts immediately
to the latest price offers of the two salt producers. The
second group, the “conservatives”, reacts with a delay
of one period which means their buying decision de-
pends on the prices of the prior period (while actually
paying the new prices). This provides a simplified
model of a customer who once decided to buy from
one producer (based on the price situation back then)
and then just keeps on buying from the same producer,
no matter how the prices develop.
The distribution of these two groups again de-
pends on the price ratio. This follows the intuition
that a very big difference in the prices for salt will
alert even the most inattentive customer. The larger
the difference between both prices, the lower the per-
centage of conservatives, the lower the md p. In our
model, the market delay is defined as the continuous
function md p : [1,∞) → [0,1], with
md p(x) =
(1 − ZDP)−
− zc
md p
(x − 1)
2
,
1 ≤ x ≤ ZR
0, x > ZR.
(3)
Figure 2: Market-delay function for ZDP=0.5 and ZR=2.
In this function, x is the price ratio defined as in
the previous section and md p is the percentage of the
customers in the second group, thus md p(x) provides
the percentage of the conservatives. The percentage
of the early adaptors is calculated as 1 − md p(x).
Using the decreasing part of a negative parabola
function suited the simplified model of market delay
well. It decreases only slowly where both opponents
sell at similar prices. The more one player raises
his price above that of his competitor, the faster the
customers change groups and react to the big price
SaltSeller-RealizationofaBusinessGame
131

difference.
Zero Delay Percentage (ZDP). This parameter de-
fines the minimum percentage of customers that be-
long to group one.
ZR is defined as in the previous subsection. zc
md p
is calculated by md p(ZR) = 0. It determines the price
ratio from up to which every customer will be part of
the first group and nobody will buy from the more ex-
pensive producer anymore out of convenience. Figure
2 shows a plot of md p for ZDP = 0.5 and ZR = 2.
5.4 Market Demand
The market demand of the current period is defined as
demand(p
min
) = MaxD − zc
demand
∗ p
min
(4)
where p
min
is the price of the price leader. This is
a linear function, zc
demand
is calculated for a given
choice of the parameters Zero Demand Price ZDPr
and Maximal Demand MaxD.
According to the article ”The price of salt: Salt
sellers“
1
there are very different types of salt which
leads to prices between 40$ to 50$ per ton for de-icing
salt and 70,000$ per ton for a French high quality salt.
Furthermore the global consumption of salt is rising.
In 2018 the forecast for global demand is 324 million
tons per year
2
. To keep the simulation game simple a
fictive multifunctional salt and linear market demand
is used for the function above. Derived from the in-
formation about the salt market example values of 320
million tons per year for MaxD and 960$ per ton for
ZDPr are supposed to be realistic. However, we are
aware that salt is a essential good for every human
being, thus assuming a Zero Demand Price is a bit
unrealistic.
5.5 Output Calculation
Since market delay is taken into account the calcula-
tion of the market share of the current period does not
solely depend on the market-price-sensitivity func-
tion ms(x). Instead of that we have to calculate the
sum of the outcome of ms(x) with the price ratio of
the previous period weighted with the percentage of
the delayed customers from group two and the out-
come of ms(x) with the current price ratio weighted
with the percentage of customers without delay from
group one. Altogether we get for the market share
1
http://www.economist.com/node/15276675, retrieved on
20 Feb. 2015
2
http://www.reportlinker.com/p0788601-summary/World-
Salt-Market.html, retrieved on 20 Feb. 2015
MS of the price leader and p
h
= higher price and
p
l
= lower price in period t:
MS
t
= ms(
p
h
t−1
p
l
t−1
) ∗ md p(
p
h
t
p
l
t
)
| {z }
“conservatives
00
+ ms(
p
h
t
p
l
t
) ∗ (1 − md p(
p
h
t
p
l
t
))
| {z }
“early adaptors
00
(5)
where ms(x) and md p(x) are the market-price-
sensitivity and market delay function from the pre-
vious subsections. The market share for the other salt
producer in period t then calculates as 1 − MS
t
.
sales
i
t
= MS
i
t
∗ demand(p
min
t
) ∗ p
i
t
for i ∈ {1,2} (6)
The sales are calculated by multiplying the mar-
ket share with the total demand of salt which is de-
termined using equation 4 and multiplying that value
with the salt price of the player.
pro f it
i
t
= sales
i
t
− MS
i
t
∗ demand(p
min
t
) ∗ MC
for i ∈ {1,2} (7)
The profits can be determined by subtracting the
production costs from that value. The production
costs are calculated by again multiplying the market
share with the salt demand and multiplying that value
with the marginal costs which are another parameter
of Salt Sellers’s market model.
The player with the highest cumulative profit over
all periods wins the game.
6 IMPLEMENTATION
Running in a browser and dealing with the multi-
player issues of a round-based game were the two
main requirements for the implementation of Salt
Seller. The scalable Python Web framework Django
meets these requirements well.
Use of Python. Python is a lightweight scripting
language with a clean and elegant syntax. Its big
library and Object Oriented language model suites
well for a wide variety of applications and so it does
for web applications.
Model-view-Controller. Django follows the model-
view-controller software paradigm which separates
data model, data handling logic and user interfaces
from each other. This brings the advantage that one
ICE-B2015-InternationalConferenceone-Business
132
part can be developed and changed without affect-
ing the other. The framework also takes care for the
object-relational mapping (ORM) and introduces a
separation between the data model and the database
layer. Nearly all well-known relational database en-
gines are supported and can be used without changing
the data model.
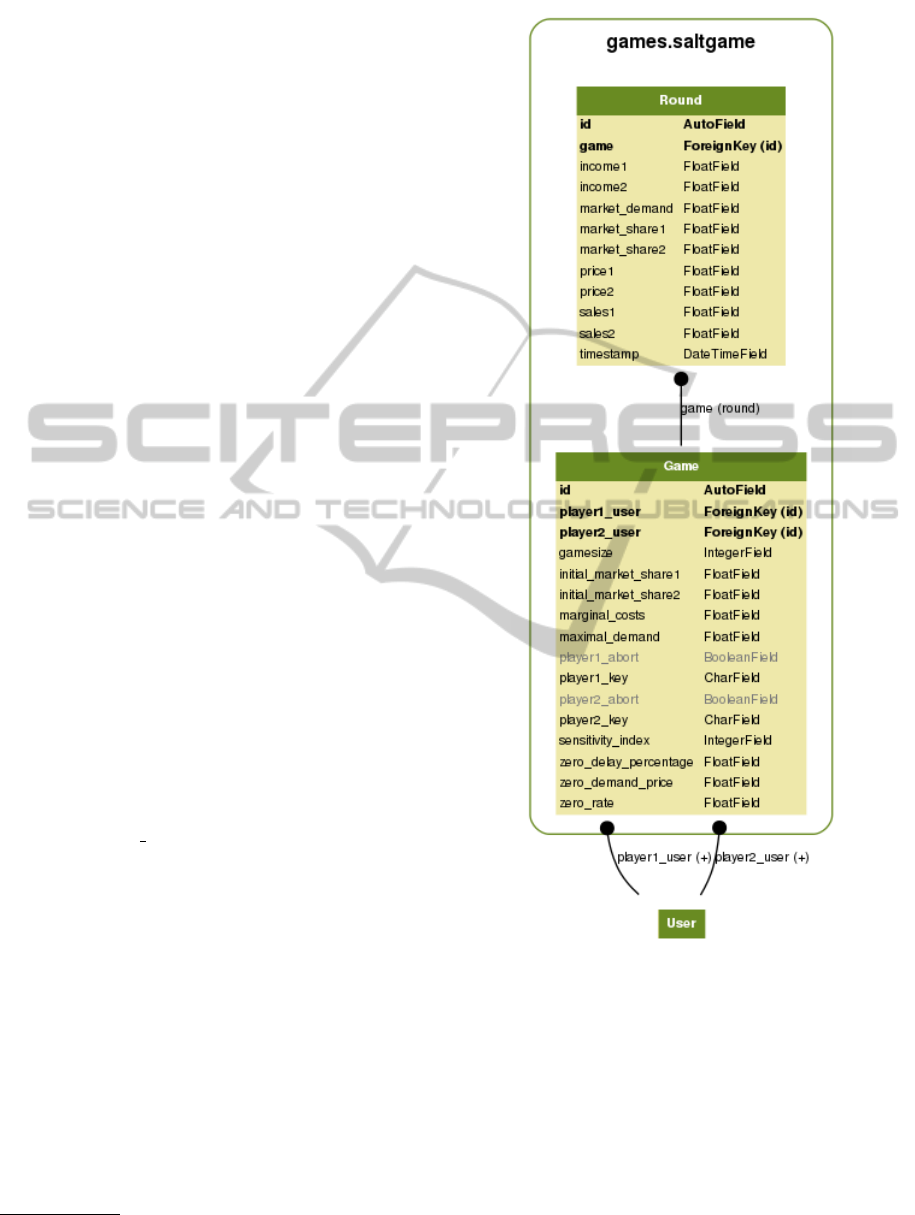
6.1 Data Model
Figure 3 shows the data model of Salt Seller. Since it
is a round-based game it consists of the classes Game
and Round.
The class Game holds all the attributes which de-
scribe an instance of a game - like the values of the
parameters chosen for this specific game or the users
who are playing.
One game consists of as many rounds as specified
by the parameter maxrounds. The class Round con-
sists of the round-specific input and output attributes
like the prices for salt, market shares, sales, profits,
and total salt demand.
In its mapping from Python objects to relational
databases each class of Django’s model becomes a ta-
ble and each class variable becomes a column in the
database. Many-to-one relationships are translated
into foreign key relationships. Each round holds a
foreign key to one single game and since Salt Seller is
integrated into KIT’s infrastructure each game holds
the two foreign keys of the two players playing. Valid
users must be members of KIT.
Please note that the classes in Django’s model are
more than a sheer abstraction layer of the database.
Round and Game define methods as in any Object
Oriented language. A round for example has the
method calculate round which implements the result
functions F from section 5. It is then part of the
data handling logic (controller) to call this method of
a round object at the right time - namely after both
players have submitted their price decisions.
6.2 User Interface
Figure 4 shows the user interface of Salt Seller. On
the left side the players can submit the salt price
and read information about the last round as well as
the marginal costs which stay the same during the
entire game. On the right side the Google Chart API
3
is used for visualizing the salt prices and the game
outputs.
3
https://developers.google.com/chart/, retrieved on 20 Feb.
2015
Figure 3: ER model of Salt Seller.
Location of the Game. The implementation de-
scribed above can be found at the KIT web site.
7 PRELIMINARY EVALUATION
Whenever Salt Seller is played, the complete game
history is stored to the database. This means that ev-
ery decision of a player, every output it created, every
parameter setting of the economic model as well as
time and user information can be retrieved for detailed
SaltSeller-RealizationofaBusinessGame
133
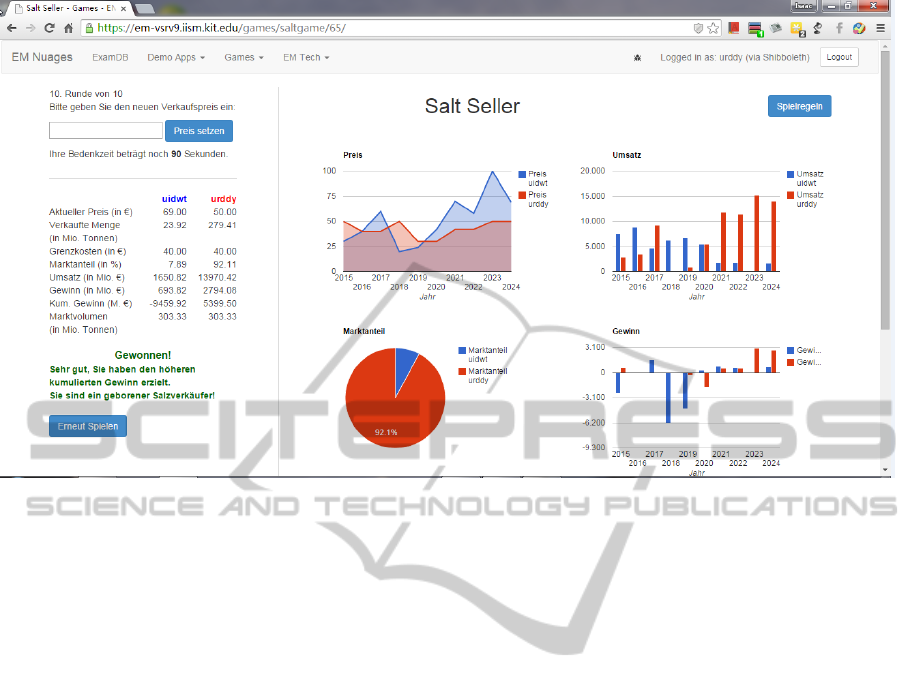
Figure 4: User interface (in German).
analysis later. So far, this capability was used for im-
plementation issues and for validation of the market
model. The next step is to use Salt Seller in class or
in laboratory experiments. While the students profit
from the lesson within a gaming environment, further
research can be done with the collected data. It will
be of use in order to analyse the strategies of the play-
ers as well as to observe strategy changes in response
to the behaviour of the opponent. Since Salt Seller is
already integrated into KIT’s infrastructure, the data
can be easily linked with further information about
the player such as age, field of study and so on. If
carried out in a laboratory, questionnaires can be used
to gather further demographic, psychological, socio-
logical, or strategy related information. Altogether,
the collected data will contribute to the understand-
ing of the behaviour of actors on a stable market. It
hopefully allows us to identify players with different
strategies (strategy families).
8 CONCLUSIONS
This paper gives a complete and detailed description
and implementation of the Salt Seller business game
of Sterman (Sterman, 2014). It shows how the sta-
ble market of Salt Seller can be modelled realisti-
cally considering effects like market delay or differ-
ent price-market-sensitivities. Sterman’s paper lacks
a detailed explanation of market mechanisms, func-
tions and parameters. A main contribution of our pa-
per is to fill those gaps by providing these details. Our
approach is fully parametrized which makes it highly
configurable. We include a short discussion about pa-
rameters, reasonable parameter values and their in-
fluence on game progression. Aside, we classify the
game following the scheme of Greco (Greco et al.,
2013).
The second major contribution of this work is the
proposition of a framework for a general n-person
round-based game as a 6-tuple of turn-based inputs,
fixed parameters, state transition functions, outputs,
objective function, and a stop condition.
As third contribution we implemented the game
as a browser game. Therefore a software architec-
ture was designed supporting various 2-player, round-
based, concurrently played, business games within
a browser. The architecture enables a later analysis
of all played games including details of input vari-
ables, parameters, and output variables of each round
as well as the overall game result. The chosen archi-
tecture is light-weight and adaptable and can act as
a blueprint for further 2-player round-based business
simulations. Consequently the implementation of the
game is available at the KIT web site for usage in Uni-
versity lectures, demonstration purposes and manage-
ment trainings.
Further work could be done to extend the mar-
ket model: Effects like the business cycle could
be modelled by introducing stochastic/random be-
haviour. Apart from that we plan to integrate the
Salt Seller game implementation into lectures for our
ICE-B2015-InternationalConferenceone-Business
134

students. This will allow us to analyze played game
strategies. However, before this the game needs to be
embedded in a learning environment including man-
uals and instructions for players and facilitators. Fur-
thermore, we think of including non-player charac-
ters, computer agents implementing machine learn-
ing algorithms for strategy learning. The architecture
can be extended to support an n- instead of a 2-player
base.
REFERENCES
Aarseth, E., Smedstad, S., and Sunnana, L. (2003). A multi-
dimensional typology of games. Level Up Conference
Proceedings, pages 48–53.
Bernard, R. R. (2014). Characterizing business games used
in distance education. Developments in Business Sim-
ulation and Experiential Learning, 33:124–130.
Django (2015). Django web framework (version 1.5).
https://djangoproject.com. [Computer Software; ac-
cessed 03-March-2015].
Eilon, S. (1963). Management games. Journal of the Oper-
ational Research Society, 14(2):137–149.
Elverdam, C. and Aarseth, E. (2007). Game classification
and game design construction through critical analy-
sis. Games and Culture, 2(1):3–22.
Faria, A. J. (1998). Business simulation games: Cur-
rent usage levels - an update. Simulation & Gaming,
29(3):295–308.
Forrester, J. (1961). Industrial Dynamics. Pegasus Com-
munications, MA, United States.
Greco, M., Baldissin, N., and Nonino, F. (2013). An ex-
ploratory taxonomy of business games. Simulation &
Gaming, 44(5):645–682.
Hsu, E. (1989). Role-event gaming simulation in manage-
ment education: A conceptual framework and review.
Simulation & Games, 20(4):409–438.
Jarmain, W. E. (1963). Problems in industrial dynamics.
M.I.T. Press, Cambridge.
Larr
´
ech
´
e, J.-C. and Gatignon, H. (1977). Markstrat – A
Marketing Strategy Game: Teaching Notes. Scientific
Press, Palo Alto.
Maier, F. H. and Gr
¨
oßler, A. (2000). What are we talking
about? - A taxonomy of computer simulations to sup-
port learning. System Dynamics Review, 16(2):135–
148.
Neumann, A. W. (2007). Price elasticity of digital scientific
information – a field experiment. IADIS International
Journal on WWW/Internet, 5(2).
Ricciardi, F. M. and Marting, E. (1957). Top management
decision simulation: The AMA approach. American
Management Association.
Riedel, J. and Hauge, J. B. (2011). State of the art of seri-
ous games for business and industry. In Proceedings
of the 17th International Conference on Concurrent
Enterprising (ICE), 2011, pages 1–8. IEEE.
Rokicki, M., Chelaru, S., Zerr, S., and Siersdorfer, S.
(2014). Competitive Game Designs for Improving the
Cost Effectiveness of Crowdsourcing. In Proceedings
of the 23rd ACM International Conference on Con-
ference on Information and Knowledge Management,
CIKM ’14, pages 1469–1478, New York, NY, USA.
ACM.
Sterman, J. (2014). Interactive web-based simulations
for strategy and sustainability: The MIT Sloan
learningedge management flight simulators, part i.
System Dynamics Review, 30(1-2):89–121.
Sterman, J. D. (1989). Modeling managerial behavior: Mis-
perceptions of feedback in a dynamic decision making
experiment. Management Science, 35(3):321–339.
Stratx Simulations (2015). Markstrat.
http://web.stratxsimulations.com/simulation/strategic-
marketing-simulation. [Online; accessed 03-March-
2015].
Summers, G. J. (2004). Todays business simulation indus-
try. Simulation & Gaming, 35(2):208–241.
Uskov, A. and Sekar, B. (2014). Serious games, gamifica-
tion and game engines to support framework activities
in engineering: Case studies, analysis, classifications
and outcomes. In 2014 IEEE International Confer-
ence on Electro/Information Technology (EIT), pages
618–623.
Wilson, R. (1997). Nonlinear Pricing. Oxford University
Press, Oxford.
Wolfe, J. (1993). A history of business teaching games
in english-speaking and post-socialist countries: The
origination and diffusion of a management education
and development technology. Simulation & Gaming,
24(4):446–463.
SaltSeller-RealizationofaBusinessGame
135
