
An Agent-based System for Issuing Stock Trading Signals
Zheyuan Su and Mirsad Hadzikadic
Complex Systems Institute, University of North Carolina at Charlotte, 9201 University City Blvd., Charlotte, NC, U.S.A.
Keywords: Complex System Modelling, Agent-based Simulation, Stock Market, Performance Analysis, Stock Trading
Signals.
Abstract: Simulation-based models are becoming a promising research tool in financial markets. A general Complex
Adaptive System can be tailored to different application scenarios. This paper describes an application of a
Complex Adaptive System-based agent model in stock trades signalling. The model has been evaluated using
historical movement of Bank of America stock. Agents in the system are initialized using random decision
rules. Genetic algorithms and machine learning methods are utilized to reduce the sample space and improve
the decision rules. Final rules are generated via Monte Carlo simulation and modified with a market
momentum estimate. By following the advice suggested by the model. The hypothetical investors have
outperformed the S&P 500 index and buy-and-hold investors. Compared with benchmark agents with buy-
and-hold strategy on stock and index respectively, the model achieved higher return even in periods of stock’s
poor performance. The stock trade-signalling model is implemented using the Netlogo framework.
1 INTRODUCTION
Picking winning stocks is hard, sometimes
impossible, as both endogenous and exogenous
events influence the value of shares in any given
moment. However, this has not stopped many
investors to try to either time the market or establish
strategies that would provide them with long-term
gains. Consequently, there are day trading, technical
trading, value trading, fundamental trading, and
contrarian trading among many other strategies that
have been advanced over the years as potential
winning strategies in the stock market.
With the advent of computers and sophisticated
analytical techniques, many of the previously
mentioned approaches have been automated using
information technology tools, (Subramanian, 2007,
Saad, 1998, Teixeira, 2010) although with limited
success. In recent years, complex adaptive systems –
inspired methods, primarily using agent-based
modelling techniques, have been tried as a way to
simulate traders’ behavior and capture the intricacies
of stock trading (Kodia, Said and Ghedira, 2010).
This paper introduces an agent-based model for
signalling the opportune times for stock trading. The
system has been evaluated in the context of Bank of
America in the period from 1987 – 2014. The model
outperformed S&P 500 and buy-and-hold strategy.
2 BACKGROUND
Besides the ordinary active and passive investment
strategies, a simple momentum and relative-strength
strategy could outperform the buy-and-hold strategy
70% of the time tracing back to 1920s (Faber, 2010).
There will be another improvement for the
performance after adding a simple trend before taking
positions. Abovementioned methods are not effective
at the level of individual agents who are making
decisions in real time. They simply provide a way to
retroactively simulate market movements. Agent-
based modelling techniques offer the opportunity to
simulate rational trading individuals taking into
consideration their interactions. The Zero Intelligence
model (Farmer, 2005) shows that agent-based models
can produce a high fit to the real stock market. The
Complex Adaptive Systems (CAS) framework and
agent-based modelling (ABM) implementation offer
a natural approach to capturing interactions between
agents in the market place. There was a successful
implementation of ABMs in simulating the NASDAQ
market using a single stock (Darley and Outkin 2007).
In the NASDAQ market simulation model, Darley
and Outkin present a new paradigm for the financial
market. Their markets were treated as complex
systems whose behaviour emerges as a result of the
interactions among different agents. It shows an
overall picture of the market but not the issue of
352
Su Z. and Hadzikadic M..
An Agent-based System for Issuing Stock Trading Signals.
DOI: 10.5220/0005508203520358
In Proceedings of the 5th International Conference on Simulation and Modeling Methodologies, Technologies and Applications (SIMULTECH-2015),
pages 352-358
ISBN: 978-989-758-120-5
Copyright
c
2015 SCITEPRESS (Science and Technology Publications, Lda.)

trading signals. In our model, we created a trading
environment to train agents. In the training stage,
agents will keep learning all the historical data. Then
in the testing stage, agents will issue the stock trading
signals that maximize profits based on their prior
learnt knowledge.
3 COMPLEX ADAPTIVE
SYSTEMS APPROACH TO
SIGNALING STOCK TRADES
Complex Adaptive System tools offer another option
to model nonlinear systems due to their ability to
capture the essence of distributed, self-organizing
social and natural phenomena characterized by
system’s component interactions and feedback loops.
Financial markets are complex systems (Johnson,
2003) with micro behaviors, interaction patterns, and
global regularities (Cappiello, 2006). ABMs can
model financial markets as a dynamic system of
agents. There already have been successful
implementations of ABM models in fields as diverse
as economics, government, military, sociology,
healthcare, architecture, city planning, policy, and
biology (Tesfatsion, 2006, Johnson, 2013, Dreau,
2009, Hadzikadic 2010, Su and Hadzikadic, 2014). In
financial market simulations, a large number of
agents engage repeatedly in local interactions, giving
rise to global markets (Raberto, 2001, Bonabeau,
2002).
In this paper we describe an ABM system that
issues a stock trading signal (buy, sell, or hold) for a
stock (Bank of America in our example). Agents trade
stocks based on the publicly available data from
January 2, 1987 to December 31, 2014. In addition,
agents will have the knowledge of the current status
of the stock market, be it bull or bear, based on the
recession data available from the National Bureau of
Economic Research (NBER). Here bull market
indicates a financial market of a group of securities in
which prices are rising or expected to rise. Bear
market denotes the opposite in financial market
terms. Agents use this information to select their
trading rules.
3.1 Agents
A collection of agents constitutes the “trading world”
in this ABM simulation. Agents are given a certain
amount of money at the model initialization stage.
Agents’ transactions are triggered by their decision
rules and the amount of capital they have. As they are
aware of the current market status, agents at each time
step choose between two sets of trading rules: bull
and bear market trading rules. Table 1 describes the
trading rules assigned to individual agents. The long
position in financial market is the action of buying a
security while the short position is the selling of a
security.
Table 1: Trading rules assigned to individual agents.
Buy-Threshold
Minimum price change required for
taking a long position
Buy-Period
Time window agents observe before
evaluating the Buy-Threshold
Sell-Threshold
Minimum price change required for
taking a short position
Sell-period
Time window agents observe before
evaluating the Sell-Threshold
The Table 2 describes agents’ decision rules in
detail.
For instance, if the values for buy-threshold and
buy-period for an agent are 0.2 and 30 respectively,
then the agent will take the following buying strategy:
IF the stock price goes up 20% in the past 30 trading
days, THEN take a long position on this stock.
Similarly, if the values for sell-threshold and sell-
period are 0.1 and 50 respectively, then the agent will
take the following selling strategy: IF the stock price
goes up less than 10% in the last 50 trading days,
THEN agent will take a short position. Also, short
selling is allowed at any point. An agent can short sell
any amount of stock up to their available cash
amount. IF none of these conditions are met, THEN
agents will keep the status quo, that is, a hold strategy
applies.
Market momentum is also an important factor that
will impact the agents’ decision rules. The more
agents are buying stocks, the higher bidding price.
The more agents are selling stocks; the stock
prices will tend to be low as agents are trying to
liquidate their inventories. In the model, agents will
issue trading signals based on the current market
momentum, thus making the trading signals more
consistent with the contemporary market status.
Agents will have access to current market latent
transaction information. As a result, the bandwagon
effect produces a significant impact on agent
transactions. The bandwagon effect simply means
that agent behaviors and beliefs, as well as their
consequences, spread around. Consequently, agents
will adjust their thresholds for both long and short
positions. In another words, if there is a huge number
of agents who are going to take a long position on
stocks, then they will increase their buy-
AnAgent-basedSystemforIssuingStockTradingSignals
353

Table 2: Agents’ Trading Rules.
threshold. At the same time, if the majority of agents
are interested in taking a short position on stocks, then
a substantial number of agents will correspondingly
decrease their sell-threshold as they try to liquidate
their assets as soon as possible. In order to control the
impact of market information, as well as the
momentum, agents are assigned a local variable
called self-confidence, which is randomly assigned at
the setup stage of the simulation. Self-confidence
controls how much each agent trusts other agents, and
how much it believes that the agents around are
accurate in their estimates. If an agent is totally self-
confident (self-confidence = 1.0), the agent only
follows its own trading rules and ignores the
information provided by other agents in the market.
In this model, the world is represented in 2
dimensions. Both X-axis and Y-axis range from -10
to +10. In this 20 x 20 world, agents have a local
variable named radius to define the distance within
which agents can reach out to other agents for
learning. This results in a trading decision rules
optimization. Each agent has a different value for its
radius in order to create a diversified trading
environment. At the same time, the radius reduces the
impact of unification among the agents by
differentiating their learning preferences.
3.2 Implementation
This stock position advising CAS model
wasimplemented using the Netlogo 5.1.0
programmable modeling environment (Wilensky
2009). Netlogo offers a user-defined grid and the
possibility of defining agents, normally called turtles
in NetLogo.
In this model, the exploration space for all
possible trading strategy combination is measured in
trillions. As the combination is extreme large, it has
huge impact on the computing speed of the
simulation. If all the combinations initialized in the
beginning of simulation, to provide a trade-off
between the computing speed and the space
exploration, we set the agent number to 1,000. All
transaction decision rules described in Table 1 are
randomized within the [-0.4,0.4] range for required
returns and within [0,100] range for the trading
periods. Self-confidence and aggressiveness at set to
0.3 and 0.001, respectively. However, in order to
maintain the possibility of exploring the whole search
space, a mutation mechanism is added, allowing a
subset of agents to mutate from [-0.4,0.4] to [-1,1] for
required returns and from [1,100] to [1,1000] for
trading periods. Agents are assigned the initial capital
in the amount of $50,000. The transaction cost is
fixed at $10 per transaction, thus forcing agents to
trade off for the opportunity costs. The mutation rate
is fixed at 0.1, which allows 10% of all agents to get
buy/sell threshold and buy/sell period generated in [-
1,1] and [1,1000] respectively. Also, interest will be
distributed at the end of each tick based on the amount
cash hold on hand.
In the model, we created two benchmark agents.
Benchmark agent 1 (BA1) always tracks and
replicates the action of the best performer in the
model. Benchmark agent 2 (BA2) tracks, weighs, and
replicates the top 10% best performers in the whole
system. For BA2, if the majority of the agents in the
10% top performers have a preference to buy, then
BA2 will take a long position. A short position
represents the opposite case. If the number of buy and
sell agents is equal, then hold strategy will be applied.
The complete simulation timeframe is divided
into 2 stages. Stage 1 is training phase in which agents
learn best individual trading strategies. Stage 2 is a
test stage. At the beginning of this stage Agents’
capital is reset to the initial value, while agents retain
all the rules they learned in the training phase. Agents
trade based on the strategies learned in Stage 1, while
attempting to maximize their profits.
Learning from other agents is disabled in the first
1,000 ticks, which leaves enough time for agents to
evaluate their initial trading strategies. After that,
agents learn throughout the rest of the simulation.
This mechanism allows agents sufficient time to
optimize their strategies throughout the volatilities of
the market, i.e. financial crises or huge price volatility
periods.
• Basic trading rules: rational + momentum
• Buy Rule:
– X > Y * (1 - self-confidence * momentum of buying)
in past Z
– Agents will buy
• Sell Rule:
– X < Y * (1 – self-confidence * momentum of selling)
in past Z
– Agents will sell
• Momentum ranges in [0, 1]
– Count how many people intend to buy/sell
– If no one is buying/selling, momentum of
buying/selling will be 0
– If everyone is buying/selling, momentum of
buying/selling will be 0
• X – Change in Stock Price
• Y – Buy/Sell Threshold
• Z – Buy/Sell Period
SIMULTECH2015-5thInternationalConferenceonSimulationandModelingMethodologies,Technologiesand
Applications
354

We used a genetic algorithm for regenerating or
eliminating agents (Holland, 1975). A hatch and die
concepts of NetLogo were used to introduce new
agents or eliminating underperforming ones. Agents
who lose all their money are eliminated from the
environment. At the same time, new agents are
initialized and placed into the environment, thus
keeping the number of agents constant. This
mechanism makes sure that a robust simulation
environment and active trading among agents are
maintained.
4 RESULTS
In the stock trading signalling model, S&P 500 and
Bank of America (BAC) buy-and-hold strategies
were used as performance benchmarks. As the
timeframe of the data is from 01/02/1987 to
12/31/2014, different settings of training/test
experiments were conducted during the simulation.
Table 3 shows three typical experiments.
Table 3: Experiment Setups.
Experiment 1
Training
From 01/02/1987
To 12/31/2014
Test
From N/A
To N/A
Experiment 2
Training
From 01/02/1987
To 12/31/2004
Test
From 01/02/2005
To 12/31/2014
Experiment 3
Training
From 01/02/1987
To 12/31/2011
Test
From 01/02/2012
To 12/31/2014
In experiment 1, agents are trading all the time
from 1987 to 2014. There is no test period, as agents’
capital is not reset during experiment. It indicates how
well agents perform in the maximum timeframe.
In experiment 2, the whole timeframe is divided
into 75% training and 25% testing tranches. In other
words, training stage is from 1987 to 2004, while the
test stage starts in 2005 and ends in 2014. This cut is
inspired by best practice in supervised learning.
As the underlying stock in the model is Bank of
America, which is in financial sector that was the
major cause of recent financial crisis, experiment 3
creates a bull market period for the testing stage in
order to test how well the model performs in a bull
market with less volatility in stock prices. As a result,
the training period is from 1987 to 2011, and the
testing period is from 2012 to 2014.
The results of the experiments are shown as below
in Table 4
Table 4: Experiment Profits in %.
Experiment
1
Benchmark
S&P 500
Buy & Hold
735.42%
BAC
Buy & Hold
664.53%
Benchmark
Agents
BA1 358.33%
BA2 581.12%
Model
Best
Performer
1,189.71%
Top 10% Best
Performers
718.44%
Experiment
2
Benchmark
S&P 500
Buy & Hold
73.3 %
BAC
Buy & Hold
- 50.4%
Benchmark
Agents
BA1 37.16%
BA2 71.29%
Model
Best
Performer
540.46%
Top 10% Best
Performers
88.89%
Experiment
3
Benchmark
S&P 500
Buy & Hold
61.88%
BAC
Buy & Hold
28.61%
Benchmark
Agents
BA1 71.85%
BA2 61.51%
Model
Best
Performer
374.02%
Top 10% Best
Performers
105.34%
It is obvious that the performance of the stock
trading signalling model is much better than a buy-
and-hold strategy on Bank of America stock. It even
outperforms the S&P 500, which shows an ascending
trend in the long term. As the Bank of America stock
has not recovered from the downfall of the last
financial crisis, it is a good test for evaluating the
performance of a simulation model, especially when
compared to S&P 500 index. Figures 1 through 3
show the comparisons between the model’s
performance and the buy-and-hold (BAH) strategy on
BAC and S&P 500 in a more intuitive way.
Experiment 1 indicates how well agents can
perform in the maximized timeframe. Agents are
trading based on their experience that accumulated
overtime. There is no capital reset during the
experiment 1, as we are trying to mimic the trading
situation in real life and give out a sense of the
maximum possibility of agents’ profitability. At the
same time, experiment 1 allows us to observe the full
story that happened during the whole timeframe while
AnAgent-basedSystemforIssuingStockTradingSignals
355
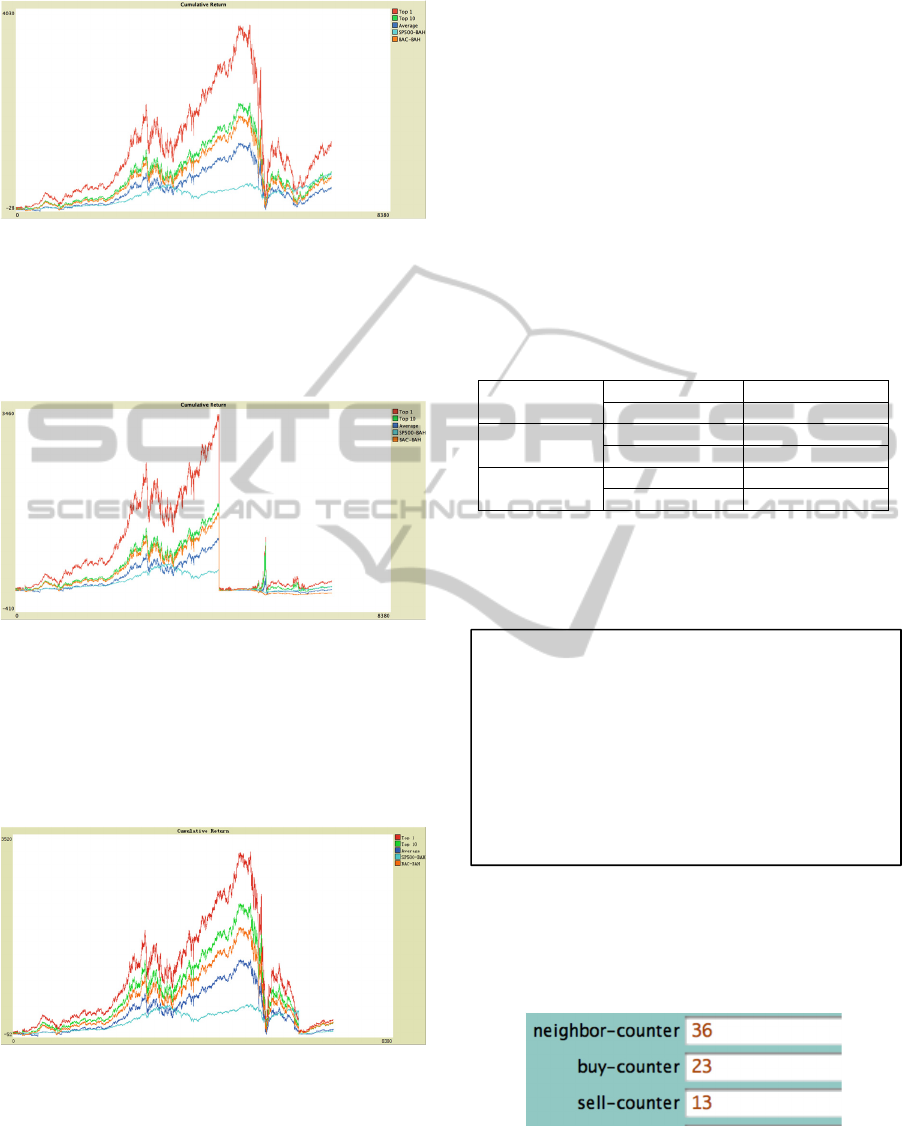
Figure 1: Experiment 1.
agents are trading. In Figure 1, the best performer
achieved the profit of 3,450% in 2007, right before
the beginning of the subprime mortgage crisis. All
agents suffered huge losses during this crisis and they
have not recovered even by the end of the simulation.
Figure 2: Experiment 2.
Experiment 2 resets agents’ capital in the first
trading day of 2005. Agents did well in the training
stage. In the test phase, agents secured significant
profits until the crisis happened. It took agents about
3 years to recover from the downfall incurred by the
crisis.
Figure 3: Experiment 3.
In the last experiment, agents’ capital was reset at
the beginning of 2012. In a pure bull market, the best
agent gained around 374% profit, which was 13.34
times more than the simple buy-and-hold strategy on
Bank of America stock.
However, it’s interesting to see that benchmark
agents (BA1 and BA2) underperformed their tracking
targets, the best performer and top 10% best
performers respectively. BA1 always replicates the
current market best performer’s action. BA2 mimics
the top 10% best performers’ action in the market.
One possible explanation is that the trading frequency
in bear market is much higher than that in the bull
market, as the higher transaction frequency enables
agents to secure the slight profit room in small price
changes. Although this strategy comes with higher
transaction costs, the extra profit can offset this
drawback. Table 5 shows this phenomenon through
the trading volumes.
Table 5: Trading Volumes in Shares.
Experiment 1
BA1 293,162
Best Performer 12,686
Experiment 2
BA1 113,770
Best Performer 6,851
Experiment 3
BA1 57,070
Best Performer 4,802
Table 6 shows the best trading decision rule set
derived from the experiments:
Table 6: Trading Rules for Best Performer.
The strategies above are the core decision rules for
issuing stock trading signals. However, the market
momentum turns the decision rules to actual
transaction thresholds, which are then used to help
agents make their moves.
Figure 4: Agent’s Built-in Variables for Momentum.
For example, the above figure (Figure 4) shows
an agent’s built-in variable for momentum. There are
36 agents around it. Out of these 36 agents, 23 want
For bull market:
• If the stock price goes down 37% in last 87 trading
days, take a long position.
• If the stock price goes up less than 20% in last 71
trading days, take a short position.
For bear market:
• If the stock price goes down 20% in last 10 trading
days, take a long position.
• If the stock price goes up less than 40% in last 61
trading days, take a short position.
SIMULTECH2015-5thInternationalConferenceonSimulationandModelingMethodologies,Technologiesand
Applications
356

to buy and 13 want to sell. As the confidence is 0.3,
Table 7 shows the actual decisions in that particular
tick.
Table 7: Actual Decision Rules for Best Performer in a
Particular Tick.
The following figure (Figure 5) is an example of
the actual stock trading signalling over time. When
the green line hits 1, the system advises a long
position. When the red line hits -1, then the model
advises a short position. If both lines stay at 0, then
hold strategy is applied.
Figure 5: Decision Plot Overtime.
5 ISSUES
In the experiment, agents’ learning too quickly was
one of the key issues. There is a variable called
aggressiveness which controls the degree of agents
learn from the difference between its and the best
agent’s performance. The aggressiveness was set to
0.1 while we introduced the learning component. That
is in each tick, each agent will learn the 10% of the
difference of trading rules between it and the top
performers in radius. As a result, uniformity spread
throughout the simulation. The best trader’s
performance was much less than 500%. This result
was way below the BAC buy-and-hold strategy.
Therefore, aggressive was decreased to eliminate
the uniformity among agents. Since the whole
simulation has only 7,053 ticks, if aggressiveness is
set too low then learning is not that effective in
changing agents’ decision rules. After several
hundred simulation runs aggressiveness was finally
set to its more optimal value of 0.001, in order to
reconcile the problem of diversity, learning speed,
and limited learning time.
What’s more, reducing aggressiveness increase
the correlation of return distribution between stock
trading signal issuing model and historical S&P 500.
Table 8 shows the correlation in different settings of
aggressiveness.
Table 8: Correlation of annual return between stock trading
signal issuing model and historical S&P 500 data.
Aggressiveness 0.1 0.01 0.001
Correlation 0.43 0.46 0.54
6 DISCUSSION, CONCLUSIONS
AND FUTURE WORKS
Computer simulations allow us to see the behind-the-
scene actions of the agents, and then to generate the
best stock transaction strategies based on the
interaction of agents. Comparing the model
performance with the buy-and-hold strategy of S&P
500 and BAC stock, the CAS stock-trading model
shows a much higher return on a single stock trading
in the same timeframe.
However, the momentum, a measure of the overall
market sentiment (Scowcroft and Sefton, 2005), plays
an important role in the CAS stock stock-trading
model. All the rules are adjusted based on the market
momentum in a specific time tick. With the benefit of
momentum, the performance of the stock-trading
model is far better than a simple buy-and-hold
strategy for both S&P 500 and BAC. In for the current
model, momentum is generated by the agents’ desire
to conduct transactions. Future refinements in the
momentum component will lay a key component in
improving the performance of the model.
We are currently working on several strategies for
improving the computation of the momentum
component. One is to extract the real time tweets from
Tweeter and to run a sentiment analysis on those
tweets. Then the signals from Twitter will be attached
to the current momentum component. Another one is
to use the transactions volume to deduce the historical
drive in the market and plug it into the current
momentum mechanism, leading to a more precise
For bull market:
• If the stock price goes down 29% in last 87 trading
days, take a long position.
• If the stock price goes up less than 18% in last 71
trading days, take a short position.
For bear market:
• If the stock price goes down 18% in last 10 trading
days, take a long position.
• If the stock price goes up less than 34% in last 61
trading days, take a short position.
AnAgent-basedSystemforIssuingStockTradingSignals
357

forecast about the upcoming market movements. In
return, agents can anticipate the changes in the future
investors’ actions and adjust their transaction
strategies to maximize profits.
The continuing refinement of the decision rules,
will see a replacement of the single stock trading
signaling mechanism with a multiple stock position
advising one. As a result, this model will have
practical values in the portfolio management as well.
This improved CAS model can be very helpful with
defining different parameters that best characterize
agents’ trading strategies, discovering and suggesting
suitable positions for different stocks at different
times, and discovering the factors affecting an
optimal portfolio management strategy. Finally,
agents in the future system will be categorized into
individual investors and institutional investors, as the
impact of their transactions differ in the real world.
Another version that allows agents to take
historical data for the training stage is under
development. By the end of the timeframe, agents
will use real-time data to conduct potential
transactions. We believe that agents will be able to
influence the market as we create a portfolio that trade
based on the agents’ signals. In return, agents will
change their trading behaviors corresponding to their
feedback from the market.
ACKNOWLEDGEMENTS
The authors thank the Complex Systems Institute
research group at UNC Charlotte for helpful
discussions, and the IT services at UNC Charlotte for
their provision of High Performance Clusters for our
research.
REFERENCES
Su, Z., Hadzikadic, M., 2014, 5
th
World Congress on Social
Simulation, Application of Complex Adaptive Systems
in Portfolio Management, WCSS 2014 Proceedings.
Tesfatsion, L., 2006. Handbook of Computational
Economics. Agent-based Computational Economics. A
Constructive Approach to Economic Theory. Vol. 2. pp.
831-880.
Johnson, L., Hadzikadic, M., Whitmeyer, J., 2013. The
Future Engaging Complexity and Policy: Afghanistan
Citizen Allegiance Model. International Journal of
Humanities and Social Science. Vol.3. No.10.
Dreau, D. Stanimirov, D.; Carmichael, T.; Hadzikadic, M.
2009, An agent-based model of solid tumor progression.
Bioinformatics and Computational Biology. Vol. 5462.
Holland, J., 1975. Adaption in Natural and Artificial
Systems.
Wilensky, U., 1999, Netlogo, Centre for Connected
Learning and Computer-Based Modeling.
Northwestern University, Evanston, IL.
Fishman, G., 1995. Monte Carlo: Concepts, Algorithms,
and Applications. Springer.
Faber, M., 2010. Relative Strength Strategies for Investing.
Cambria.
Barnes, J. 2003. Active vs. Passive Investing. CFA
Magazine. Jan 2003: 28-30.
Scowcroft, A., and Sefton, J., 2005. Understanding
momentum. Financial Analysts Journal, 64-82.
Johnson, N., Jefferies, P., and Hui, P., 2003. Financial
market complexity. OUP Catalogue.
Cappiello, L., Engle, R., and Sheppard, K., 2006.
Asymmetric dynamics in the correlations of global
equity and bond returns. Journal of Financial
econometrics, 4(4), 537-572.
Raberto, M., Cincotti, S., Focardi, S., & Marchesi, M., 2001.
Agent-based simulation of a financial market. Physica
A: Statistical Mechanics and its Applications, 299(1),
319-327.
Bonabeau, E., 2002. Agent-based modeling: Methods and
techniques for simulating human systems. Proceedings
of the National Academy of Sciences of the United
States of America, 99(Suppl 3), 7280-7287.
Hadzikadic, M., Carmichael, T., and Curtin, C., 2010.
Complex adaptive systems and game theory: An
unlikely union. Complexity, 16(1), 34-42.
Kodia, Z., Said, L., and Ghedira, K., 2010. A study of stock
market trading behavior and social interactions
through a multi agent based simulation. Agent and
Multi-Agent Systems: Technologies and Applications
(pp. 302-311). Springer Berlin Heidelberg.
Subramanian, H., Ramamoorthy, S., Stone, P., and Kuipers,
B., 2006. Designing safe, profitable automated stock
trading agents using evolutionary algorithms.
Proceedings of the 8th annual conference on Genetic
and evolutionary computation (pp. 1777-1784). ACM.
Saad, E., Prokhorov, D., and Wunsch, D., 1998.
Comparative study of stock trend prediction using time
delay, recurrent and probabilistic neural networks.
Neural Networks, IEEE Transactions on, 9(6), 1456-
1470.
Teixeira, L., and De Oliveira, A., 2010. A method for
automatic stock trading combining technical analysis
and nearest neighbor classification. Expert systems
with applications, 37(10), 6885-6890.
Farmer, J., Patelli, P., and Zovko, I., 2005. The predictive
power of zero intelligence in financial markets.
Proceedings of the National Academy of Sciences of
the United States of America, 102(6), 2254-2259.
Darley, V., and Outkin, A., 2007. NASDAQ market
simulation: insights on a major market from the science
of complex adaptive systems. World Scientific
Publishing Co., Inc.
SIMULTECH2015-5thInternationalConferenceonSimulationandModelingMethodologies,Technologiesand
Applications
358
