
Geographic Information Science and Technology as Key Approach to
unveil the Potential of Industry 4.0
How Location and Time Can Support Smart Manufacturing
Stefan Schabus
1
and Johannes Scholz
2
1
University of Salzburg, Salzburg, Austria
2
Graz University of Technology, Graz, Austria
Keywords: Geographic Information Science, Smart Manufacturing, Industry 4.0, Space and Time,
Abstract: Productivity of manufacturing processes in Europe is a key issue. Therefore, smart manufacturing and
Industry 4.0 are terms that subsume innovative ways to digitally support manufacturing. Due to the fact, that
geography is currently making the step from outdoor to indoor space, the approach presented here utilizes
Geographical Information Science applied to smart manufacturing. The objective of the paper is to model an
indoor space of a production environment and to apply Geographic Information Science methods. In detail,
movement data and quality measurements are visualized and analysed using spatial-temporal analysis
techniques to compare movement and transport behaviours. Artificial neural network algorithms can support
the structured analysis of (spatial) Big Data stored in manufacturing companies. In this article, the basis for
a) GIS-based visualization and b) data analysis with self-learning algorithms, are the location and time when
and where manufacturing processes happen. The results show that Geographic Information Science and
Technology can substantially contribute to smart manufacturing, based on two examples: data analysis with
Self Organizing Maps for human visual exploration of historically recorded data and an indoor navigation
ontology for the modelling of indoor production environments and autonomous routing of production assets.
1 INTRODUCTION
Geographic Information Science (GISc) is an
approach to describe, model, analyse and visualize
spatial phenomena as well as spatial processes
representing measurements. These representations
are used to identify the emphasis of spatial themes
and different entities including their relationships
between locations and features linked to locations
(Chrisman et al. 1989). In addition, Goodchild
(1991) sets the emphasis of a Geographic
Information System (GIS) to the handling and usage
of spatial data. Therefore, an understanding of
natural phenomena coupled with scientific methods
and knowledge is necessary in order to model spatial
real-world phenomena accordingly (Goodchild,
1991). Thus, a GIS is a framework to analyse spatial
information linked with attributes to generate new
results and insights out of spatial data.
Recently, higher efforts have been made in
outdoor geography than in indoor geography due to
the fact that already a high number of applications
and structured methods exists (Giudice et al. 2010;
Worboys, 2012). A comprehensive task is the
positioning both in indoor and outdoor environments
(Li et al., 2008). There are different challenges of
the positioning problem. Indoors, there are
limitations of the rooms’ size, the building and the
indoor environment in general. In contrary, outdoor
geography requires a regional or global coverage
(Mautz, 2008).
Indoor Geography related research is gaining
increasing interest.The variety of complex buildings
and the application specific development is
increasing the need for location based services
indoor (Goetz, 2012). In order to support complex
production processes Scholz and Schabus (2014)
developed an indoor navigation ontology that
describes the indoor production environment with all
relevant features including an autonomous
navigation for a production environment. According
to Janowicz (2008) and Gruber (1995), ontologies
are a specification of a conceptualization and are
able to model complex behavior as simplified
representations. Such spatially enhanced models
463
Schabus S. and Scholz J..
Geographic Information Science and Technology as Key Approach to unveil the Potential of Industry 4.0 - How Location and Time Can Support Smart
Manufacturing.
DOI: 10.5220/0005510804630470
In Proceedings of the 12th International Conference on Informatics in Control, Automation and Robotics (ICINCO-2015), pages 463-470
ISBN: 978-989-758-123-6
Copyright
c
2015 SCITEPRESS (Science and Technology Publications, Lda.)

include the ability to support the analysis of spatial
patterns. A movement behavior model has to be
developed accordingly which can be used to create
Self-Organizing Maps (SOM). SOMs are one type
of artificial neural network algorithm (Kohonen,
2013) to analyse attributive data over time.
For a manufacturing site, the productivity and
efficiency is a crucial issue. Therefore, smart
manufacturing is a new research field as it is
strategically important for the industrial sector as it
facilitates the competitiveness of a manufacturing
site (Davis et al. 2012). Additionally, companies are
collecting huge amounts of spatial-temporal data,
such as transport movement data, which could be the
basis for spatial-temporal data mining e.g. by
visualizing maps to enable intelligent pattern
recognition. This is useful as humans can identify
visual patterns easily (Compieta et al. 2007). Finally,
optimization of production processes depends on
allocation and sequencing of processes and assets.
This unveils the potential to increase the
productivity and efficiency going hand in hand with
cost-savings and increased performace, which could
be one interesting research field for indoor
geography and GIS (Nyström, 2006).
The scientific question in this paper can be
summarized as “Can GIS, applied in indoor space
and in indoor production line environments, help to
understand and optimize production processes”.
Thus, we focus on supporting Industry 4.0 with
spatial and spatial-temporal analysis to gain added
value out of big data using visual analytics.
The paper is organized as follows. Chapter 2
deals with indoor and outdoor geography and the
temporal dimension of the production processes.
Chapter 3 characterizes the variability of different
types of indoor spaces and the indoor space of a
production environment including it’s specific
pecularities. Chapter 4 highlights an approach to
visualize and analyze quality measurements and
transportation behavior followed by a conclusion
and a future research directions.
2 INDOOR GEOGRAPHY,
OUTDOOR GEOGRAPHY AND
THE TEMPORAL DIMENSION
Geographic Information Systems and Technology
are intensively used in outdoor contexts. Thus the
theory, methodologies and technologies are well
established (Giudice et al. 2010). In contrast, GIS for
the indoor context, which is subject of this paper, is
rather weakly developed (Worboys, 2012).
Nevertheless, the first papers on modeling indoor
space and indoor wayfinding were published by
Raubal and Worboys (1999) and Raubal (2001). The
latter uses an airport as indoor environment and
describes an agent-based indoor wayfinding
simulation. The term GIS, as used in this paper,
describes a computer system to analyze, store,
manipulate, analyze and visualize spatial data
accordingly (e.g. Longley et al., 2011). Hence, any
GIS – with appropriate data – is able to answer the
three basic questions:
- What happended?
- Where did a phenomenon happen?
- When did a phenomenon happen?
These questions are valid for any appliation area
indoor and outdoor. Also for mobile GIS
applications, like apps on a mobile device, a context
awareness, in terms of location and time, is
inevitable. In GISc, such context-aware services that
are consumed by mobile devices are called
Location-based Services (e.g. Küpper, 2005).
Classical spatial analysis algorithms are e.g.
summarized in De Smith et al. (2007). A
prerequisite for spatial analysis is an abstract
modeling of the universe of discourse. Therefore a
set of basic spatial primitives – point, line, polygon –
is utilized that helps to model and abstract reality
accordingly. Based on these spatial primitives, any
existing spatial relation of the objects can be
analyzed. The power of spatial analysis is based on
linkages and relationships of locations. Hence,
relative positions are more important than absolute
ones. Examples of topological relations are
adjacency, connectivity, and containment, while
non-topological relations are e.g. neighborhood or
distance.
In order to represent and model dynamic
situations in a GIS one needs to integrate the
temporal dimension. Hence, space has to be coupled
with time, with the basic assumption that one object
can only occupy a distinct part of space at a specific
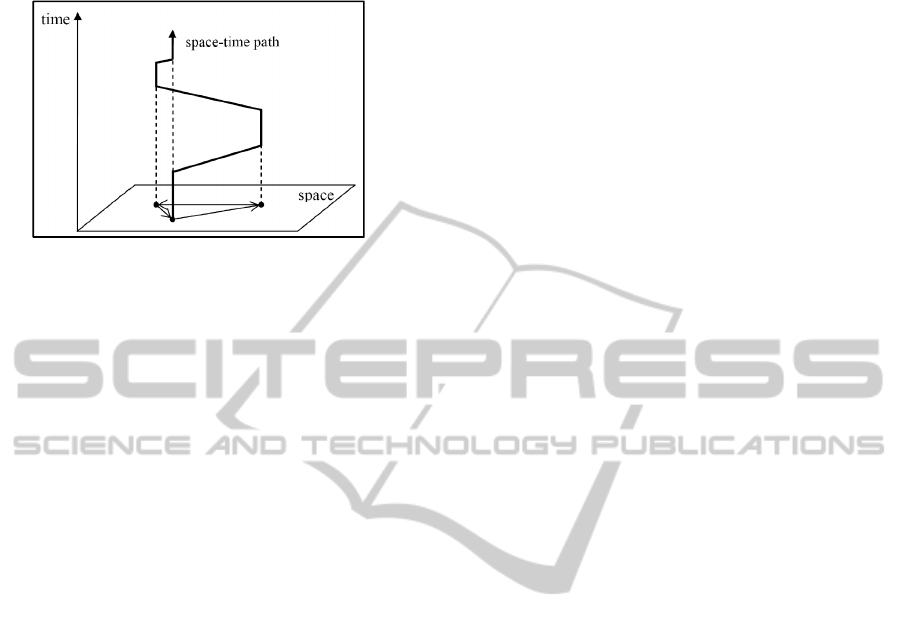
point in time. To describe spatial and temporal
processes Hägerstrand (1970) developed an
approach named Time Geography. There
movements of objects are modeled as paths in a 3D-
cube with respect to space (i.e. latitude and
longitude) and time (see Figure 1). The
representation of space and time in a database is
basically done with two approaches: discrete vs.
continuous (Peuquet, 2001). The discrete approach
is comparable to a limited set of time slices with the
spatial entities as main elements. The continuous
approach favours a space and time representation,
ICINCO2015-12thInternationalConferenceonInformaticsinControl,AutomationandRobotics
464
where the spatial objects are denoted as attributes
attached in space-time.
Figure 1: Time and Geography (Graphic from Yu (2006)).
Summarizing, GISc seems like a valuable approach
to model, analyze and visualize spatial-temporal
production relevant data. Especially, due to the
capability of any GIS, to analyze data in terms of
space and time, it can be helpful to gain new insights
in production relevant data.
3 CHARACTERIZATION OF
INDOOR SPACE
To characterize indoor space in general, certain
effort is needed to generate accurate and consistent
models. Due to the high complexity of indoor
structures and the context based linkage to the
buildings’ field of application the characterization is
not as straight forward as in outdoor geography
(Ascraft, 2008; Meijers et al. 2005). To address the
topic of indoor spaces and their characterization, the
variability of such indoor spaces is described in
section 3.1. In advance, section 3.2 outlines an
indoor production environment of a manufacturing
site, which results in an indoor navigation ontology
for production assets in section 3.3.
3.1 Variability of Indoor Spaces
There is a high variability of indoor spaces. In
addition to outdoor geography, indoor geography is
much more complex as it is context based (Ascraft,
2008; Meijers et al. 2005). An important topic for
the indoor geography is the positioning, as an exact
and accurate position is the basis for various
upcoming applications (Barnes et al., 2003).
According to Mautz (2008), the main difference
between outdoor and indoor is the different focus of
the positioning approach regionally or globally.
Therefore, indoor positioning solutions focus on
context-aware-services and on the location of e.g. a
person or production assets (Xiang et al., 2004; Al
Nuaimi and Kamel, 2011).
3.2 Indoor Space of a Production
Environment
The sophisticated arrangement of the indoor space
and the peculiarities of the production context
require high modelling effort. This section is based
on the work of Geng (2005), Osswald et al. (2013),
Scholz and Schabus (2014) and personal experience.
Pre-requisites of an indoor production
environment are, for example, the clean room
environment of a semiconductor fabrication, which
has to be built in a very compact way as the
construction is very cost-intensive and hard to
maintain (Schabus et al. 2014). However, the layout
of a production differs from classical production
halls using a conveyor belt metaphor as well as from
an ordinary indoor environment. According to
Schabus et al. (2014), buildings with a context of
e.g. residential use are mainly separated into rooms
and corridors which can be connected by doors. In
addition, a production environment differs through
distinguishable corridors with a substantial length
and different types of doors such as sliding doors or
doors going in one direction, in e.g. an air lock.
In general, the production of a microchip is a
complex sequence of equipment which is the context
of the indoor production environment of a
semiconductor fab. This sequence considers several
hundred different production steps which have to be
involved and are not aligned along a conveyor belt
to keep the flexibility. The flexibility is essential as
there is a high number of production assets present
at the same time which are also linked to different
sequences of production steps and a varying level of
completion. Hence, the overall processing time is
between several days up to a couple of weeks. To
imbue the flexibility, the equipment is also
distributed geographically throughout the production
hall and different equipment can carry out the same
production steps.
To summarize these peculiarities of an indoor
production environment, figure 2 highlights the eight
main factors - affordances and restrictions -
influencing the characterization of the indoor
production environment by considering the
production assets’ point of view. These context
based main factors are “a high number of production
assets”, “several hundred production steps”,
“executable production steps on several tools”,
“geographically distributed equipment”, “processing
GeographicInformationScienceandTechnologyasKeyApproachtounveilthePotentialofIndustry4.0-HowLocation
andTimeCanSupportSmartManufacturing
465
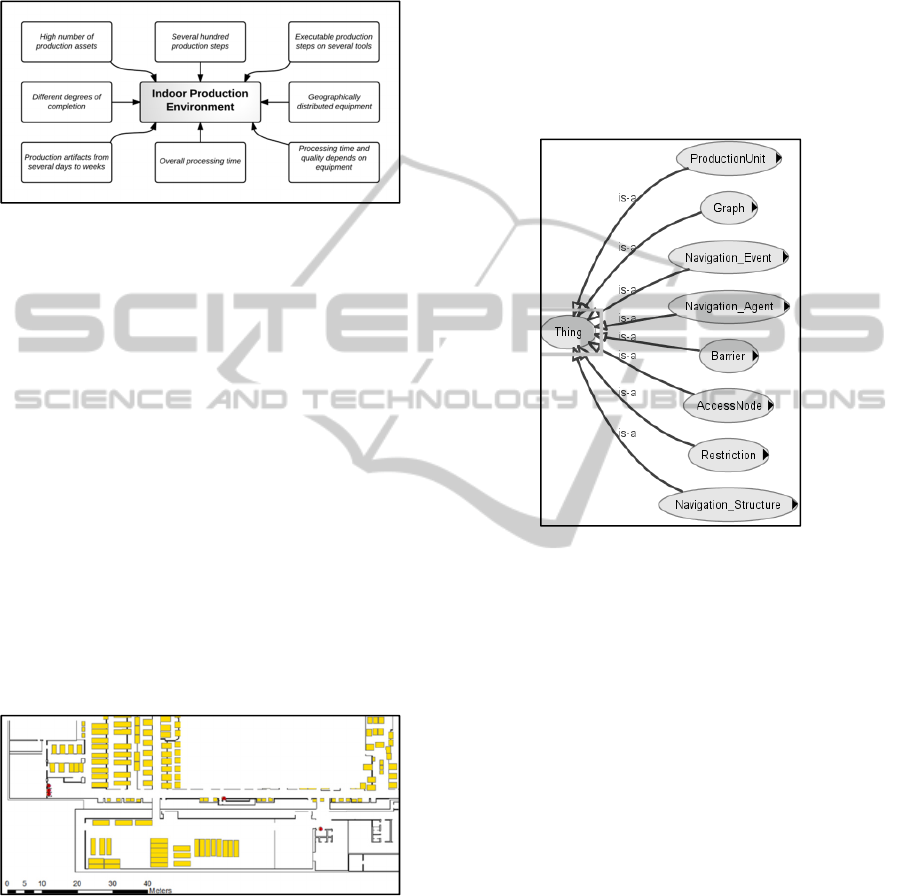
time and quality depends on equipment”, “overall
processing time”, “production artefacts from several
days to weeks” and “different degrees of
completion”.
Figure 2: Context-based factors for the indoor production
environment in the production assets’ point of view.
The indoor production environment of a
semiconductor manufacturing site is often separated
into corridors with a significant length which is
depicted in figure 3. Generally, production assets are
moving several kilometres within the production
environment. This highlights the potential for
decision support present within the indoor
geography, as managers would like to know where
and when issues arise concerning production
processes. Figure 3 highlights the equipment
visualized as standardized yellow rectangles and red
nodes for the accessing and transferring
within/between indoor spaces and outdoors.
To sum up, the indoor geography of a production
line environment is a complex environment, due to
the specific context of the production. The
characterization imbues many factors defining the
indoor production environment in detail.
Figure 3: Indoor geography of a production environment
using white spaces to hide the exact layout and
standardized polygons for visualization purposes.
3.3 Indoor Navigation Ontology for
Production Assets
Scholz and Schabus (2014) developed an indoor
navigation ontology for production assets in a
production environment. Their ontology supports an
autonomous navigation in the indoor environment
applied with an affordance-based approach.
The navigation ontology is based on eight main
entities visualized in figure 4. In general, figure 4
depicts an adapted version of the indoor navigation
ontology by Scholz and Schabus (2014). The
navigation elements are the moving production asset
as “NavigationAgent”; “NavigationEvent” as start,
end or any turn; “NavigationStructure” as generic
entities for the route calculation.
Figure 4: Modified and adapted main elements of the
navigation ontology by Scholz and Schabus (2014).
Further elements describing the indoor geography
are the “ProductionUnit” as facilities and processing
units; the “Graph” summing up edges and nodes; the
“Barriers” limiting the movement; “AccessNode”
establishing the accessibility or traversing between
spaces; the “Restriction” to specify affordances.
To sum up, Scholz and Schabus (2014)
developed an indoor navigation ontology describing
the indoor space and navigation elements. By
combining both parts, they successfully established
an autonomous indoor navigation approach for a
production line.
4 VISUALIZATION AND
ANALYSIS OF TRANSPORT
AND QUALITY
The visualization and analysis of transport and
quality data is the result of a new approach to unveil
the potential of smart manufacturing or Industry 4.0
using GISc and technologies. Therefore, geo-visual
ICINCO2015-12thInternationalConferenceonInformaticsinControl,AutomationandRobotics
466
analytics, map generation, spatial-temporal data
mining, trajectory pattern mining and artificial
neural network algorithms such as SOMs are used.
Geo-visual analytics and map generation
enhance the ability to generate and gain new
knowledge out of large datasets of spatial-temporal
data. Potential use cases of such visualizations can
be incorporated into the optimization of transport-
/movement behaviour or the analysis of quality hot
spots. Spatial-temporal data mining can be
implemented by SOMs as they are one type of
artificial neural network algorithm (Kohonen, 2013).
SOMs visualize data and set up the basis for visual
data mining. Kohonen (1998) implies that SOMs are
usable to solve complex tasks like process analysis,
perception of machines and control communications.
Additionally, Skupin (2010) describes the TRI-space
approach linking the geographic space, temporal
space and the attributive space.
The topics in this section address an approach for
the visualization in section 4.1 followed by an
example how the transport-/movement behaviour
could be visualized in section 4.2. Additionally,
section 4.3 adds the analysis part of the transport-
/movement behaviour and quality measurements.
4.1 Approach to Unveil the Potential of
Visualization and Analysis
A general approach for smart manufacturing under
consideration of GIS starts with the modelling and
analysis of the base data. Therefore, use cases
consider questions about what is temporal or spatial
information. Temporal information involves e.g. the
duration of something or the timestamp of an event
occurrence. Spatial information considers questions
such as where was something; what is the shortest
path. Defined use cases together with the indoor
ontology lead to a spatial-temporal data model,
which can serve as general “data warehouse” within
a company. The additional spatial component of the
database enables further queries.
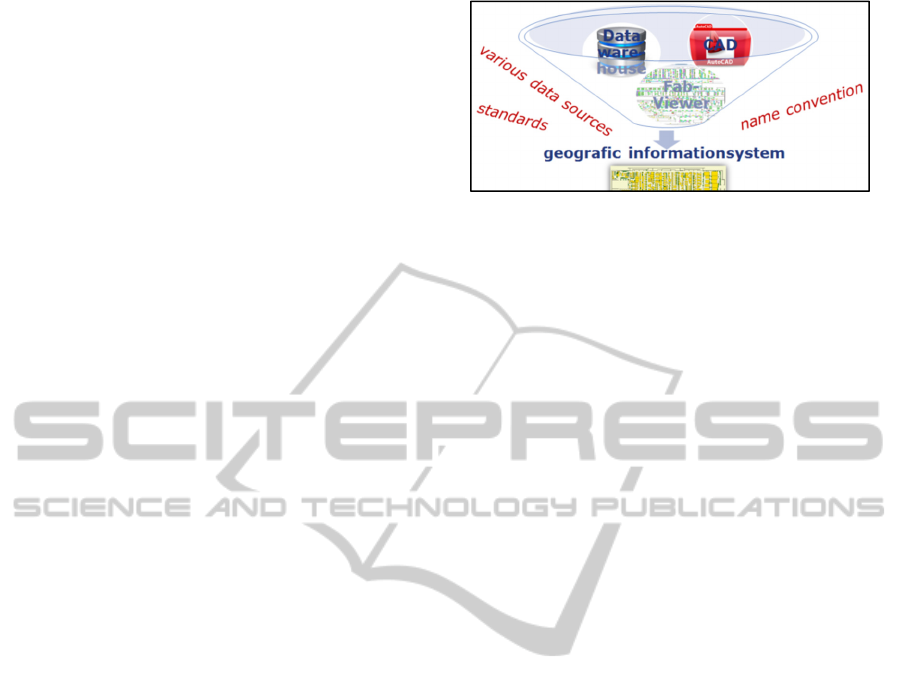
Figure 5 illustrates possible existing systems
within a company. It is briefly depicted how a funnel
aggregates the data warehouse combining distributed
databases, AutoCAD data used for planning
purposes and a static viewer of the manufacturing
site. This leads to an aggregation and finally to a
company-wide GIS. This shows that necessary data
sources are available, but have to be integrated and
harmonized to unveil their full potential. Thus, a
GIS based on one general data warehouse has the
potential to unveil the potential of Industry 4.0.
Figure 5: Aggregation of possible existing systems to set
up a system building the basis for a GIS.
4.2 Visualization of Transport
Behaviour
The visualization of the movement-/transport
behaviour is the first step towards the optimization
potential within the transport of production assets.
Basically, the transport is visualized as the
movement itself is recorded and stored as historic
information within a data warehouse described in
section 4.1. Based on recorded timestamps of the
movement and the linking to a specific production
asset an approximation of the movement or transport
is recovered.
To establish the visualization of movements
through a production line, a network structure is
necessary. In order to represent possible walking
ways or transport corridors within a network
accurately, a graph based network is developed.
Such a graph based network exists of edges and
nodes combining equipment in the production line
and facilities which have to be included in a routing
approach – which are defined in the indoor
navigation ontology. Furthermore, the indoor
navigation ontology includes access points to the
indoor space and junctions to enter corridors and
enhance the network with the ability to include
turns. This network is created using a semi-
automatic approach and is the key to the
visualization of transport and the movement.
By considering a graph based network
representing transport ways or walking ways within
a production line, the movement behaviour can be
mapped on the network and visualized. Via a routing
algorithm, for example Dijkstra, it is possible to
create different paths. One path can represent the
real path of the movement based on historically
recorded data, by combining the visited equipment
in a temporal order and tracked positions in between.
Another path, for e.g. the same production asset, can
represent the shortest path that combines the visited
equipment of in a temporal order. Finally, two
possible paths for each production asset can be
GeographicInformationScienceandTechnologyasKeyApproachtounveilthePotentialofIndustry4.0-HowLocation
andTimeCanSupportSmartManufacturing
467
compared with respect to length or areas traversed.
This gives insight in the detailed movement
behaviour and about deviations between the shortest
or optimal path and the path used in reality. The
calculation of real paths based on historical data and
optimal paths can also be implemented in a data
warehouse which is described section 4.1. Therefore,
a spatial database management system, such as
Postgres, has to be extended by a spatial cartridge,
e.g. PostGIS, and a routing extension, e.g.
pgRouting.
In order to monitor the transport behaviour based
on extracted trajectories, it is also possible to sum up
how often edges are traversed by a specific
production asset. This highlights the edges mostly
used and thus could be possible bottle necks or areas
with special transport necessities.
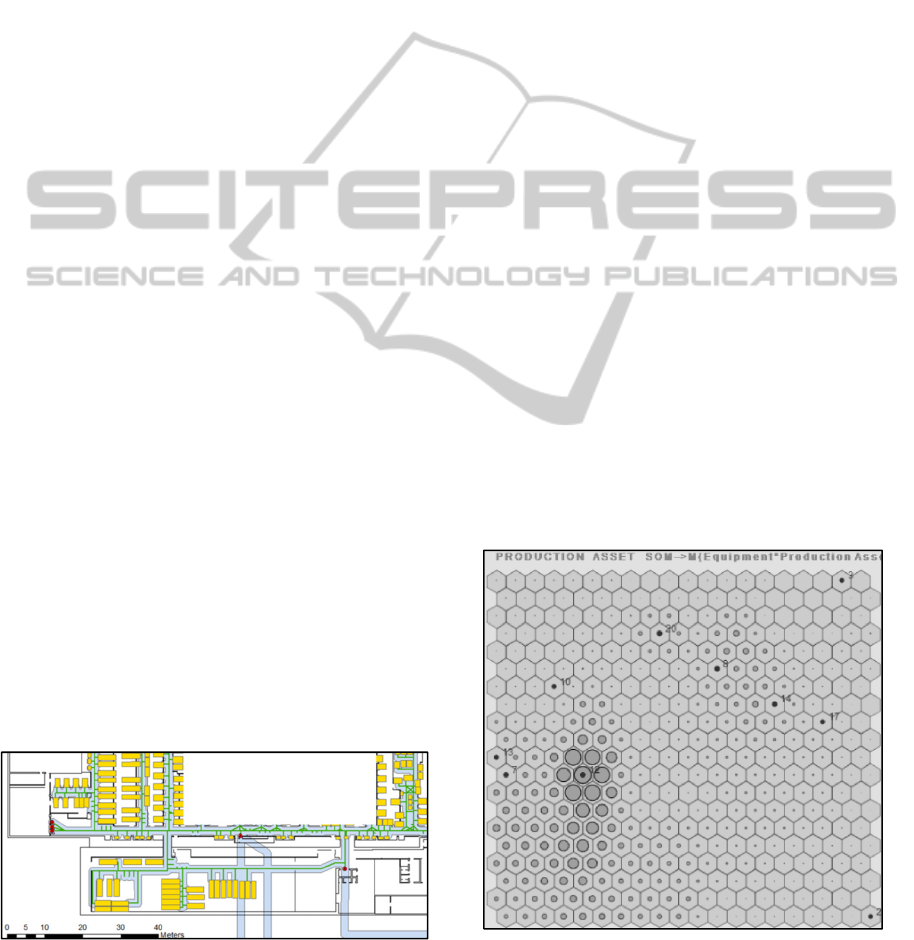
Figure 6 highlights such a visualization using a
graph based network. The graph based network is
visualized using a green colour and connecting the
equipment, facilities and specific nodes enabling the
accessibility to the indoor space in red. A buffer is
created around the network to represent the walking
ways in a more appropriate way and also to compare
the network more easily with real corridors in the
production environment. To connect different
production halls, virtual connections are established
which are marked as blue buffers without a green
network line. Based on this network, extracted tracks
of production assets can be projected and compared.
White spaces are used intentionally to hide detailed
arrangements of equipment.
To sum up, the visualization of the transport or
movement behaviour is based on a graph-based
network which has to be implemented in a semi-
automatic workflow. The network represents
possible walking ways within the indoor production
environment. Paths can be extracted from the
historically recorded data and mapped onto the
network to enable comparisons of paths or the
visualization of bottle necks or critical areas
showing potential to be improved.
Figure 6: Example showing the graph-based network
through the production line environment and possible
walking ways as corridors.
4.3 Analysis of Transport Behaviour
and Quality Measures
The analysis of spatial-temporal patterns of
production assets is important, as especially for
semiconductor production processes quality is a key
to success. The ability to analyse the transport
behaviour and quality implies a conceptualization of
the movement and transport. Based on a
conceptualization it is possible to use SOMs for an
automatic data analysis (Kohonen, 2013). To model
the movement of a production asset, it can be
modelled as a sequence of equipment that shall be or
has been visited by a production asset. These
sequences of equipment can be used to compare
similarities of different sequences and to analyse
how different equipment are present in a sequence.
A similar approach was implemented by Schabus et
al. (2014) highlighting equipment which is used in
similar groups of production assets. Figure 7
highlights a SOM showing the frequency of visited
equipment. This analysis method enables the user to
monitor if production assets have a different quality
according to the likelihood of used equipment.
Figure 7 highlights one randomly selected
component plane of a SOM showing the frequency
of used equipment. By projecting production assets
onto such a component plane, it can be seen if it is
likely if a production asset will be processed by an
equipment. The size of circles within the component
plane represents the likelihood of occurrence, the
bigger the more likely is the processing at this
specific equipment.
Figure 7: SOM showing a component plane of equipment
highlighting the likelihood, if a production asset will be
processed or not.
ICINCO2015-12thInternationalConferenceonInformaticsinControl,AutomationandRobotics
468

In addition to the likelihood of used equipment,
another example uses SOMs to analyse quality
measures of production assets based on an extracted
sequence of equipment until a quality measure is
triggered. This means, that each used equipment of a
production asset is extracted until a quality
measurement is triggered according to a certain pre-
defined threshold. Conceptually, a triggering event
separates the overall sequence of used equipment
into sub-sequences, which will be used to compare
the likelihood of an equipment resulting in a quality
measure. Therefore, the SOM looks similar than in
figure 7 with other component planes and quality
measures are projected onto the SOM.
To compare the SOMs, they are integrated in an
interactive website to explore a TRI-space approach
based on spatial-temporal information of a
production line environment. An example is created
to compare SOMs with other spaces like time and
location. The example implementation results in an
interactive website showing two different types of
SOMs, the location based on a map of the equipment
and a time-slider to add the third component. The
example shows that by changing the time on the
time-slider, quality issues are projected onto the
SOMs highlighting similarities with respect to the
high dimensional attributive space and the triggering
equipment is highlighted in the physical space.
Summing up, the analysis of the transport
behaviour and quality measurements can be made
possible by implementing a neural network
algorithm such as SOM. Furthermore, the
visualization itself bears high potential by
comparing different possible tracks a production
asset has taken or which way would be more
optimal. Spatial-temporal data mining is
implemented to analyse a high dimensional
attributive space which is adjusted due to a
conceptualization of relevant data. Thus, the
exploration and combination is possible by
considering a TRI-space based approach.
5 DISCUSSION AND
CONCLUSION
This research paper elaborates on a GIS based
approach to unveil the potential of smart
manufacturing and Industry 4.0. The emerging
interest in indoor geography, leads to an
interdisciplinary approach coupling GISc, indoor
geography, and smart production or industry 4.0.
To highlight how GIS can support smart
manufacturing, the approach in this paper describes
the integration of existing systems present at
companies and how the combination of different
data may help to gather new insights. A graph-based
network is created that opens up the opportunity to
map the movement of production assets by
extracting the trajectories out of historical data. The
visualization and analysis is done by comparing
different paths such as an optimal path between used
equipment or the tracked path of the production
asset. Hence, the tracks can be mapped on the
network. The spatial-temporal analysis part of the
paper focuses on SOMs. SOMs have the capability
of analysing a high-dimensional attributive space of
big data leading to new knowledge when a visual
exploration is done as follow-up process. This
indicates, that it is possible to gain new knowledge
out of existing data based on the utilization of GISc
and existing data sources.
Future research directions include a variety of
self-learning algorithms to gain new knowledge out
of big data. Furthermore, the general application
field of an indoor production environment bears
huge potential concerning indoor navigation tasks.
Furthermore, the real-time production relevant data
of SCADA systems could be integrated in a
Geographical Information System, which leads to
new decision support possibilities (Back et al.,
2014). Additionally, the paper contributes to indoor
geography such as spatial-temporal analysis of
movements, which helps to develop the simulation
of movement behaviour further.
ACKNOWLEDGEMENTS
The work has been performed in the project EPPL,
co-funded by grants from Austria, Germany, The
Netherlands, Italy, France, Portugal- ENIAC
member States and the ENIAC Joint Undertaking.
REFERENCES
Al Nuaimi, K. and Kamel, H. (2011), A survey of indoor
positioning systems and algorithms, in ‘Innovations in
Information Technology (IIT), 2011 International
Conference on’, IEEE, pp. 185-190.
Ascraft. H., 2008. Building information modeling: A
framework for collaboration. Construction Lawyer,
28(3):1-14, 2008.
Barnes, J., Rizos, C., Wang, J., Small, D., Voigt, G. and
Gambale, N. (2003), ‘High precision indoor and
GeographicInformationScienceandTechnologyasKeyApproachtounveilthePotentialofIndustry4.0-HowLocation
andTimeCanSupportSmartManufacturing
469

outdoor positioning using locatanet’, Journal of
Global Positioning System 2(2), 73-82.
Chrisman, N. R., Cowen, D. J., Fisher, P. F., Goodchild,
M. F., & Mark, D. M. 1989. Geographic information
systems. Geography in America, 353-375.
Compieta, P., Di Martino, S., Bertolotto, M., Ferrucci, F.
and Kechadi, T. 2007, ‘Exploratory spatio-temporal
data mining and visualization’, Journal of Visual
Languages & Computing 18(3), 255-279.
Davis, J., Edgar, T., Porter, J., Bernaden, J., & Sarli, M.
2012. Smart manufacturing, manufacturing
intelligence and demand-dynamic performance.
Computers & Chemical Engineering, 47, 145-156.
De Smith, M. J., Goodchild, M. F., & Longley, P., 2007.
Geospatial analysis: a comprehensive guide to
principles, techniques and software tools. Troubador
Publishing Ltd.
Geng H, (eds), 2005, Semiconductor manufacturing
handbook. McGraw-Hill.
Giudice, N. A., Walton, L. A., Worboys, M. 2010, The
informatics of indoor and outdoor space: A research
agenda. In Proceedings of the 2nd ACM SIGSPATIAL
International Workshop on Indoor Spatial Awareness,
ACM, pages 47–53.
Goetz, M., 2012, Using Crowdsourced Indoor Geodata for
the Creation of a Three-Dimensional Indoor Routing
Web Application. Future Internet 4(2): 575-591.
Goodchild, M. F. 1991. Geographic information
systems. Journal of Retailing,67(1), 3-15.
Gruber. T. R., 1995, Toward Principles for the design of
ontologies used for knowledge sharing? International
journal of human-computer studies, 43(5):907-928.
Hägerstrand, T., 1970. What about people in regional
science?. Papers of the Regional Science Association
24 (1): 6–21.
Janowicz, K., 2008. Observation driven geo-ontology
engineering. Transactions in GIS, 16(3):351-374,
Kohonen, T. (1998), ‘The self-organizing map’,
Neurocomputing 21(1), 1-6.
Kohonen T, 2013, Essentials of the self-organizing map.
Neural Networks, 37:52-65.
Küpper, A., 2005. Location-based services: fundamentals
and operation. John Wiley & Sons.
Back, S., Kranzer, S., Heistracher, T. and
Lampoltshammer, T., 2014, Bridging SCADA
Systems and GI Systems. In: 2014 IEEE World Forum
on Internet of Things (WF-IoT) (WF-IoT 2014),
Seoul, Korea, pp. 41-44.
Li, B., Quader, I. J. and Dempster, A. G. 2008, ‘On
outdoor positioning with wi-fi’, Journal of Global
Positioning Systems 7(1), 18-26.
Longley, P. A., Goodchild, M. F., Maguire, D. J., and
Rhind, D. W., 2011. Geographic Information Systems
and Science. England: John Wiley & Sons, Ltd.
Mautz, R. 2008, Combination of indoor and outdoor
positioning, in ‘1st International Conference on
Machine Control & Guidance’.
Meijers, M., Zlatanova, S., and Pfeifer N., 2005, 3D
geoinformation indoors: structuring for evacuation.
In
Proceedings of Next generation 3D city models,
pages: 21-22.
Nyström, R. H., Harjunkoski, I. and Kroll, A. (2006),
‘Production optimization for continuously operated
processes with optimal operation and scheduling of
multiple units’, Computers & chemical engineering
30(3), 392-406.
Osswald S, Weiss A and Tscheligi M, 2013, Designing
wearable devices for the factory: Rapid contextual
experience prototyping. In: International Conference
on Collaboration Technologies and Systems (CTS)
2013, IEEE, 517-521.
Peuquet, D. J., 2001. Making space for time: Issues in
space-time data representation. GeoInformatica, 5(1),
11-32.
Raubal, M., and Worboys, M.: A formal model of the
process of wayfinding in built environments. In:
Spatial information theory. Cognitive and
Computational Foundations of Geographic
Information Science, Lecture Notes in Computer
Science 1661 (1999) 381-399.
Raubal, M.: Ontology and epistemology for agent-based
wayfinding simulation. International Journal of
Geographical Information Science 15(7) (2001) 653-
665.
Schabus, S., Scholz, J., and Skupin, A., 2014, Spatial-
temporal Patterns of Production Assets in an Indoor
Production Environment. In Proceedings of Workshop
"Analysis of Movement Data'14" Workshop at
GIScience 2014, Poster Presentation, Vienna, Austria.
Web: http://blogs.utexas.edu/amd2014/
Scholz, J. and Schabus, S., 2014, An indoor navigation
ontology for production assets in a production
environment, in ‘Proceedings of GIScience 2014,
Vienna, Austria - Lecture Notes in Computer Science,
Springer’.
Skupin, A. (2010), Tri-space: Conceptualization,
transformation, visualization, in ‘Sixth International
Conference on Geographic Information Science’, pp.
14-17.
Worboys, M. 2012, Modelling Indoor Space. In:
Proceedings of the 3
rd
ACM SIGSPATIAL
International Workshop on Indoor Spatial Awareness,
ACM, pages 1 – 6.
Xiang, Z., Song, S., Chen, J., Wang, H., Huang, J. and
Gao, X. (2004), ‘A wireless lan-based indoor
positioning technology’, IBM Journal of Research and
Development 48(5.6), 617-626.
Yu, H., 2006. Spatio-temporal GIS Design for Exploring
Interactions of Human Activities. Cartography and
Geographic Information Science, 33(1), 3-19.
ICINCO2015-12thInternationalConferenceonInformaticsinControl,AutomationandRobotics
470
