
Discrete Event Simulation in a BRT System
Transmilenio Case
Miguel R. Campos, Juan P. Álvarez and Ciro A. Amaya
Departamento de Ingeniería Industrial, Universidad de los Andes, Bogotá, Colombia
Keywords: Discrete Event Simulation, BRT, Transmilenio, Travel Plan, Decision Making.
Abstract: Recently, the bus rapid transit (BRT) systems have been implemented around the world as an efficient and
low cost mass public transportation alternative. While studying such systems, a common assumption has been
that the user knows and uses the fastest route every time. Therefore, this paper has two main objectives. The
first objective is to model the interactions within a BRT system station, modelling the decision making process
of each user independently with a cost function in which he is able to take a decision depending on different
variables such as the average utilization of a bus or the time arrival of the next scheduled bus. The second
objective is incorporating the stochastic nature of input data, such as arrival rates, origin-destination matrix
or service time into the model. Using this model logic a complete system can be built. Thereby, investigations
that mean to improve the performance of the system can be tested considering the stochastic behavior of the
users during the route plan decision making process.
1 INTRODUCTION
A BRT (Bus Rapid Transit) system is defined as a
flexible massive transportation solution, with rubber
tires, high passenger capacity and low costs of
implementation and operation compared to
alternatives as trains or subways (Danaher et al.,
2007).
In transportation problems, discrete event
simulation offers a valuable tool for analysis as it
allows to forecast results of changes, learning of the
system dynamics and educating the actors involved in
the decision making process (Pursula, 1999).
From a financial perspective, South American
countries have invested more on BRT systems than
other countries around the world. More than 45 Latin
American cities have invested in BRT systems, which
represents 63.6% of the total number of passengers
transported by BRT systems worldwide (Rodriguez,
2013).
Examples of BRT systems that have been
operational for more than 5 years are: Bogotá
(Colombia); Curitiba (Brasil); Goiânia (Brasil);
Ciudad de Guatemala (Guatemala); Guayaquil
(Ecuador); Quito (Ecuador); and the metropolitan
area of São Paulo (Brasil), specifically the “ABD”.
Together, these cities represent the 16% of the total
number of passengers transported by BRT systems
worldwide, and the 31% of the same statistic in Latin
America (Rodriguez, 2013).
Several work has been published referring to the
routes design and frequencies problem in the public
systems of transportation. Exact and heuristics
methods have been tested, and the results promise to
improve the system performance (Medaglia,
Walteros, and Riaño, 2015). Other fields that have
approached the transportation systems performance
are the probabilistic modelling (Watling and
Cantarella, 2013), fuzzy logic (Lo and Chang, 2012),
simulation (Sarvi, et al, 2010), Petri Nets (Mejia,
2008) and genetic algorithms (Karlaftis and
Vlahogianni, 2011), among others. In general, the
stochastic nature of the decision making process of
the user is not directly involved in previous work, or
there are other stochastic factors that are left out of
the modelling process.
Transmilenio is the BRT that operates in Bogotá
since the year 2000. According to the Asociación
Latino-Americana de Sistemas Integrados y BRT,
Transmilenio is considered as the world leader
transportation system for its effectiveness, reach and
implementation success as one of the largest BRT
systems in the world (SIBRT, 2013). Given its
influence worldwide, and its impact on the
transportation process of a capital city with over 8
million people, a model that allows to evaluate the
476
Campos M., Álvarez J. and Amaya C..
Discrete Event Simulation in a BRT System - Transmilenio Case.
DOI: 10.5220/0005515004760481
In Proceedings of the 5th International Conference on Simulation and Modeling Methodologies, Technologies and Applications (SIMULTECH-2015),
pages 476-481
ISBN: 978-989-758-120-5
Copyright
c
2015 SCITEPRESS (Science and Technology Publications, Lda.)

changes in performance, is a useful and meaningful
tool for public policy formulation.
In this paper, the main objective is to model a
BRT station. The model is intended to be used in
future research with a “Lego Approach” for building
a complete BRT system and applying it to the
Transmilenio case. We tend to draw a general
guideline for future investigations that tend to
evaluate and diagnose complete massive
transportation systems towards improvement of
performance measurements. The innovation factor
would consist in introducing stochastic elements in
two components. First, the decision making process
of a user that can select a service using a cost function.
The second component, is the variability of input
data. In the following sections of this paper, we will
discuss the assumptions and logic surrounding a
single station model.
2 ASSUMPTIONS
Each person or entity will choose one of the three
fastest route plans in order to get to its destination.
These three route plans are called candidate route
plans.
A person will assign a cost function value to each
of the first services of three candidate routes based on
the user’s profile standardized value of four variables:
• Number of entities standing in line
• Travel time
• Bus average utilization
• Time remaining for the bus to arrive
The weight or coefficient of each of the four variables
is determined by the decision profile of the person.
The choice of the route will be determined by the
lowest cost function. The term “route” should be
interpreted as the travel plan of an entity (including
transfers between stations) and it is different from a
“service”, which is the identification of a bus station
sequence.
People entities are familiar with the three fastest
routes. These are the candidate routes or travel plans
of the user.
A station wagon is where buses stop and it is also
where persons stand in line. In this manner, for
example if a bus stops at wagon 3, only the persons
standing in line in wagon 3 can get on the bus.
Persons will get inside the bus in the same order they
arrived to the queue.
There are no accidents on the bus roads ans
simulation time will go from 5 a.m. to 9 a.m. and the
warm up period will go from 5 a.m. to 6:30 a.m. in
order to initiate the recollection period when the
system is in its equilibrium state.
Bus entities start their path at a programmed hour
and, after completing their sequence, they are
disposed. Services identifications are assigned by the
company optimization software.
Entities heading north occupy a different line
from the entities heading south. This same happens
when heading east/west.
Dijkstra algorithm is used iteratively for finding
the shortest path between all origin-destination in the
directed graph that represents the BRT system.
3 METHODOLOGY
DESCRIPTION
The logic of a single station was built, and the flow
chart of the users and buses flow through the system
is shown in the next figure. Section 3.1 explains the
important facts of the users flow logic, and section 3.2
explains the important facts of the buses flow logic.
3.1 Users Flow Logic
3.1.1 Users Entrance
The user entrance is read from an outer file that
contains the number of arrivals to a specific station in
intervals of 15 minutes. The time between arrivals in
this time frame is assumed to be uniformly
distributed.
3.1.2 Destination and Profile Assignments
The destination attribute is assigned to each user
based on an origin-destination probability matrix. The
dimension of this matrix is NxN where N is the total
number of stations in the system. The equation (1)
shows the calculation of the origin-destination
probability matrix.
,
=
,
∑
,
∀ ∈
(1)
The profile assignment is based on the
information recollected through 660 surveys in which
users define the percentage of time they are in a hurry.
After defining the portion of users that are time
pushed while using the system, the respondents
determine the weight of each of the four variables
explained in assumption 2.
Finally, a set of profiles are created and each one
of them is assigned with an occurrence probability
based on the frequency of “representative” decision
DiscreteEventSimulationinaBRTSystem-TransmilenioCase
477
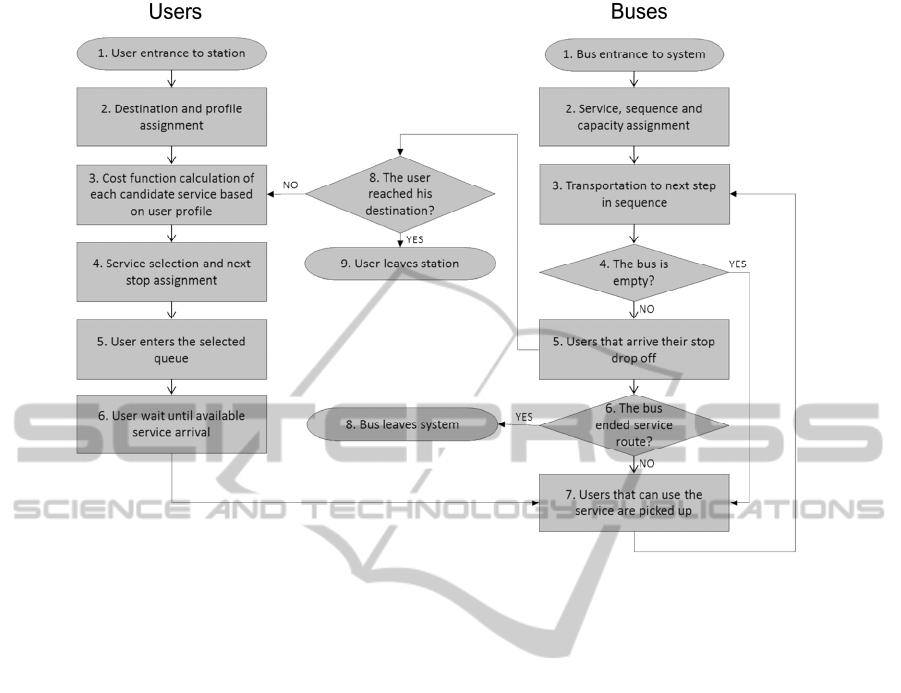
Figure 1: Flowchart of entities.
making profiles. A representative profile is build up
from a clustering process that returns the variables
coefficients as an average of its internal singular
profiles values.
3.1.3 Cost Function Calculation
Each time a user arrival event takes place, a cost
function is calculated for each of the first services
from each of the three candidate route plans a user
may pick from. The cost function is calculated as a
ponderation of the variables values and the
coefficients provided by the user’s profile. The values
of the variables are first standardized so their domain
ranges from 0 to 100. Finally, a user will pick the
route plan if its first service has the lowest cost
function.
3.1.4 Service Selection and next Stop
Assignment
Once the user is assigned to a service, he/she is
headed to the corresponding waiting queue in which
he/she will remain until the arrival of the bus entity.
Simultaneously, a next station stop attribute is
assigned to the user based on the chosen route
sequence.
3.2 Buses Flow Logic
3.2.1 Buses Entrance
The buses entrance is read from an outer file that
contains the exact time in which a bus starts its
sequence.
3.2.2 Bus Attributes
The service, the sequence and the capacity are some
of the main attributes of a bus entity. The service ID
attribute is assigned based on an outer file provided
by the transportation company. This file can be
modified by the user in order to test the behavior of
the system under different input conditions. After
assigning the service attribute and depending on its
value, sequence and capacity attributes are
determined. The sequence attribute refers to the set of
stations a certain service must visit whether the
capacity attribute refers to the number of users that fit
inside the bus entity.
3.2.3 Transportation to next Step in
Sequence
Once the sequence is assigned, the bus entity is
transported to its initial station with a delay time of 0.
SIMULTECH2015-5thInternationalConferenceonSimulationandModelingMethodologies,Technologiesand
Applications
478

Afterwards, in each station, the bus will be routed to
its next station incurring in a time that depends on the
distance between its actual station and its next stop
and average transportation speed of the bus.
3.2.4 Is the Bus Empty?
Once a bus entity arrives to a station it stops at the
assigned station wagon. If the bus is not empty, the
first event that takes place is the unload process of the
passengers that are inside the bus, if the bus is empty,
it goes right to the boarding process. Finally, the bus
entity continues its sequence or leaves the system in
case it’s in the final station of its sequence.
4 VERIFICATION
The station model built was verified in order to assure
that the decision making process of the users is
working properly. To do so, Transmilenio S.A. shared
data of arrivals, services, origin-destination matrix
among others, in order to verify the model logic and
to build the final model of the system. A model of five
stations of the real system was built considering one
unique station origin and four possible destinations.
The 3 fastest services for each possible destination are
shown in Table 1 and the travel time in seconds is
shown in Table 2.
Table 1: Candidate services for each possible destination.
Service
Destination 1 2 3
Calle 100 H74 G12 F14
Heroes F14 G5 F1
P Norte B72 B53 B14
Virrey L18 G5 F1
Table 2: Travel time between origin and destination in
seconds.
Service
Destination 1 2 3
Calle 100 720 840 840
Heroes 600 780 780
P Norte 240 300 360
Virrey 480 600 600
The average utilization of each service was set so the
fastest service (service 1) would have the highest
utilization, the second fastest service (service 2)
would have the second highest utilization and the
slowest service (service 3) would have the lowest
utilization as shown in Table 3.
Table 3: Average utilization per service.
Service
Average
utilization
L18 0.7
F1 0.45
G5 0.6
G12 0.45
B14 0.45
F14 0.7
B72 0.7
B53 0.6
H74 0.7
In order to verify the logic of the decision making
process, 5 scenarios were tested changing the
coefficients of the cost function of the users. Table 4
shows a description of each scenario.
Table 4: Scenarios.
Scenario Description
1
The cost function has the original coefficients
found in the clustering process
2
The coefficient of the travel time is set to 1
and the others to 0 (Travel time is all that
matters)
3
The coefficient of the bus average utilization
is set to 1 and the others to 0 (Bus average
utilization is all that matters)
4
The coefficient of the time remaining for the
bus to arrive is set to 1 and the others to 0
(Time remaining for the bus to arrive is all
that matters)
5
The coefficient of the number of entities
standing in line is set to 1 and the others to 0
(Number of entities standing in line is all that
matters)
The objective of this experiment is to identify the
change in the average number of times each service
(1, 2 or 3) is selected by the users to get to their
destination in each scenario. Results of the
experiment are shown in Figure 2. The results show
consistency with the expected behavior for each
DiscreteEventSimulationinaBRTSystem-TransmilenioCase
479
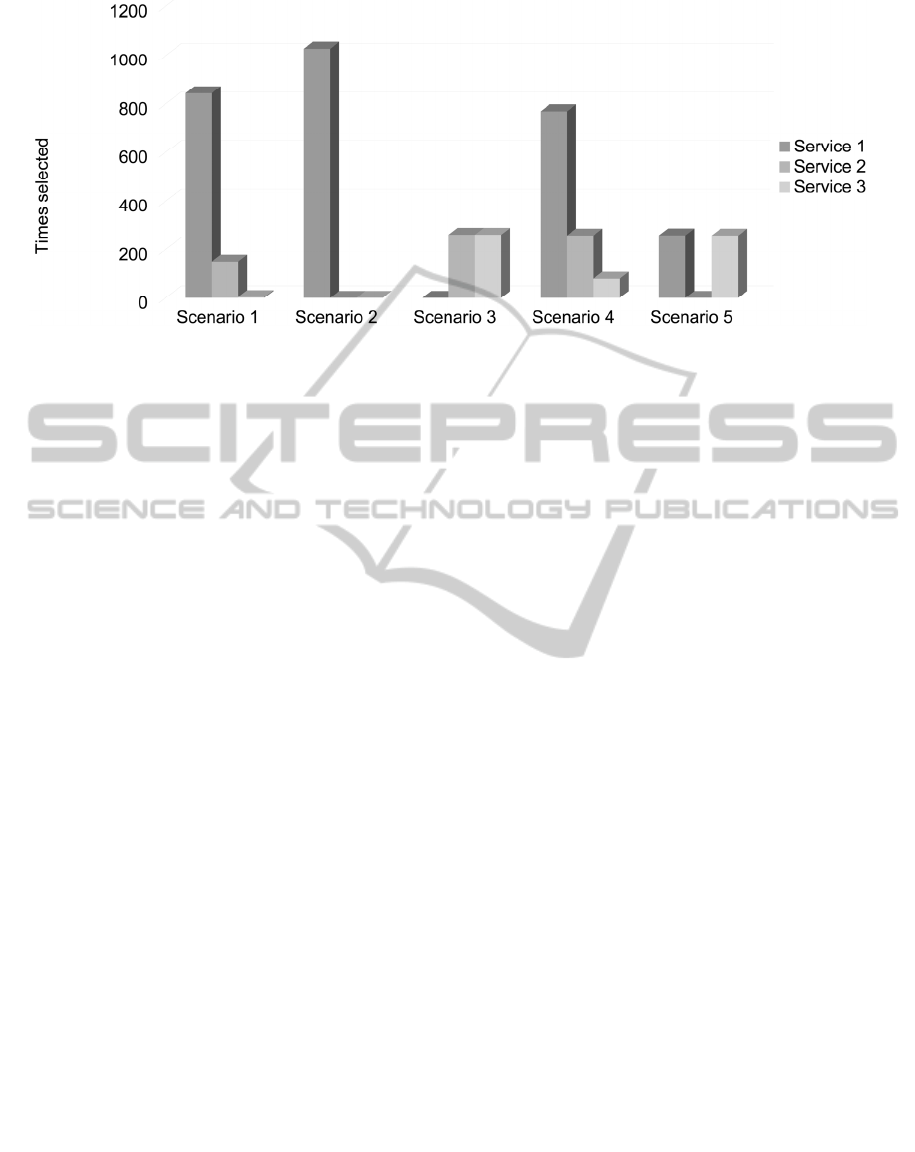
Figure 2: Number of times a service is selected per scenario.
scenario. For example, in scenario 2 all the users
selected the fastest service, as the only important
criteria is the travel time and in scenario 4, the
proportion is similar to the scenario 1, as the time
remaining for the bus to arrive is independent from
the attributes of the service.
5 CONCLUSIONS
The methodology applied to the construction of the
simulation model allows to represent the behavior
inside one station of a BRT system. The model is
flexible enough to include new services, new stations,
new decision variables or behaviors of the decision
makers, different times of travel and different
frequencies of both arrivals and buses services.
Each user is modeled as an independent decision
maker that has a unique cost function. This allows the
model to represent different decision behaviors
incorporating four concrete decision variables: total
travel time, the bus average utilization, the time
remaining for the next service arrival and the number
of people in queue.
The main innovation of this work is including the
decision making process of each user in the model
results and stochastic elements as the variability of
the arrivals, the origin-destination matrix and the
transportation times. The methodology presented is
meant to be a tool for testing alternatives and
proposing changes that improve the system
performance measures of BRT systems.
6 FUTURE WORK
For the second phase of this project, the main
objective is to create a Template with a station
module presented on this paper that will allow the
construction of the complete Transmilenio system
and to validate the model. With the validated model
the objective is to test diverse proposals made by
other researchers and propose original alternatives, in
order to evaluate better ways to operate the system for
improving efficiency.
REFERENCES
Danaher, A., Levinson, H., and Zimmerman, S., 2007. Bus
rapid transit practitioner's guide, TCRP Report.
Retrieved from http://onlinepubs.trb.org/onlinepubs/
tcrp/tcrp_rpt_118.pdf.
Karlaftis, M., and Vlahogianni, E., 2011. Statistical
methods versus neural networks in transportation
research: Differences, similarities and some insights.
Transportation Research Part C, 387-399.
Lo, S., and Chang, W., 2012. Design of real-time fuzzy bus
holding system for the mass rapid transit transfer
system. Expert Systems with Applications, 1718-1724.
Medaglia, A., Walteros, J., and Riaño, G., 2015. Hybrid
Algorithm for Route Design on Bus Rapid Transit
Systems. Transportation Science, 66-84.
Mejia, G., 2008. Modelling and Simulation of a Route from
the Mass Public-Transportation System TransMilenio
via Colores Stochastic Petri Nets. Retrieved from
https://biblioteca.uniandes.edu.co/visor_de_tesis/web/
?SessionID=L1Rlc2lzXzEyMDA5X3NlZ3VuZG9fc2
VtZXN0cmUvMTE4OC5wZGY%3D.
Pursula, M., 1999. Simulation of Traffic Systems - An
overview. Journal of Geographic Information and
Decision Analysis, 1-8.
SIMULTECH2015-5thInternationalConferenceonSimulationandModelingMethodologies,Technologiesand
Applications
480

Rodriguez, D. A., 2013. Sistemas de transporte público
masivo tipo BRT (Bus Rapid Transit) y desarrollo
urbano en América Latina. Land Lines, 1.
Sarvi, M., Duong, V., Toledo, T., Cats, O., Burghout, W.,
and Koutsopoulos, H., 2010. Mesoscopic Simulation
for Transit Operations. Transportation Research Part
C: Emerging Technologies, 896-908.
SIBRT., 2013. Asociación Latino-Americana de Sistemas
Integrados y BRT. Retrieved from
http://www.sibrtonline.org/plenarios/19/
Watling, D., and Cantarella, G., 2013. Model
Representation and Decision-Making in an Ever-
Changing World: The Role of Stochastic Process
Models of Transportation Systems.
DiscreteEventSimulationinaBRTSystem-TransmilenioCase
481
