
Defining and Evaluating Software Project Success Indicators
A GQM-based Case Study
Luigi Lavazza
1,2
, Enrico Frumento
1
and Riccardo Mazza
3
1
CEFRIEL, Via Fucini, 2, Milano, Italy
2
Dipartimento di Scienze Teoriche e Applicate, Università degli Studi dell’Insubria, Varese, Italy
3
WIND, Ivrea, Italy
Keywords: Software Measurement Process, Goal/Question/Metrics, GQM, Key Performance Indicators, KPI, Success
Indicators.
Abstract: KPI (Key Process Indicators) and success indicators are often defined in a rather generic and imprecise
manner. This happens because they are defined very early in the project’s life, when little details about the
project are known, or simply because the definition does not follow a systematic and effective methodology.
We need to precisely define KPI and project success indicators, guarantee that the data upon which they are
based can be effectively and efficiently measured, and assure that the computed indicators are adequate with
respect to project objectives, and represent the viewpoints of all the involved stakeholders. A complete and
coherent process for managing KPI and success indicators lifecycle –instrumented with specific techniques
and tools, including the Goal/Question/Metrics (GQM) method for the definition of measures and the R
statistic language and environment for analyzing data and computing indicators– was applied in the
evaluation of the European research project MUSES. The MUSES case study shows that the proposed
process provides an easy and well supported path to the definition and implementation of effective KPI and
project success indicators.
1 INTRODUCTION
KPI and success indicators are usually defined very
early in the project’s life, often even before starting
the project. As a consequence, they tend to be
defined in a rather generic way and with no precise
context. Important details –such as the data upon
which they have to be computed, or how such data
are measured– are very often omitted, simply
because the knowledge that is necessary to clarify
these details is not yet available. Therefore, it is
generally convenient (sometimes even necessary) to
revise the definitions of the KPI and success
indicators in the light of such increased knowledge.
In this paper, we describe a process of refining
KPI and success indicators’ definitions and the
consequent data collection, analysis and evaluation
activities. The methods that can be used in process
activities are also described. The considered process
is expected to provide convincing answers to the
following questions, which usually are left
unanswered (sometimes they are not even explicitly
formulated):
− What is the purpose of each specific KPI or
indicator, i.e., what does it mean, actually?
− Is the purpose of the KPI or indicator coherent
with the actual needs of the project?
− Is there agreement on the definition of the KPI
or indicator? In particular, is there agreement
between the people who carry out the project to
deliver a software product and the people who
will use and/or will pay for the product?
− KPI or indicators’ definitions typically involve
the measurement of products or processes. Are
these measurements well defined? Can they be
performed at reasonable costs?
− How are KPI and indicators computed and
visualized?
In many cases, even though the project owners have
a fairly good knowledge of the project, they do not
use such knowledge effectively in the definition of
KPI and success indicators, just because they do not
follow a proper methodology that provides
guidelines for the definition and computation of KPI
and success indicators.
In this paper we illustrate and evaluate –via a
case study– a process that can be used to define KPI
and success indicators in software development
105
Lavazza L., Frumento E. and Mazza R..
Defining and Evaluating Software Project Success Indicators - A GQM-based Case Study.
DOI: 10.5220/0005517301050116
In Proceedings of the 10th International Conference on Software Engineering and Applications (ICSOFT-EA-2015), pages 105-116
ISBN: 978-989-758-114-4
Copyright
c
2015 SCITEPRESS (Science and Technology Publications, Lda.)
projects. Namely, the process is applied to the
evaluation of the MUSES (Multiplatform Usable
Endpoint Security) project. MUSES is a research
project partly funded by the EU (MUSES, 2014).
The purpose of MUSES is to foster corporate
security by reducing the risks introduced by user
behavior. To this end, MUSES provides a device-
independent, user-centric and self-adaptive corporate
security system, able to cope with the concept of
seamless working experience on different devices, in
which a user may start a session on a device and
location and follow up the process on different ones,
without corporate digital asset loss.
The remainder of the paper is organized as
follows. Section 2 presents a complete process for
the definition of KPI and the enactment of the
activities through which measures are collected and
indicators are computed. Section 3 describes the
definition of KPI and success indicators via GQM.
Section 4 shows how the schema of the measure
database can be defined on the basis of the
knowledge gained during the definition of GQM
plans. Section 5 deals with the interpretation of the
collected data, and the precise definition of how KPI
and success indicators have to be computed. Section
6 illustrates the obtained indicator values and their
visualization and discusses the final evaluation of
the delivered KPI and success indicators. Section 7
accounts for related work, while Section 8 draws the
conclusions and outlines future work.
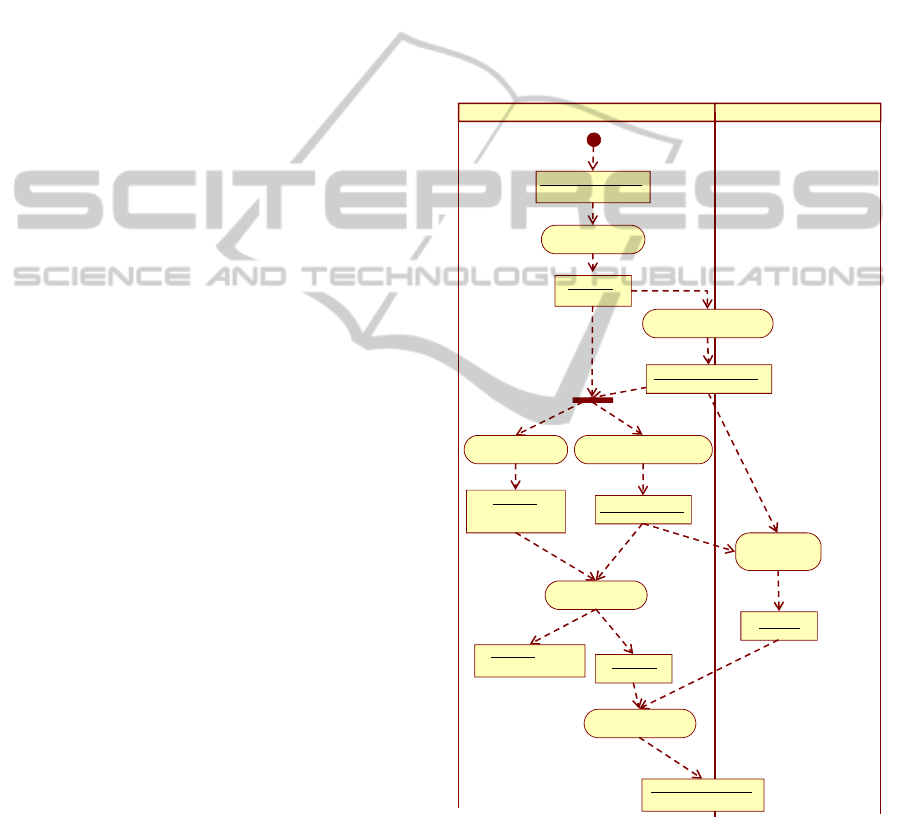
2 THE EVALUATION PROCESS
To achieve the objectives mentioned in the
introduction, a coherent and comprehensive process
is needed: the UML activity diagram in Figure 1
describes such process.
Activity GQM_goal_definition aims at specifying
what the purpose of KPI or success indicators is, i.e.,
what they actually mean. This activity is performed
according to the GQM method. Usage of tools
supporting the GQM is advisable, but not
mandatory.
Activity Product&Process_modelling assures that
the KPI and success indicators are coherent with the
properties of the product or process they refer to.
Product or process analysis is performed according
to typical analysis methodologies; models are
written in UML.
Activity GQM_plan_definition assures that the
measurements required by KPI and success
indicators are well defined and can be performed at
reasonable cost. This activity is performed according
to GQM. Usage of tools supporting the GQM is
advisable, but not mandatory.
Activity Measure_DB_schema_design is carried
out with the purpose that evaluators and developers
agree on the data to be provided by measurement
activities; it guarantees that the right data are
provided, and the data are provided right, i.e., as
required for evaluation. UML class diagrams can be
used for conceptual modelling.
In activity Project_Trials, the process to be
evaluated is carried out, and measures are collected.
Actually, “Project trials” is MUSES terminology to
indicate beta testing. The process is instrumented to
provide the required measures.
Figure 1: A process for the systematic definition and
computation of KPI and project success indicators.
Review and validation of measures are also
performed before using the collected data, to further
increases the confidence on the validity of the
representativeness of measures, hence of the derived
indicators. Depending on the specific process/
KPI&success_indicators
GQM_goal_definition
GQM_plan
[original definition]
[goals defined]
Evaluators
GQM_plan_definition
GQM_plan
Measure_DB_schema_design
DB_logical_schema
Indicators_definition
GQM_plan
R_function
Project_Trials
Measures
Indicator_computation
[questions and
metrics defined]
[interpretation defined]
Project developers and users
Product&Process_modeling
Product&process_model
KPI&success_indicators
[computed]
ICSOFT-EA2015-10thInternationalConferenceonSoftwareEngineeringandApplications
106
product, measurement tools, questionnaires,
monitoring activities, etc. can be used.
Activity Indicator_definition provides a well
defined (actually, a formal and executable)
(re)definition of KPI and success indicators, also
highlighting what data are used and how. The R
language is used to code the data analysis and
processing that yields KPI and success indicators.
Activity Indicator_computation presents indicators
in a form that can be easily understood by users and
stakeholders, and whose representativeness of the
actual product and process can be easily assessed.
The R environment is used to compute KPI and
success indicators and graphically represent them.
3 USING GQM TO DEFINE KPI
AND SUCCESS INDICATORS
KPI and success indicators are (re)defined as GQM
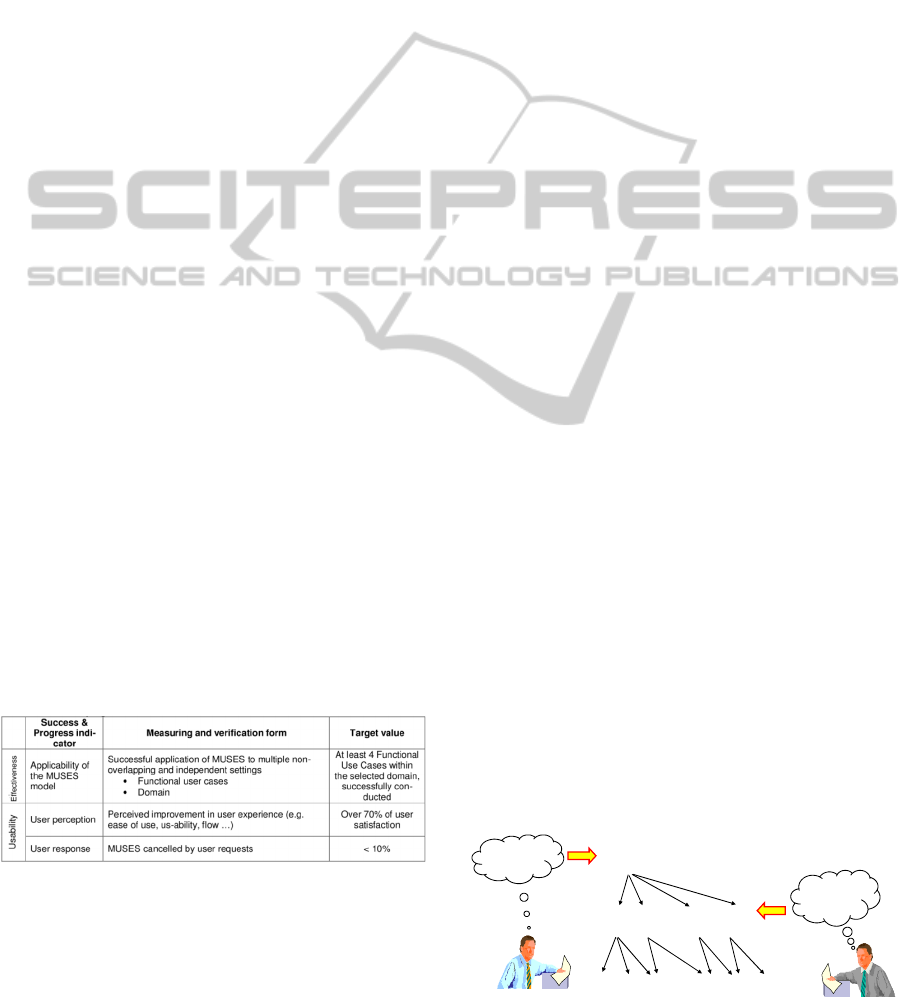
goals. We start from the indications given in the
MUSES Description of Work (DoW): The
achievement of the project objectives will be
measured based on the success and progress
indicators given in Table 1. The indicators will be
revised and updated in the course of the project in
order to reflect the detailed user needs and related
technical objectives of the project.
In Table 1, the success and progress indicators
are given without specifying why they have been
introduced and what quality they are intended to
represent. In an evaluation activity, one should
always start from the definition of the evaluation
goal, so that the data to be collected and the
indicators to be used can be consequently defined.
These ideas were formalized in the GQM technique
(Basili, Rombach, 1988) (Basili, Weiss, 1984)
(Basili et al., 1994).
Table 1: A few success indicators from MUSES DoW.
3.1 The GQM
In general, every project calls for specific measures
and evaluation criteria, depending on the specific
goals of the projects. The GQM method is a general
purpose, goal-driven method, which has been
successfully used in several evaluation activities
(Fuggetta et al., 1998) (Birk et al. 1998) (van
Solingen, Berghout, 2001). The GQM provides a
systematic approach to formalize the goals of a
project and to refine them into a measurement plan.
A GQM plan is organized into a few levels: at
the topmost level, one or more goals are specified.
Each goal includes: an object (what is evaluated:
typically a process, an activity or a product); a
quality (i.e., the characteristic(s) of the object that
have to be evaluated); a purpose (such as evaluation,
analysis, understanding, etc.); a point of view (since
the same objective may be evaluated differently by
the producer and the user, for instance); an
environment (where is the object evaluated: as for
the point of view, the environment can affect the
evaluation).
As shown in Figure 2, a GQM goal is always the
formalization of needs: it must be clear where the
goals come from and why it was conceived.
An example of a goal is: “Evaluate the
throughput of a given process, from the point of
view of the process manager, in environment X”.
For every goal, an “abstraction sheet” is built. It
identifies 4 groups of items.
1) Quality foci (QF): the qualities of interest.
2) Variation factors (VF): variables that are not of
interest themselves, but can affect the values of
the measures associated to the quality foci.
3) Baseline hypotheses (BH): the expected values
for quality foci and variation factors. These
will be used in the analysis of the data.
4) Impact of variation factors on baseline
hypothesis: how VF are expected to affect BH.
The abstraction sheets are a preparation step to
address the operational level of the plan: for every
element of the abstraction sheet, one or more
questions are defined. These are used to describe the
object of the study and the attributes, properties,
characteristics and aspects that should be taken into
considerations. Accordingly, questions have to be
defined having in mind a model of the objects of
measurement and of the environment where the
measurement will be carried out and the results will
be used. The existence of such model is highlighted
in Figure 2.
Figure 2: GQM goal, questions and metrics.
Goal (object, quality, purpos e, point of view,
environment)
Needs and
objectives
Process&
product
model
Q3 Q4
M1 M2 M3
Q1 Q2
M4 M5 ...
DefiningandEvaluatingSoftwareProjectSuccessIndicators-AGQM-basedCaseStudy
107

The final level is the metric level, which is
quantitative. According to the model defined at the
questions level, a set of metrics is identified.
Measurement activities will provide data (i.e., a
quantitative knowledge of the elements of the
model) that will allow answering the questions.
The process of defining a GQM plan is thus a
top-down refinement, from the goals to the metrics.
Once the measurement has been performed, the
GQM plan guides the interpretation of data in a
bottom-up way. Measures provide the data
associated with the metrics definitions. The analysis
of such data provides answers to questions. The
answers contribute to achieving the goal.
The GQM method is general-purpose; however,
it has been proposed in the software engineering
arena, as a reaction to the idea of predefined
measures and criteria for interpreting them. The
spirit of the GQM is that individual process and or
products call for specifics sets of measures and
criteria for interpreting them. A possible strategy is
to identify the measures that characterize the process
or product being examined, and set target values for
the measures that characterize it. The measurements
are performed only a-posteriori, to check if the target
has been reached. In any case, the GQM is an
extremely flexible conceptual tool, which can be
easily adapted to a great variety of situations.
Finally, it has to be noted that GQM plans are
conceptual plans, without indication of the resources
to be employed, the timing and duration of activities,
etc. All these issues have to be tackled in the
creation of the execution and evaluation plan, which
will provide traditional plans in the form of Work
Breakdown Structure, Gantt charts, etc.
The GQM has been used in the evaluation of
several EU funded projects as well as in industrial
settings (Lavazza 2011) (Lavazza, Mauri, 2006).
3.2 Definition of KPI as GQM Goals
In this section we show how KPI and success
indicators can be redefined –at a high level– as
GQM goals. This section describes in detail activity
GQM_goal_definition of the process in Figure 1.
To limit the length of the paper, we considered
only a few of the MUSES KPI and success
indicators (namely, those given in Table 1). We
started by analyzing the first row of Table 1
critically, considering how MUSES is structured
internally and in which contexts it is intended to be
used. It emerged that:
− MUSES is shaped around several different
general working scenarios (named “use cases”,
or “UC” in the project). Not all UC are
exercised in all domains, but are generic enough
to adapt to different situations; UC are the
building blocks of most of the situations where
MUSES adds layers of security. Accordingly, it
is important to evaluate all the relevant (UC,
domain) pairs.
− The evaluation activity has to address two
complementary aspects: 1) the applicability of
MUSES in all the scenarios in which it is
intended to be used, 2) the success of the
application of every MUSES UC. By the way,
in the original definition, it was not clear what
“successfully conducted” should mean.
− Although MUSES will be usable in many
application domains, in the context of the
research project it will be tested in only a couple
of domains. Accordingly, the KPI and success
indicators evaluated within the project have to
make reference only to the domains in which
the tests are carried out.
So, the first row of Table 1 can be stated as a GQM
goal as follows:
Goal 1. Evaluate the applicability of
MUSES UCs in selected domain-specific
scenarios from the point of view of the
companies operating in such domains.
To define KPI and success indicators we use the
GQM, therefore we start from GQM goals. Part of
the knowledge about the product acquired during the
definition of the GQM goals is not embedded in the
goal definition, rather it is used in the definition of
the GQM plan, which is discussed in Section 3.3.2.
In the MUSES project, we reformulated all the
indications given in Table 1, even when the resulting
GQM goal definition is very close to the original
definition. For instance, the second last row in Table
1 led to formulating the following GQM goal:
Goal 11. Evaluate the MUSES framework
with respect to perceived user experience, in
the selected industry domains from the point
of view of domain users.
In this goal, the “perceived user experience” has to
be further specified, since there are so many factors
that can affect the user experience. The detailed
definition of “user experience” within MUSES is
specified in Section 3.3.3).
3.3 Detailed Definition of KPI and
Success Indicators via a GQM Plan
Having defined the QM goals, the next step consists
of refining the goals into questions and metrics. Here
is where the GQM is most useful: via a step-by-step
ICSOFT-EA2015-10thInternationalConferenceonSoftwareEngineeringandApplications
108
refinement, we make sure that the metrics
definitions obtained at the end of the process are
coherent with the goals, and take into consideration
a) all the issues connected with the product or
process to be evaluated, and b) the points of view of
the involved stakeholders.
3.3.1 Product & Process Modelling –
MUSES Activities Relevant for Goal 1
The definition of an effective measurement plan
must include the definition of a model of the
empirical, real-world context in which the
measurement is to take place (Birk et al., 1999). The
GQM does not prescribe how one should represent
or document such model, which includes the
knowledge of the relevant product and process. It
was suggested that such knowledge can be
represented via UML models (Lavazza, Barresi,
2005): here we follow such proposal.
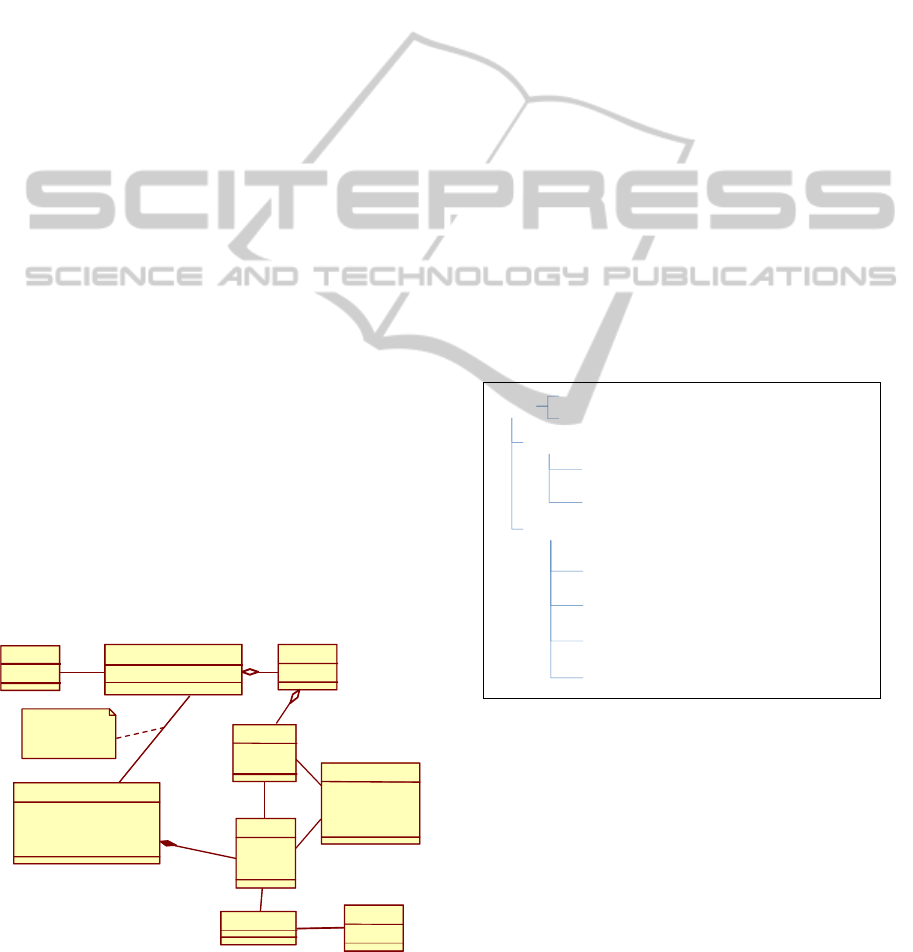
The class diagram given in Figure 3 illustrates
the elements of the MUSES testing and evaluation
activities, upon which the evaluation of the project is
based. Several important pieces of information are
given in the diagram:
− In each domain, a specific configuration of
MUSES is used. Every configuration includes a
possibly different set of UC. These are the UC
that are useful in the domain where the
particular MUSES configuration will be used.
− Every MUSES configuration is used in one or
more trial session. There are trial sessions where
no MUSES configuration is used. These
sessions are useful to get data on the behaviour
of a domain not equipped with MUSES, so that
comparisons between the without-MUSES and
with-MUSES situations become possible.
Figure 3: Conceptual model of MUSES testing and
evaluation activities that are relevant to Goal 1.
− MUSES UC are characterized in terms of UC
features. Trial activities exercise UC features.
− The execution of UC features within an activity
is observable, hence it can be classified with
respect to completeness and correctness.
− Trial activities are carried out in specific
contexts, whose main characterization is given
by the participating users’ roles.
3.3.2 GQM Plan Definition – Goal 1
By taking into account the situation described in
Figure 3, we can identify the following QF and VF:
− Quality focus: Application of MUSES UC.
− Variation factor: Application domain.
Then, still making reference to Figure 3, we can
derive the following questions:
Q1.1 How many UC were executed per domain?
Q1.2 How many UC were successfully applied in
each domain?
Figure 3 indicates that although the MUSES
evaluation is carried out at the granularity level of
UC, we need to consider that every trial activity
involves a set of UC features. Accordingly, question
Q1.1 was associated with metrics that account for
both UC and UC features (see Figure 4).
Figure 4: GQM plan of Goal 1.
Question Q1.2 was associated with the metrics
shown in Figure 4, which account for the fact that
the absolute number of successful executions of UC
features is not relevant per se, rather it is the ratio of
successful execution to total executions that
provides a clear idea of MUSES success rate.
3.3.3 Product & Process Modelling –
MUSES Activities Relevant for Goal
11
When considering the second last row in Table 1–
Domain
+Name
UC
+ID
MUSES configuration
+Context_detection_enabled
*
1
1
0..1
*
User
+Role
Activity
+ID
+Description
+Duration
Trial_session
+ID
+Duration
+Description
+SystemDownTime_dueToUsers
1..*
Context
UC_Feature
+Ref
+Description
Feature_execution
+Id
+Date
+Completed: Boolean
+Successful: Boolean
Trial sessions can be
carried out with
or without involving
MUSES
Goal 1
VF: Application domain
QF: Application of MUSES UC
Q1.1:
Q1.2:
M1.1.1: The number of UC exercised in each
domain
M1.1.2: The number of UC features executed in
each domain
How many UC were applied successfully for each
domain?
M1.2.4: Percentage of successfully exercised UC
wrt the total UC exercised
M1.2.1: The number of UC features successfully
executed in each domain
M1.2.2: The number of UC successfully exercised
in each domain
M1.2.3: Percentage of successfully exercised UC
features wrt the total UC features executed
How many UC were executed per domain?
DefiningandEvaluatingSoftwareProjectSuccessIndicators-AGQM-basedCaseStudy
109
which was formalized by the definition of Goal 11 in
Section 3.2– we found different problems than with
the indicators considered previously:
− The characterization of user experience is
incomplete, as only a few properties –namely,
ease of use, usability and flow– are mentioned.
Besides, the mentioned properties are not well
defined: for instance, the meaning of “flow” is
not easy to determine. This point is particularly
important, because the evaluation of the
perceived user experience is by definition
subjective, hence each user could interpret
differently the meaning of the mentioned
experience aspects.
− Having multiple experience aspects, composing
a single satisfaction measure is a problem. It
should also be decided if this composition is
made by the user him/herself, who has to
express a single satisfaction measure, or the user
evaluates separately his/her satisfaction with
respect to ease of use, usability, flow, etc. and
the global user satisfaction is computed later by
the project evaluators.
− The measure of user satisfaction is not defined.
In particular, user satisfaction is hardly
expressible as a Boolean value. Usually values
of this type are measured via Likert scales
(Likert, 1932), in which case the level
considered satisfactory has to be identified. If
scale rates are “Very dissatisfied”, “Moderately
dissatisfied”, “Moderately satisfied”, “Very
satisfied”, one could place the threshold at the
“Moderately satisfied” or “Very satisfied” level.
To clarify all these issues, we proceeded as for the
previously described goals, i.e., we built a
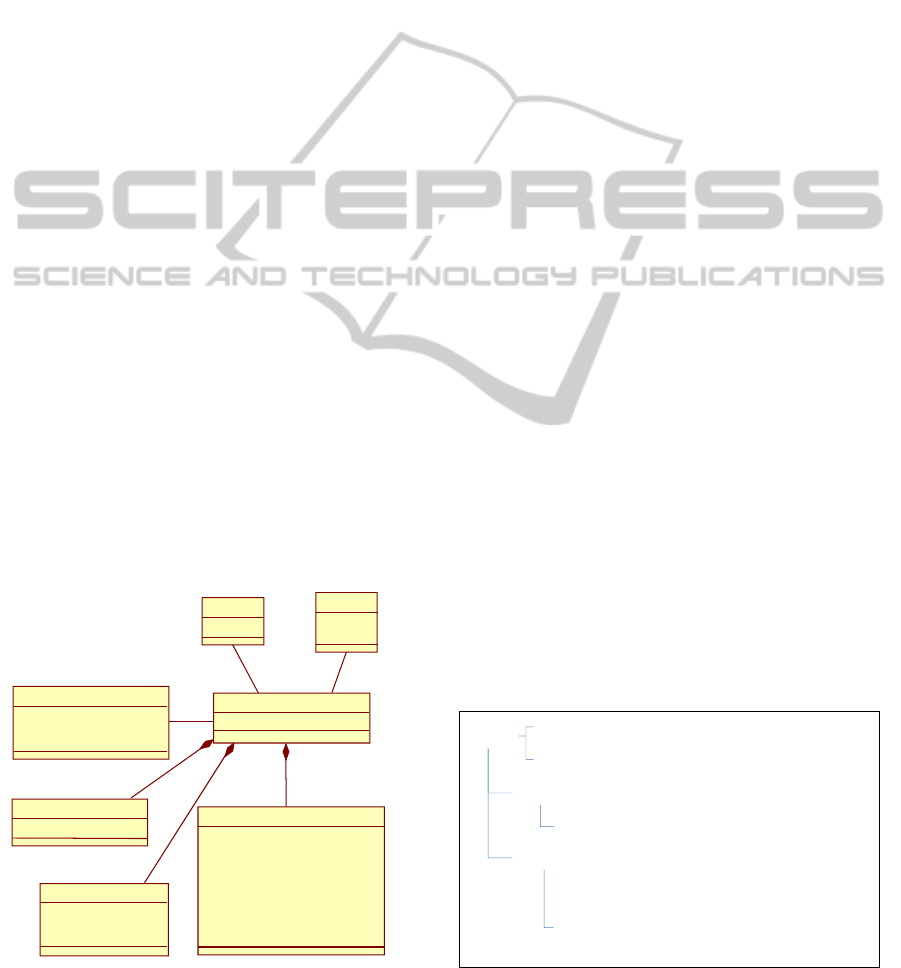
Figure 5: Conceptual model of MUSES testing and
evaluation activities that are relevant to Goal 11.
conceptual model of the perceived user experience.
Such model is given in Figure 5 (where the
connections of the Perceived_user_experience to the
trial activities have been omitted to simplify the
picture). The model in Figure 5 was derived with the
help of experts, to encompass the definition of
perceived user experience to be adopted in the
MUSES project.
Perceived usability of the MUSES applications
is assessed with the 10-item System Usability Scale
(SUS) (Brooke, 1996), including usability and
learnability (Lewis, Sauro, 2009). The goal for
MUSES is to achieve the score of 60 for the overall
usability (combining the factors usability and
learnability).
Complementary aspects are assessed via the
Usability Metric of User Experience (UMUX)
(Brooke, 1996) to address effectiveness, satisfaction
and efficiency. A 7 level Likert scale is used for the
measurement: evaluations are considered successful
when the grade is above level 4.
Technology acceptance is measured via the
Technology Acceptance Model 3 (TAM3)
(Venkatesh, Bala 2008). Also in this case a 7 level
Likert scale is used: evaluations are considered
successful if the grade is above level 4.
3.3.4 GQM Plan Definition – Goal 11
Based on Figure 5, we can identify the following QF
and VF for Goal 11:
− Quality focus: MUSES user experience.
− Variation factor: Application domain.
Then, still making reference to the situation
described in Figure 5, we can derive the following
questions:
Q11.1 How many users used MUSES in each
domain?
Q11.2 What is the percentage of satisfied users, for
each domain?
Figure 6: GQM plan of Goal 11.
Domain
+Name
User
+ID
+Role
Perceived_user_experience
+User_satisfied: Boolean
1
1
SUS_evaluation
+Overall_usability_score
1
UMUX_evaluation
+Effectiveness_evaluation
+Efficiency_evaluation
+Satisfaction_evaluation
1
TAM3_evaluation
+PU_perceived_usefulness
+PEOU_perceived_ease_of_use
+BI_behavioural_intention
+CSE_computer_self-efficacy
+PEC_perceptions_of_external_control
+ENJ_perceived_enjoyment
+CANX_computer_anxiety
+RES_results_demonstrability
+SN_subjective_norm
1
User_experience_thresholds
+SUS_threshold = 60
+UMUX_threshold = 5
+TAM3_threshold = 5
1
Goal 11
VF: Application domain
QF: MUSES user experience
Q11.1:
Q11.2:
M11.1.1: The number of users that
communicated their evaluation, in each domain.
How many users used MUSES in each domain?
What is the percentage of satisfied users, for
each domain?
M11.2.1: The number of users for whom SUS
overall usability score and all the TAM-3 scores
and all the UMUX evaluations were above the
thresholds, in each domain
ICSOFT-EA2015-10thInternationalConferenceonSoftwareEngineeringandApplications
110

The definition of user experience given in Figure 5
suggests that overall users’ satisfaction is evaluated
based on SUS, TAM-3 and UMUX evaluations.
Accordingly, the metrics shown in Figure 6 were
defined.
3.4 Validating the Plans:
Involving Stakeholders
The conceptual definition of the product and process
–as given in Figure 3 and Figure 5– is the basis for
the definition of the GQM plan and project
evaluation. Of course, someone has to supply the
data and/or carry out the activities described in the
model, otherwise the required measures will not be
available and the evaluation will not be possible.
In general, the people in charge of project
evaluation (i.e., those aiming at computing KPI and
showing to what extent the project outcomes satisfy
the original objectives) and those participating in
carrying out research and development activities
(i.e., those who make the “real work”) belong to
disjoint subsets. Accordingly, the conceptual
definition of the product and process can be seen as
a “contract” between evaluators on one side and
researchers, developers, users, stakeholders, testers,
etc. on the other side. Therefore, it is necessary that
everybody agrees that the conceptual model is a
faithful representation of the project product and
processes, and that the corresponding data and
measures will be provided.
In some cases the agreement on the model is
achieved a priori: for instance the model of the data
that are relevant for Goal 11 (Figure 5) was defined
with the help of the people working in the project,
who had a clear idea of both the type of usability
that MUSES had to provide, and how to characterize
it. In other cases, the conceptual model was derived
by the evaluators, who had in mind the need of
getting data that could support the KPI and success
indicator defined in the DoW. In fact, we should
remember that the DoW is the technical annex of the
contract, thus the project must deliver all what is
described in the DoW, including the measures of the
KPI and success indicators.
A case that caused discussions and adjustments
in the model concerned Goal 12:
Goal 12. Evaluate the MUSES framework
with respect to acceptance by users involved
in trials, in the selected industry domains
from the point of view of domain users.
In this case, the issue raised by the people in charge
of the project trials concerned the type of activity in
which the users had to be involved in order to
provide the required data concerning the acceptance
of the MUSES framework. This is a particularly
interesting case, because the metric is defined in a
straightforward way: it is a Boolean, representing
the fact that the user continued using MUSES for
his/her work throughout the trials period, or he/she
preferred to drop MUSES and go on working
without its support. The concerns of the project
people were that the trials could not be carried out in
a real production environment, and trials could not
last so long as to allow users appreciate all MUSES
features in all possible conditions.
The solution was that the trials were organized in
a way that relevant situations occurred in a realistic
environment, rather than in real production
environments. So, the benefits of modelling,
documenting and discussing the KPI and success
indicators did not result in a better definition of the
indicators themselves, but in clarifying the activities
that had to provide the raw measurs. In any case, the
important point is that an agreement on what had to
be done for evaluating MUSES was achieved.
4 THE MEASURE DB SCHEMA
Data are usually measured from the field and
collected into a database. This is a good practice for
several reasons, including the fact that data
measurement activities are isolated from the
evaluation activities. Actually, the definition of the
database acts as a “contract” between the parties:
people in charge of data collection do not need to
worry about the technicalities concerning the usage
of the collected data and measures. Similarly, people
in charge of the project evaluation do not need to
worry about how data and measures are collected,
provided that the measured data have the meaning
that has been agreed upon.
The GQM plan usually provides precise
indications about the needed data: it is thus easy to
derive the measure database schema from the GQM
plan. More precisely, the conceptual description of
the product and process provided by UML diagrams
like the one in Figure 3 can be used as conceptual
data models for the design of the measure database.
Table 2: Feature_execution table.
Attribute Type
Feature_execution_ID Int
UC_feature_ID Int
Feature_ execution_date Date
Feature_completely_executed Boolean
Feature_successfully_executed Boolean
DefiningandEvaluatingSoftwareProjectSuccessIndicators-AGQM-basedCaseStudy
111

For instance, class Feature_execution in Figure 3
suggests the definition of the table shown in Table 2.
The definition of the GQM metrics tells us also how
the relevant data should be derived from the
database tables. For instance, by properly joining the
tables designed on the basis of UML class diagrams
it is possible to get the view described in Table 3.
Table 3: Goal 1-oriented data view.
Attribute Type
Domain_name Text
UC_ID Int
UC_feature_ID Int
Feature_completely_executed Boolean
Feature_successfully_executed Boolean
Given such view, the data associated to the metrics
of Goal 1 are obtained very easily. E.g., the number
of UC features successfully executed in domain
“Domain_A” is obtained via the following query:
SELECT Count(UC_feature_ID) AS M1
FROM SELECT DISTINCT View1.UC_feature_ID
FROM View1
WHERE (((View1.Domain_name)="Domain_A")
AND
((View1.Feature_completely_executed)=Yes)
AND
((View1.Feature_successfully_executed)=
Yes));
Other metrics are obtained via similar queries.
5 IMPLEMENTING INDICATORS
5.1 Determining the Interpretation of
Measures
Most importantly, the GQM plan can be used as a
basis for specifying the interpretation of the
questions, goals, and –ultimately– the indicators that
represent the KPI and success indicators. We face
two needs: 1) computing the numbers needed to
answer the questions, and 2) specifying how such
numbers have to be interpreted to provide suitable
indicators at the goal level.
Considering the metrics associated to question
Q1.2 of Goal 1 (How many UC were applied
successfully in each domain?), it is quite evident that
we have to solve the problem of determining if a
given UC was successful or not, given the results of
its features’ executions. Do we need that all UC
feature executions are successful? If not, what is the
criterion for deciding if a given mix of UC features
executions should be considered an overall success
of the UC they belong to? Consider the following
case: a given UC includes two UC features: fA and
fB; fA has been executed 10 times: it was successful
8 times and it failed 2 times; fB has been executed 4
times: it was successful 3 times and it failed once.
Should the considered UC be considered successful?
To decide, we need to establish success thresholds
for UC features. There are several ways to do it; here
it is not very important how you define the success
thresholds, instead, it is important stressing that
considering the definitions of questions and metrics
leads to realizing the need for aggregating results
obtained at the UC feature level into results at the
UC level.
When moving to the goal level, we can observe
that the role of Goal 1 questions is different: Q1.2
quantifies the achievements of the project in terms
of successful UC, while Q1.1 quantifies the extent of
the work done and –by difference– it indicates how
many tested UC were not successful. The MUSES
DoW indicates that at least 4 UC must be
successfully applied in each domain, therefore we
stick to such interpretation: the indicator is simply
the result of the comparison of the number of
successfully applied UC with the value 4.
From a strictly contractual point of view, we
could stop here, as far as Goal 1 is concerned, since
showing that at least 4 UC per domain have been
successfully tested is enough to comply with the
contract. However, answering question Q1.1 could
provide additional insight to project participants: in
fact, knowing that one or more UC were tested but
were not successful provides indications that could
foster improvements in the concerned research area.
5.2 Implementing KPI
The definitions of KPI and success indicators have
to be translated into actual code that processes
measures and yields the values of the KPI and
success indicators. In doing this, it is useful
considering that graphical, easy to read
representations of KPI and indicators are usually
very welcome, especially by non technical
managers.
This step can be performed in several ways. In
this paper we use the statistical language and
programming environment R (Ihaka, Gentleman,
1996). We use R because it is open-source, reliable,
extremely well supported and very flexible.
A general consideration concerning the
implementation of KPI and indicators is that there is
always some processing that can be effectively
performed by the database management system.
Therefore, a decision to be taken concerns the
ICSOFT-EA2015-10thInternationalConferenceonSoftwareEngineeringandApplications
112
amount of processing that is demanded to the
DBMS: at one extreme we get from the DB raw
data, and all the processing is carried out in the data
analysis and elaboration environment (in our case,
R); at the other extreme the DBMS makes most of
the required computation, and the data analysis and
elaboration environment has just to carry out some –
possibly trivial– data elaboration and visualization
task.
Also in this case the GQM plan helps: a very
simple and effective choice is that the DBMS
provides exactly the metrics data as defined in the
GQM plan, while the rest of the elaboration is
carried out by R programs. For instance, metric
M1.1.1 can be easily extracted from the DB by the
following R code:
library(RODBC)
channel <- odbcConnect("MUSES",uid="root",
pwd="****", believeNRows=FALSE)
Domains <- as.matrix(sqlQuery(channel,
"SELECT Domain_name FROM MUSES.Domains"))
Num_tested_UC = c()
for(i in 1:length(Domains)) {
query_text = sprintf("SELECT DISTINCT
View1.UC_ID FROM MUSES.View1
WHERE(((View1.Domain_name)=\"%s\") AND
(View1.Feature_completely_executed=1))",
Domains[i])
S1 <- as.matrix(sqlQuery(channel,
query_text))
Num_tested_UC = append(Num_tested_UC,
length(S1))
}
print(Num_tested_UC)
The R code shown above works in a rather
straightforward way:
1) Package rodbc (Ripley, Lapsley, 2014) is loaded.
2) A connection to the DB is created.
3) A first query retrieves the list of domain names
from the Domain table.
4) For each domain, the set of UC identifiers for
which at least one feature was completely
executed is also retrieved. The cardinality of the
set is added to vector Num_tested_UC.
5) Vector Num_tested_UC is printed.
The shown R code does very little more than
retrieving data via a query. More sophisticated
outputs can be produced, as illustrated Section 6.1.
6 INDICATOR COMPUTATION
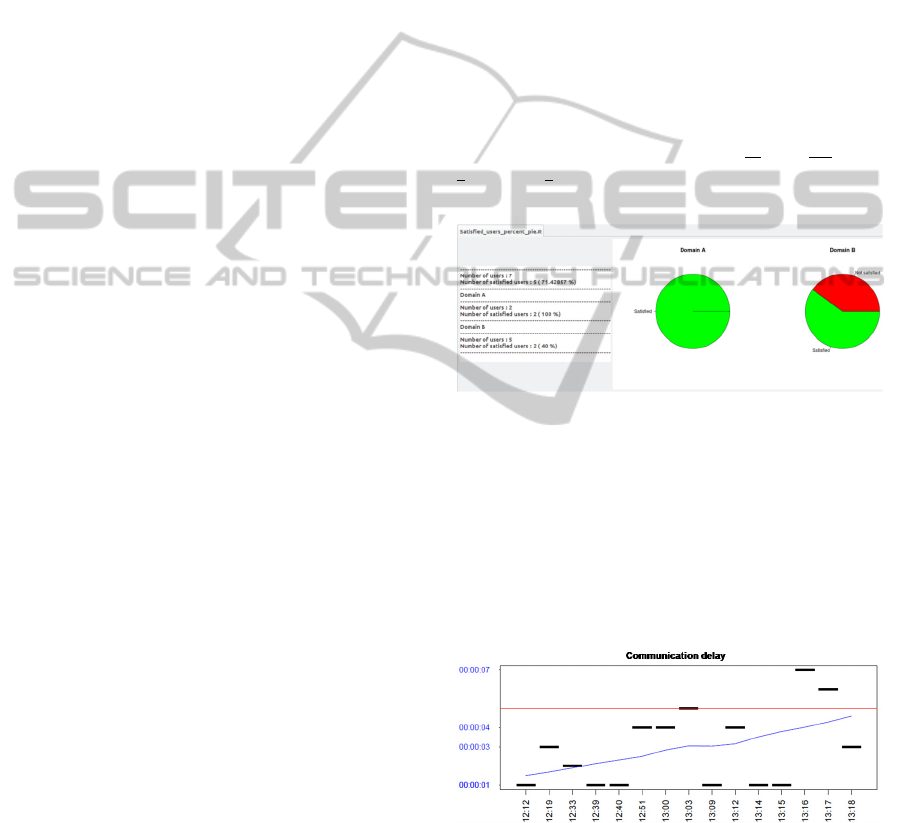
6.1 Computing Results
When the measure database has been populated (in
the case of MUSES by project trials) R programs
can read data from the DB and produce both textual
and graphical results, possibly in comprehensive
reports. For instance, the results yielded by the R
programs associated to Goal 11 are given in Figure 7
(the data reported are fake: they have been inserted
in the measure DB for testing).
In the examples reported here, R is used for its
basic data manipulation and graphic display
capabilities. When necessary, R – being provided
with numerous libraries, which implement almost
any desirable statistical function– can perform more
complex statistical computations. An example is
given in Figure 8, where Goal 10 indicators are
given: communication delays are plotted, with
respect to security violations occurrence times (the
red line is the maximum delay threshold, while the
blue line indicates the “lowess” –locally weighted
scatterplot smoothing– line, which can be interpreted
as the trend of the delays.
Figure 7: Results of Goal 11 measure analysis and
interpretation.
Quite noticeably, the R code that computes the
required KPI and success indicators can get the
needed data directly from the measurement DB and
then process them to produce the required indicators.
This approach is very effective, because when new
measures are inserted in the database, it is sufficient
to re-run the R program to get updated indicators.
Figure 8: Results of Goal 10.
6.2 Final Evaluations
The KPI and success indicators computed as shown
in the previous sections make the effectiveness of
the project apparent. However, to be sure that these
indications are reliable, some validation is advisable
DefiningandEvaluatingSoftwareProjectSuccessIndicators-AGQM-basedCaseStudy
113

To this end, we found that two-fold validation is
usually quite effective.
First, during the trial activities that generate
measures, project people examine the computed
indicators and verify that the computed KPI and
success indicators actually reflect reality (i.e., what
happened in the trials). To this end, it is essential
that the KPI and success indicators are provided as
soon as the measurement data are available; in fact,
if the delay between the events in the field and their
effects on the indicators is too long, it is possible
that project people do not remember precisely the
situation against which the correctness of indicators
must be verified. With the considered process,
indicators are computed and visualized as soon as
measurement data are loaded in the database, hence
real-time feedback is available to people running the
product to be evaluated, so that they can evaluate the
current indicators against the current situation.
Second, the proposed process instrumentation
allows for presenting users and stakeholders with
KPI that are very easy to understand. In the case of
MUSES, the EU officer and reviewers could easily
realize that the KPI actually represented what they
needed to know about the product/process.
The two-fold validation assures not only that
KPI and success indicators are correct, but also that
they represent well the situation they are meant to
disclose, i.e., that we have built the right KPI, and
that we have built them right.
7 RELATED WORK
The definition and implementation of indicators
concerning the performance of processes has
received a lot of attention in the past.
Initially, the literature concentrated on the
definition of KPI and the associated measurement
plans, but gave little or no attention to measurement,
data collection and actual computation of KPI
(Basili, 1993).
Researchers also addressed the role of
techniques like the GQM in process evaluations: see
for instance (Birk et al., 1999). In general, these
proposals focused on the generation and execution
of measurement plan at a quite high level of
abstraction, without entering into details concerning
the tools to be used, or the techniques that could help
reasoning about the product and process to be
measured, or how to ensure that the measurement
plans actually matched the objects of measurement
and the users’ goals. Even a rather extensive
guidebook like (Park et al., 1996) does not deal with
the aforementioned details.
A more comprehensive and detailed view of
software project measurement illustrated software
project control centers (SPCC) (Münch, Heidrich,
2004). SPCC are sets of activities and tools aiming
at collecting, interpreting, and visualizing measures
to provide purpose- and role-oriented information to
all parties involved in project development and
quality assurance. Although our approach has some
similarities with the SPCC described by Münch and
Heidrich (for instance, some of the activities of our
process comply with their classification) a
fundamental difference is that SPCC are meant
primarily to provide indications to project people
during the execution of a project, while we address a
broader objective, including providing useful
indications to end users and payors of the project.
Such objective requires specific attention to making
KPI understandable and evidently coherent with the
project scope and aims. Issues such as supporting
multiple types of visualizations for different
stakeholders, and making indicators easy to
understand are typical of the situation we target,
while they are not relevant in SPCC.
A more recent proposal (Nicho, Cusack, 2007)
addresses IT governance by proposing the
integration of CoBIT (ISACA, 2012) and GQM.
The point of view of stakeholders is introduced
in project monitoring as a central issue in (Tsunoda
et al., 2010). Although Tsunoda et al. have the merit
of introducing stakeholder-oriented concepts –like
the stakeholder’s goal and the key goal indicator–
they describe the project measurement and
monitoring process at a quite abstract level.
Several researchers are addressing KPI for
software-supported business processes: see for
instance (Souza Cardoso, 2013). When dealing with
business processes, the problem of defining and
computing KPI is the same as discussed in this
paper, but the object of the evaluation –i.e., business
processes instead of software development
processes– makes a big difference. In the former
case, the KPI are more homogenous and easy to
describe than in the case of software development;
moreover software is given, and KPI tend to
consider its qualities only with reference to
supporting a specific process rather than
development project goals, as in the case of MUSE.
Consequently, the literature on KPI for software-
supported business processes is hardly interesting
for software projects.
When dealing with business processes, it is often
the case that software is involved as an instrument to
ICSOFT-EA2015-10thInternationalConferenceonSoftwareEngineeringandApplications
114

achieve business goals. The GQM+strategies
technique (Basili et al., 2010) was introduced as a
way for linking indicators to business goals on a
systematic and structured way. In any case, the need
for addressing hierarchies of business goals and
related strategies (possibly supported by software) is
out of the scope of this paper. Adapting the approach
proposed here to hierarchies of business goals and
related strategies is a subject for future work.
Overall, none of the mentioned article addresses
in an organic and systematic manner all of the issues
we dealt with in the paper, namely: Defining
stakeholders’ goals; Connecting measures to goals
that are relevant for stakeholders; Assuring that
measures are coherent with the product and/or
process of interest; Making the relationships
between measurement data, measure definitions and
process and product properties explicit; Making the
definition of indicators explicit, formal and
supported by tools that can be used to retrieve data,
compute and visualize indicators.
In summary, we can state that our proposal
provides practitioners with guidelines –
encompassing well defined activities, which are
effectively supported by tools– more extensively and
at a much more concrete level than previous work.
8 CONCLUSIONS
Defining adequate KPI and project success
indicators for software development projects is made
difficult by several concurrent issues:
− We need that indicators are actually
representative of the project’s achievements,
and that they represent the viewpoints of all the
involved stakeholders.
− Indicators have to be precisely defined,
otherwise they can be misinterpreted, both in
the data collection and indicator computation
phase and in the usage phase (i.e., when
indicators are interpreted as representations of
the project’s success).
− Indicators must be feasible, i.e., the measures
upon which they are based have to be obtainable
effectively and efficiently.
− Activities ranging from defining indicators to
delivering results (i.e., indicators’ values based
on measures) call for specific techniques and
tools, otherwise they can be quite time and
effort consuming and error-prone.
As a consequence, we need to provide people in
charge of software project evaluation with
guidelines, techniques and tools to effectively
manage the KPI and success indicator lifecycle.
In this paper, we have described the phases of
the lifecycle of KPI and project success indicators,
highlighting problems and suggesting techniques
and tools that can be used to support the various
activities. We have also proposed a model of the
KPI and success indicator definition and
computation process.
Our process model and guidelines are derived
from a careful analysis of the problems connected
with the KPI and success factor lifecycle; such
analysis –which in principle can be applied in any
software development process– led to identifying
techniques, tools and practices that can make the
process efficient and relatively easy.
The described process, techniques, tools and
practices have been used in the research project
MUSES. Despite its research nature, MUSES is like
any other software development project, with respect
to KPI and success indicators: developers had
difficulties in defining proper indications, and had
no systematic approach to measurement and
indicator computation and visualization.
The results achieved within the MUSES project
were very satisfactory, especially in that project
people were challenged to thoroughly discuss –and
eventually approve– the definitions of indicators and
the measures to be collected and their
interpretations. Finally, the measurement plan
provided several hints for the organization of the
project trials, and even suggested a few data
collection and logging features to be included in the
MUSES platform and tools.
In conclusion, we believe that whoever has to
evaluate the success of a software development
process can get several useful suggestions from this
paper, both at the methodological level –e.g.,
concerning the activities to be carried out and the
overall process– and at a practical level –e.g.,
concerning the usage of the methods and tools
described in the paper to make activities easier and
cheaper.
Future work includes the construction of a
toolset that integrates the GQM plan management,
the measure database and the R environment.
ACKNOWLEDGEMENTS
The work presented here was partly supported by the
EU Collaborative project MUSES – Multiplatform
Usable Endpoint Security, under grant agreement n.
318508 and by project “Metodi, tecniche e strumenti
DefiningandEvaluatingSoftwareProjectSuccessIndicators-AGQM-basedCaseStudy
115

per l’analisi, l’implementazione e la valutazione di
sistemi software,” funded by Università degli Studi
dell’Insubria.
REFERENCES
MUSES, 2014. https://www.musesproject.eu/
Basili, V., Rombach, H.D., 1988. The TAME project:
towards improvement-oriented software environments,
IEEE Trans. on Software Engineering, vol. 14, n. 6.
Basili, V., Weiss, D., 1984. A methodology for collecting
valid software engineering data, IEEE Trans. on
Software Engineering, vol. 10, n. 6.
Basili, V., Caldiera, G., Rombach, H.D., 1994.
Goal/Question/Metric Paradigm in Encyclopedia of
Software Engineering, vol. 1: Wiley, 1994.
Basili, V., Caldiera, G., Rombach, H.D., 1994. Experience
factory in Encyclopedia of Software Engineering, vol.
1, J. C. Marciniak, Ed.: John Wiley & Sons, 1994.
Fuggetta, A.. Lavazza, L., Morasca, S., Cinti,S., Oldano,
G., Orazi, E., 1998. Applying G/Q/M in an Industrial
Software Factory, ACM Trans. on Software
Engineering and Methodology, vol. 7, n. 4.
Birk, A., van Solingen, R., Jarvinen, J. 1998. Business
Impact, Benefit, and Cost of Applying GQM in
Industry: An In-Depth, Long-Term Investigation at
Schlumberger RPS, in 5
th
Int. Symp. on Software
Metrics (Metrics’98).
van Solingen, R., Berghout, E. 2001. Integrating Goal-
Oriented Measurement in Industrial Software
Engineering: Industrial Experiences with and
Additions to the Goal/Question/Metric Method
(GQM)”, in 7
th
Int. Software Metrics Symposium
(METRICS 2001).
Lavazza, L., 2011. Multi-Scope Evaluation of Public
Administration Initiatives in Process Automation, in
5th European Conf. on Information Management and
Evaluation (ECIME 2011).
Lavazza, L., Mauri, M. 2006. Software Process
Measurement in the Real World: Dealing with
Operating Constraints. In Software Process Workshop
SPW/Prosim 2006. Springer LNCS Vol. 3966/2006.
Lavazza L., Barresi, G. 2005. Automated Support for
Process-aware Definition and Execution of
Measurement Plans, in Int. Conf. on Software
Engineering (ICSE 2005).
Bangor, A., Kortum, P., Miller J. 2009. Determining what
individual SUS scores mean: Adding an adjective
rating scale. Journal of Usability Studies.
Brooke J. 1996. SUS: A “quick and dirty” usability scale.
In P. Jordan, B. Thomas, & B. Weerdemeester (Eds.),
Usability Evaluation in Industry.
Lewis J.R., Sauro, J. 2009. The Factor Structure of the
System Usability Scale. In 1
st
Int. Conf. on Human
Centered Design (HCD 09).
Venkatesh, V., Bala, H. 2008. Technology Acceptance
Model 3 and a Research Agenda on Interventions.
Decision Sciences, vol. 39, n. 2.
Likert, R. 1932. Technique for the measure of attitudes
Arch. Psycho, vol. 22 n. 140.
Ihaka, R., Gentleman, R. 1996. R: a language for data
analysis and graphics. Journal of computational and
graphical statistics, vol. 5, n. 3.
The R Project for Statistical Computing, http://www.r-
project.org.
Ripley, B., Lapsley, M. 2014, Package RODBC – ODBC
Database Access.
Münch, J., Heidrich, J. 2004. Software project control
centers: concepts and approaches. Journal of Systems
and Software, vol. 70 n.1.
Tsunoda, M., Matsumura, T., Matsumoto, K.I. 2010.
Modeling Software Project Monitoring with
Stakeholders, in 9
th
Int. Conf. on Computer and
Information Science (ICIS 2010).
Basili, V., Lindvall, M., Regardie, M., Seaman, C.,
Heidrich, J., Munch, J., Rombach, D. and Trendowicz,
A. 2010. Linking Software Development and Business
Strategy through Measurement, Computer, vol.43, n.4.
Souza Cardoso, E. C., 2013. Towards a Methodology for
Goal-Oriented Enterprise Management. In Enterprise
Distributed Object Computing Conference Workshops
(EDOCW 2013).
Nicho, M., Cusack, B., 2007. A metrics generation model
for measuring the control objectives of information
systems audit. In 40
th
Annual Hawaii Int. Conf. on
System Sciences (HICSS 2007).
Offen, R. J., Jeffery, R. 1997. Establishing software
measurement programs. IEEE Software vol. 14 n. 2.
Birk, A., Hamann, D., Pfahl, D., Järvinen, J., Oivo, M.,
Vierimaa, M., van Solingen, R. 1999. The Role of
GQM in the PROFES Improvement Methodology.
Park, R. E., Goethert, W. B., Florac, W. A. 1996. Goal-
Driven Software Measurement. A Guidebook.
Software Engineering Inst., Carnegie-Mellon Univ.
Basili, V. 1993. Applying the Goal/Question/Metric
paradigm in the experience factory. In 10
th
Annual
CSR Workshop, Application of Software Metrics and
Quality Assurance in Industry.
ISACA, 2012. COBIT 5: A Business Framework for the
Governance and Management of Enterprise IT.
ICSOFT-EA2015-10thInternationalConferenceonSoftwareEngineeringandApplications
116
