
Data Quality Assessment of Company’s Maintenance Reporting: A Case
Study
Manik Madhikermi
1
, Sylvain Kubler
2
, Andrea Buda
1
and Kary Fr¨amling
1
1
Aalto University, School of Science P.O. Box 15400, FI-00076 Aalto, Finland
2
University of Luxembourg, Interdisciplinary Centre for Security, Reliability & Trust, Luxembourg, Luxembourg
Keywords:
Data Quality, Multi-criteria Decision Making, Analytic Hierarchy Process, Decision Support Systems.
Abstract:
Businesses are increasingly using their enterprise data for strategic decision-making activities. In fact, infor-
mation, derived from data, has become one of the most important tools for businesses to gain competitive
edge. Data quality assessment has become a hot topic in numerous sectors and considerable research has been
carried out in this respect, although most of the existing frameworks often need to be adapted with respect
to the use case needs and features. Within this context, this paper develops a methodology for assessing the
quality of enterprises’ daily maintenance reporting, relying both on an existing data quality framework and
on a Multi-Criteria Decision Making (MCDM) technique. Our methodology is applied in cooperation with a
Finnish multinational company in order to evaluate and rank different company sites/office branches (carry-
ing out maintenance activities) according to the quality of their data reporting. Based on this evaluation, the
industrial partner wants to establish new action plans for enhanced reporting practices.
1 INTRODUCTION
Data and Information quality
1
is one of the most com-
petitive advantages for an organization in today’s dig-
ital age (e.g., with the rapid evolution of Cloud Com-
puting, Internet of Things – IoT, Big Data...) (Atzori
et al., 2010). Companies are trying hard to find out
relevant strategies to make their products (physical or
virtual products) standout with respect to their com-
petitors. In such environments, companies need to
provide after sales services such as maintenance, and
warranty services, in order to ensure that the delivered
product is reliable and in full accordance with the cus-
tomer requirements. Nonetheless, providing such ser-
vices inevitably generate costs for businesses; within
many industries, maintenance costs can account for
up to 40% of the operational budget (Dunn, 1998).
Some surveys indicate that one third of every dol-
lar of maintenance costs is wasted due to inappro-
priate or unnecessary maintenance practices (Mob-
ley, 2002). In fact, data quality practices (including
1
The terms Data and Information are often used syn-
onymously; in practice, managers differentiate information
from data intuitively, and describe information as data that
has been processed and enriched in some manner but, un-
less specified otherwise, this article will use “information”
interchangeably with “data”.
maintenance reports) has a considerable impact on
these costs since poor data quality impacts the down-
stream part of the maintenance process, and recipro-
cally, high data quality fosters enhanced business ac-
tivities and decision making.
Data quality has been intensively studied over the
last two decades, and various relevant frameworks
for assessing data quality have since then emerged
(Krogstie et al., 1995; Wang and Strong, 1996; Jarke
and Vassiliou, 1997), and continue to emerge (Batini
et al., 2009; Price and Shanks, 2009). Although most
of the conceptual data quality frameworks can be ap-
plied regardless of the application area, they often re-
quire some tuning/adaptation to each use case needs
and peculiarities, e.g. when dealing with healthcare,
environmental, governmental, business, or still engi-
neering applications (Berndt et al., 2001; Peabody
et al., 2004). The present article is set within this con-
text of ‘existing framework adaptation’, whose ulti-
mate goal of our study is to assess company’s main-
tenance reporting quality considering different office
branches of a Finnish multinational Original Equip-
ment Manufacturer (OEM). In light of the Multi-
Criteria Decision Making (MCDM) nature of the
problem (further described in Section 2), our study
proposes to combine a conceptual data quality frame-
work, namely Krogstie’s framework (Krogstie et al.,
162
Madhikermi M., Kubler S., Buda A. and Främling K..
Data Quality Assessment of Company’s Maintenance Reporting: A Case Study.
DOI: 10.5220/0005518401620172
In Proceedings of 4th International Conference on Data Management Technologies and Applications (DATA-2015), pages 162-172
ISBN: 978-989-758-103-8
Copyright
c
2015 SCITEPRESS (Science and Technology Publications, Lda.)

1995), with a simple and effective MCDM technique
aiming at aggregating the different data quality di-
mensions so as to come up with a ranking of the dif-
ferent company’s sites in order of maintenance report-
ing quality.
To this end, section 2 introduces both the
Krogstie’s framework and to what extent it is adapted
to our maintenance use case. Section 3 provides
greater detail about the adaptation steps and its com-
bination with the MCDM technique. Section 4
presents the use case results related to the OEM com-
pany, along with the conclusions.
2 DATA QUALITY FRAMEWORK
AND ADAPTATION
Data quality is a well explored domain, in which
many frameworks have emerged. One of the ear-
lier framework was developed by Wang and Strong
in (Wang and Strong, 1996), followed by many other
scholars (Jarke and Vassiliou, 1997; Kahn et al., 2002;
Batini et al., 2009; Price and Shanks, 2009). Despite
differences in methods and contexts, yet they share
a number of characteristics regarding their classifi-
cations of the quality dimensions (see e.g. the six-
teen dimensions introduced by Wand and Strong). It
is difficult to state in what respects one framework
is better than another since data quality is commonly
thought of as a multi-dimensional concept with vary-
ing attributed characteristics, which depend on the au-
thor’s philosophical viewpoint, past experience, ap-
plication domains, and so forth (Knight and Burn,
2005). Within this context, the scientific contribu-
tion of this paper is not to define a new data qual-
ity framework, but rather to apply and adapt a tradi-
tional one so as to cope with the company’s needs,
expectations and application features. Accordingly,
section 2.1 provides a brief introduction of the con-
sidered framework, followed by section 2.2 that de-
tails to which extent this framework is used/extended
to our needs.
2.1 Reference Data Quality Framework
The data quality framework considered in our study
is the one defined by Krogstie et al. (Krogstie et al.,
1995), which is an extension of the framework de-
fined by (Lindland et al., 1994). The different con-
cepts and relationships of the Krogstie’s framework
are illustrated in Figure 1, which consists of:
• Physical Quality: about externalizability (i.e., the
knowledge of some social actors have been exter-
Modeling
Domain
Knowledge
Quality
Model
Externalization
Semantic
Quality
Syntactic
Quality
Physical
Quality
Language
Extension
Language
Quality
Participant
Knowledge
Audience
Interpretation
Social Technical
Language Quality
Social
Quality
Perceived
Semantic
Quality
Pragmatic
Quality
Pragmatic
Quality
Figure 1: Krogstie’s data quality framework.
nalized by the use of a conceptual modeling lan-
guage) and internalizability (i.e., the externalized
model is persistent and available enabling partici-
pants to make sense of it);
• Syntactic Quality: correspondence between the
model and the language extension of the language
in which the model is written;
• Semantic Quality: correspondence between the
model and the domain, where the domain is con-
sidered as the ideal knowledge about the situation
to be modeled. Krogstie’s framework contains
two semantic goals: Validity and Completeness;
• Perceived Semantic Quality: correspondence be-
tween the actor interpretation of a model and
his/her current knowledge of the domain. In line
with the semantic quality, two goals are defined
by the authors: Perceived Validity and Perceived
Completeness;
• Pragmatic Quality: correspondence between the
model and the “Audience Interpretation” of it (cf.
Figure 1);
• Social Quality: about people “agreement”;
• Knowledge Quality: from a pure standpoint of
social construction, and as stated by Krogstie et
al., it is difficult to talk about the quality of ex-
plicit knowledge. On the other hand, within cer-
tain areas such as mathematics, what is regarded
as ‘true’ is comparatively stable, and it is inter-
subjectively agreed that certain people have more
valid knowledgeof an area than others. The ‘qual-
ity’ of the participant knowledge can thus be ex-
pressed by the relationships between the audience
knowledge and the domain.
• Language Quality: appears as means for model
quality in the framework. Krogstie et al. have
regrouped factors from earlier discussions on lan-
guage quality as follows:
DataQualityAssessmentofCompany'sMaintenanceReporting:ACaseStudy
163

Table 1: Criteria and its sub-criteria description related to the data quality dimensions.
Criteria Sub-Criteria Description Type
Believability (C
B
)
Length of Work Description (C
B1
) Length of the work description related to a work order. I
c
avg
(i)
Work Log Variation (C
B2
) Work Description variation among the different operator reports I
c
sim
(i)
Technician Log Variation (C
B3
) Technical log variation among the different operator reports I
c
sim
(i)
Completeness (C
C
)
Asset Location reported (C
C1
) Location of asset within product where maintenance has been done. I
c
sim
(i)
Description reported (C
C2
) Description of work to be done in particular maintenance work. I
c
sim
(i)
Actual Finish Date reported (C
C3
) Actual Finish date and time of work completed. I
c
sim
(i)
Target Start Date reported (C
C4
) Targeted start date of the maintenance work. I
c
sim
(i)
Target Finish Date reported (C
C5
) Targeted finish date of the maintenance work. I
c
sim
(i)
DLC Code reported (C
C6
) Actual location of the defect within product. I
c
sim
(i)
Schedule Start Date reported (C
C7
) Scheduled start date of the maintenance work. I
c
sim
(i)
Schedule Finish Date reported (C
C8
) Scheduled Finish date of the maintenance work. I
c
sim
(i)
Timeliness (C
T
) This is average delay of reporting on individual site I
c
avg
(i)
– Domain Appropriateness;
– Participant Knowledge Appropriateness;
– Technical Actor Interpretation Enhancement.
2.2 Krogstie’s Framework Adaptation
Given the above definitions, and based on the
OEM company’s requirements, three key con-
cepts/relationships and one assumption lay the
groundwork of our study for Krogstie’s framework
adaptation. First, the study assumption is that the
Physical Quality (cf. Figure 1), and particularly the
externalized model, is 100% persistent and available,
thus enabling participants to make sense of it. In-
deed, the OEM company designed its own mainte-
nance models, report templates, databases, etc., and
is not willing (at a first stage) to assess/study how
persistent their implementations are compared with
the initial expert statements, expressed knowledge,
etc. The OEM company then expressed require-
ments regarding three of the Krogstie’s framework
concepts/relationships, namely:
1. Semantic Quality: one of the OEM company’s re-
quirement matches – to a certain extent – with
the semantic quality dimension since the company
would like to know to which extent the service
data reported by each operator (on each site) can
be trusted, or more exactly can be considered as
“true”, “real” and “credible”, in order to carry out
the planning activities. This is referred to as the
“Believability” criterion (C
B
) in this paper, whose
various facets of the Believability are formalized
in the form of sub-criteria (or Believability quality
indicators) denoted by {C
B1
..C
B3
} in Table 1;
2. Language Quality: one of the OEM company’s
requirement matches – to a certain extent – with
the language quality dimension since the com-
pany would like to know to which extent the ser-
vice data reported by each operator is complete,
or is of sufficient depth and breadth for the task at
hand (Wang and Strong, 1996). To put it another
way, this criterion, referred to as Completeness
(C
C
), reflects the level of details reported by each
operator with regard to each report field that needs
to be entered (in accordance with the company’s
business logic) in the report. Similarly to C
B
, the
facets of Completeness are denoted {C
C1
...C
C8
}
(see Table 1);
3. Knowledge Quality: one of the OEM company’s
requirement matches – to a certain extent – with
the semantic quality dimension since the company
would like to know to which extent the service
data reported by each operator is sufficiently “up
to date”, which is depending on the time differ-
ence between the maintenance work and the work
reporting. This criterion, referred to as Timeliness
C
T
, is based on the assumption that the longer
the time spent to submit the report, the lesser the
quality of the reporting (operator are likely to for-
get key details of the maintenance task over time).
No sub-criterion is defined for this dimension, as
shown in Table 1 (C
T
);
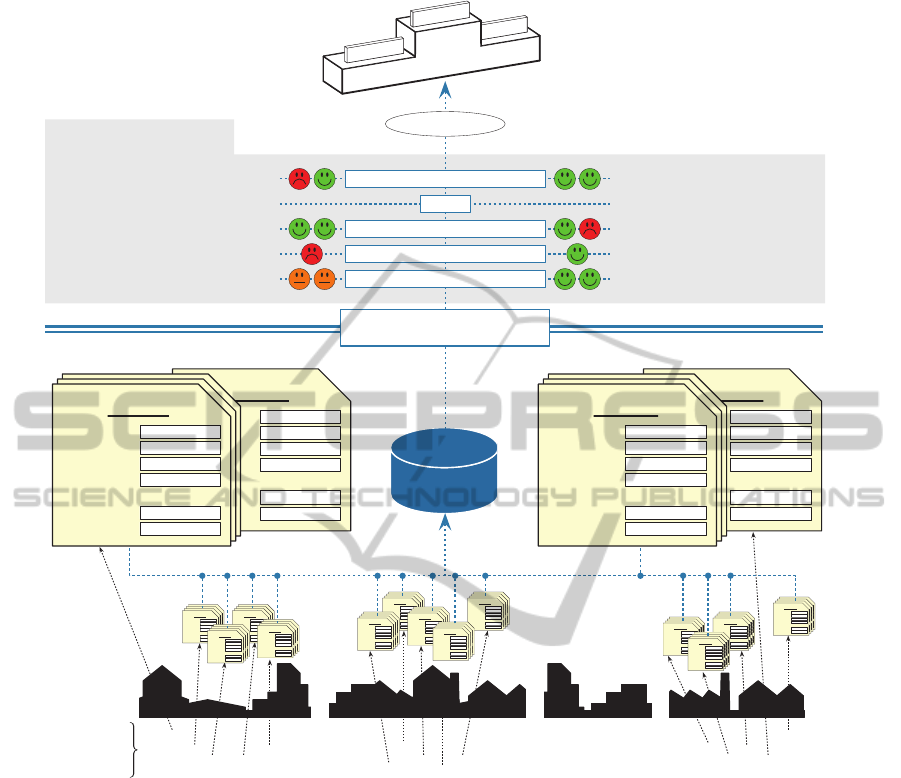
In order to ease the understanding of these three
data quality dimensions, and associated sub-criteria,
we propose to illustrate through Figure 2 the differ-
ent stages that compose our adapted framework. This
figure highlights that maintenance operators carry out
maintenance work/tasks on each OEM site (sites de-
noted by Site 1... Site z) and generate multiple re-
ports. A zoom on reports from Site 1 and n is pro-
posed in Figure 2 so as to compare both sets of re-
ports based on the criteria defined in Table 1. It al-
lows for an understanding of when a report, or field
content, impacts positively on the company’s mainte-
nance reporting quality, and when it does impact neg-
atively (see “smileys” and associated explanation in
Figure 2).
In this paper, a simple and effective MCDM tech-
nique is used as support of the arithmetic framework
to handle the integration/aggregation of the various
DATA2015-4thInternationalConferenceonDataManagementTechnologiesandApplications
164
SITE 1 SITE 2
. . .
SITE n
x
x
x
x
y
x
x
x
x
y
x
x
x
y
y
OEM
Database
Maintenance Operator (Site 1)
Report ID : 1D
Asset Location
Description
Actual End-Date
Target Start Date
. . .
Scheduled Start Date
Scheduled End Date
Maintenance Operator (Site 1)
ID : 1389706
Asset Location
Description
Actual End-Date
Target Start Date
. . .
Scheduled Start Date
Scheduled End Date
Maintenance Operator (Site 1)
ID : 1389706
Asset Location
Description
Actual End-Date
Target Start Date
. . .
Scheduled Start Date
Scheduled End Date
Maintenance Operator (Site 1)
Report ID : 1A
Asset Location
Description
Actual End-Date
Target Start Date
. . .
Scheduled Start Date
Scheduled End Date
Power Controller 4v
Done
28/08/20 14
23/08/20 14
24/08/20 14
27/08/20 14
Front axle 34.8YH
Done
02/05/20 14
07/06/20 14
Maintenance Operator (Site 1)
ReportID : 1 A
AssetLocatio n
Description
ActualEnd-Date
TargetStart Date
. ..
Scheduled Start Date
Scheduled EndDate
Maintenance Operator (Site 1)
ReportID : 1 A
AssetLocatio n
Description
ActualEnd-Date
TargetStart Date
. ..
Scheduled Start Date
Scheduled EndDate
Maintenance Operator (Site 1)
ReportID : 1 A
AssetLocatio n
Description
ActualEnd-Date
TargetStart Date
. ..
Scheduled Start Date
Scheduled EndDate
Maintenance Operator (Site 1)
ReportID : 1 A
AssetLocatio n
Description
ActualEnd-Date
TargetStart Date
. ..
Scheduled Start Date
Scheduled EndDate
Maintenance Operator (Site 1)
ReportID : 1 A
AssetLocatio n
Description
ActualEnd-Date
TargetStart Date
. ..
Scheduled Start Date
Scheduled EndDate
Maintenance Operator (Site 1)
ReportID : 1 A
AssetLocatio n
Description
ActualEnd-Date
TargetStart Date
. ..
Scheduled Start Date
Scheduled EndDate
Maintenance Operator (Site 1)
ReportID : 1 A
AssetLocatio n
Description
ActualEnd-Date
TargetStart Date
. ..
Scheduled Start Date
Scheduled EndDate
Maintenance Operator (Site 1)
ReportID : 1 A
AssetLocatio n
Description
ActualEnd-Date
TargetStart Date
. ..
Scheduled Start Date
Scheduled EndDate
Maintenance Operator (Site 1)
ReportID : 1 A
AssetLocatio n
Description
ActualEnd-Date
TargetStart Date
. ..
Scheduled Start Date
Scheduled EndDate
Maintenance Operator (Site 1)
ReportID : 1 A
AssetLocatio n
Description
ActualEnd-Date
TargetStart Date
. ..
Scheduled Start Date
Scheduled EndDate
Maintenance Operator (Site 1)
ReportID : 1 A
AssetLocatio n
Description
ActualEnd-Date
TargetStart Date
. ..
Scheduled Start Date
Scheduled EndDate
Maintenance Operator (Site 1)
ReportID : 1 A
AssetLocatio n
Description
ActualEnd-Date
TargetStart Date
. ..
Scheduled Start Date
Scheduled EndDate
Maintenance Operator (Site 1)
ReportID : 1 A
AssetLocatio n
Description
ActualEnd-Date
TargetStart Date
. ..
Scheduled Start Date
Scheduled EndDate
Maintenance Operator (Site 1)
ReportID : 1 A
AssetLocatio n
Description
ActualEnd-Date
TargetStart Date
. ..
Scheduled Start Date
Scheduled EndDate
Maintenance Operator (Site 1)
ReportID : 1 A
AssetLocatio n
Description
ActualEnd-Date
TargetStart Date
. ..
Scheduled Start Date
Scheduled EndDate
Maintenance Operator (Site 1)
ReportID : 1 A
AssetLocatio n
Description
ActualEnd-Date
TargetStart Date
. ..
Scheduled Start Date
Scheduled EndDate
Maintenance Operator (Site 2)
ReportID : 2A
AssetLocatio n
Description
ActualEnd-Date
TargetStart Date
. ..
Scheduled Start Date
Scheduled EndDate
Maintenance Operator (Site 2)
ReportID : 2A
AssetLocatio n
Description
ActualEnd-Date
TargetStart Date
. ..
Scheduled Start Date
Scheduled EndDate
Maintenance Operator (Site 2)
ReportID : 2A
AssetLocatio n
Description
ActualEnd-Date
TargetStart Date
. ..
Scheduled Start Date
Scheduled EndDate
Maintenance Operator (Site 2)
ReportID : 2A
AssetLocatio n
Description
ActualEnd-Date
TargetStart Date
. ..
Scheduled Start Date
Scheduled EndDate
Maintenance Operator (Site 2)
ReportID : 2A
AssetLocatio n
Description
ActualEnd-Date
TargetStart Date
. ..
Scheduled Start Date
Scheduled EndDate
Maintenance Operator (Site 2)
ReportID : 2A
AssetLocatio n
Description
ActualEnd-Date
TargetStart Date
. ..
Scheduled Start Date
Scheduled EndDate
Maintenance Operator (Site 2)
ReportID : 2A
AssetLocatio n
Description
ActualEnd-Date
TargetStart Date
. ..
Scheduled Start Date
Scheduled EndDate
Maintenance Operator (Site 2)
ReportID : 2A
AssetLocatio n
Description
ActualEnd-Date
TargetStart Date
. ..
Scheduled Start Date
Scheduled EndDate
Maintenance Operator (Site 2)
ReportID : 2A
AssetLocatio n
Description
ActualEnd-Date
TargetStart Date
. ..
Scheduled Start Date
Scheduled EndDate
Maintenance Operator (Site 2)
ReportID : 2A
AssetLocatio n
Description
ActualEnd-Date
TargetStart Date
. ..
Scheduled Start Date
Scheduled EndDate
Maintenance Operator (Site 2)
ReportID : 2A
AssetLocatio n
Description
ActualEnd-Date
TargetStart Date
. ..
Scheduled Start Date
Scheduled EndDate
Maintenance Operator (Site 2)
ReportID : 2A
AssetLocatio n
Description
ActualEnd-Date
TargetStart Date
. ..
Scheduled Start Date
Scheduled EndDate
Maintenance Operator (Site 2)
ReportID : 2A
AssetLocatio n
Description
ActualEnd-Date
TargetStart Date
. ..
Scheduled Start Date
Scheduled EndDate
Maintenance Operator (Site 2)
ReportID : 2A
AssetLocatio n
Description
ActualEnd-Date
TargetStart Date
. ..
Scheduled Start Date
Scheduled EndDate
Maintenance Operator (Site 2)
ReportID : 2A
AssetLocatio n
Description
ActualEnd-Date
TargetStart Date
. ..
Scheduled Start Date
Scheduled EndDate
Maintenance Operator (Site 2)
ReportID : 2A
AssetLocatio n
Description
ActualEnd-Date
TargetStart Date
. ..
Scheduled Start Date
Scheduled EndDate
Maintenance Operator (Site 2)
ReportID : 2A
AssetLocatio n
Description
ActualEnd-Date
TargetStart Date
. ..
Scheduled Start Date
Scheduled EndDate
Maintenance Operator (Site 2)
ReportID : 2A
AssetLocatio n
Description
ActualEnd-Date
TargetStart Date
. ..
Scheduled Start Date
Scheduled EndDate
Maintenance Operator (Site 2)
ReportID : 2A
AssetLocatio n
Description
ActualEnd-Date
TargetStart Date
. ..
Scheduled Start Date
Scheduled EndDate
Maintenance Operator (Site 2)
ReportID : 2A
AssetLocatio n
Description
ActualEnd-Date
TargetStart Date
. ..
Scheduled Start Date
Scheduled EndDate
Maintenance Operator (Site n)
ReportID : n A
AssetLocatio n
Description
ActualEnd-Date
TargetStart Date
. ..
Scheduled Start Date
Scheduled EndDate
Maintenance Operator (Site n)
ReportID : n A
AssetLocatio n
Description
ActualEnd-Date
TargetStart Date
. ..
Scheduled Start Date
Scheduled EndDate
Maintenance Operator (Site n)
ReportID : n A
AssetLocatio n
Description
ActualEnd-Date
TargetStart Date
. ..
Scheduled Start Date
Scheduled EndDate
Maintenance Operator (Site n)
ReportID : n A
AssetLocatio n
Description
ActualEnd-Date
TargetStart Date
. ..
Scheduled Start Date
Scheduled EndDate
Maintenance Operator (Site n)
ReportID : n A
AssetLocation
Description
ActualEnd-Date
TargetStart Date
. ..
Scheduled Start Date
Scheduled EndDate
Maintenance Operator (Site n)
ReportID : n A
AssetLocation
Description
ActualEnd-Date
TargetStart Date
. ..
Scheduled Start Date
Scheduled EndDate
Maintenance Operator (Site n)
ReportID : n A
AssetLocation
Description
ActualEnd-Date
TargetStart Date
. ..
Scheduled Start Date
Scheduled EndDate
Maintenance Operator (Site n)
ReportID : n A
AssetLocation
Description
ActualEnd-Date
TargetStart Date
. ..
Scheduled Start Date
Scheduled EndDate
Maintenance Operator (Site n)
ReportID : n A
AssetLocation
Description
ActualEnd-Date
TargetStart Date
. ..
Scheduled Start Date
Scheduled EndDate
Maintenance Operator (Site n)
ReportID : n A
AssetLocation
Description
ActualEnd-Date
TargetStart Date
. ..
Scheduled Start Date
Scheduled EndDate
Maintenance Operator (Site n)
ReportID : n A
AssetLocation
Description
ActualEnd-Date
TargetStart Date
. ..
Scheduled Start Date
Scheduled EndDate
Maintenance Operator (Site n)
ReportID : n A
AssetLocation
Description
ActualEnd-Date
TargetStart Date
. ..
Scheduled Start Date
Scheduled EndDate
Maintenance Operator (Site n)
ReportID : n A
AssetLocatio n
Description
ActualEnd-Date
TargetStart Date
. ..
Scheduled Start Date
Scheduled EndDate
Maintenance Operator (Site n)
ReportID : n A
AssetLocatio n
Description
ActualEnd-Date
TargetStart Date
. ..
Scheduled Start Date
Scheduled EndDate
Maintenance Operator (Site n)
ReportID : n A
AssetLocatio n
Description
ActualEnd-Date
TargetStart Date
. ..
Scheduled Start Date
Scheduled EndDate
Maintenance Operator (Site n)
ReportID : n A
AssetLocatio n
Description
ActualEnd-Date
TargetStart Date
. ..
Scheduled Start Date
Scheduled EndDate
Maintenance Operator (Site n)
Report ID : nD
Asset Location
Description
Actual End-Date
Target Start Date
. . .
Scheduled Start Date
Scheduled End Date
Maintenance Operator (Site 1)
ID : 1389706
Asset Location
Description
Actual End-Date
Target Start Date
. . .
Scheduled Start Date
Scheduled End Date
Maintenance Operator (Site 1)
ID : 1389706
Asset Location
Description
Actual End-Date
Target Start Date
. . .
Scheduled Start Date
Scheduled End Date
Maintenance Operator (Site n)
Report ID : nA
Asset Location
Description
Actual End-Date
Target Start Date
. . .
Scheduled Start Date
Scheduled End Date
Fuel System 01X.2
System changed by...
28/08/20 14
23/08/20 14
24/08/20 14
27/08/20 14
Chassis has been re...
28/08/20 14
23/08/20 14
24/08/20 14
27/08/20 14
Maintenance
Operators per
OEM’s Site
Example when comparing operator
reports between Site 1 and Site n
Data Quality Ass essment
of OME’s Maintenance Reporting
C
B1
: L ength of Work Description
One world (”Done”) is too short to properly
describe the maintenance opration
The description seems to be long enough
in reports nA & nD
C
B2
: Work Log Variation
No variation between the operator reports,
i.e. between report 1A & 1D in that example
The content of the work description
reported by the operator often vary
C
C1
: Asset Location Reported
Field “Asset Location” filled out in report 1A
as well as in report 1D
Field “Asset Location” filled out in
report nA but not in report nD. . .
. . .
C
T
: Average Delay of Reporting
Reports 1A was made 1h after the task, while
report 1D was made with a delay of 3 weeks
Both Reports nA and nD have been
made with a delay inferior to 2h
MCDM technique
Site ranking considering all reports, from all operators, from
all sites : {Site 1, Site 2, Site 3. . . Site n}
2 3
S
ITE
1
1
S
ITE
2
S
ITE
n
Figure 2: Stages composing the maintenance reporting quality assessment framework.
criteria preferences, report contents, etc. as empha-
sized in Figure 2 (see the podium that is the result
of the “MCDM technique”). The reason of using a
MCDM technique is threefold:
• the human brain is not reliable for decision-
making when there are many factors/criteria to
consider simultaneously, which is even more true
when the problem is structured in several lay-
ers (i.e., objective depending on several crite-
ria, which themselves can be declined into sub-
criteria...), as it is the case in our use case;
• MCDM techniques help reasoning about inter-
dependencies among criteria, alternatives, etc.,
which inevitably results in better decision-
making, or assessment outcomes;
• Experts from the OEM company can easily re-use
and adapt the MCDM parameters as they see fit
(e.g., criteria preferences, integration of new data
quality dimensions);
There is a number of MCDM techniques in the
literature such as AHP (analytic hierarchy process),
ANP (analytic network process), TOPSIS (technique
for order preference by similarity to ideal situation),
ELECTRE to solve MCDM problems (Figueira et al.,
2005). In our study, we do use AHP (Saaty, 1996)
for the reason that it is very simple and effective tech-
nique to integrate expert opinions and requirements.
For instance, decision makers use linguistic variables
in AHP rather than expressing their judgments in the
form of exact numeric values; adding that AHP does
not involve complex mathematics. These characteris-
tics are probably the main reasons for the success of
this technique, which is the second most used MCDM
DataQualityAssessmentofCompany'sMaintenanceReporting:ACaseStudy
165

Site 1 Site 2 Site 3 Site 4
. . . . . . . . . . . . . . .
Site 54
C
B1
C
B2
C
B3
C
C1
C
C2
C
C3
C
C4
C
C5
C
C6
C
C7
C
C8
C
T
Believability Completeness
Timeliness
Reporting Quality Assessment and Ranking of OEM Sites
Level 1
Level 2
Level 3
Level 4
Figure 3: AHP structure related to the maintenance reporting quality assessment problem.
methods according to a recent survey
2
(Mardani et al.,
2015). Nonetheless, it is important to note that there
are no better or worse techniques, but some tech-
niques are better suited to particular decision prob-
lems than others (Zheng et al., 2012); for instance,
AHP only deals with linear preferences (this is the
case in our study), not with contextual preferences
where the value of one or several criteria may affect
the importance or utility of other criteria (Fr¨amling,
1996).
3 DATA REPORTING
ASSESSMENT
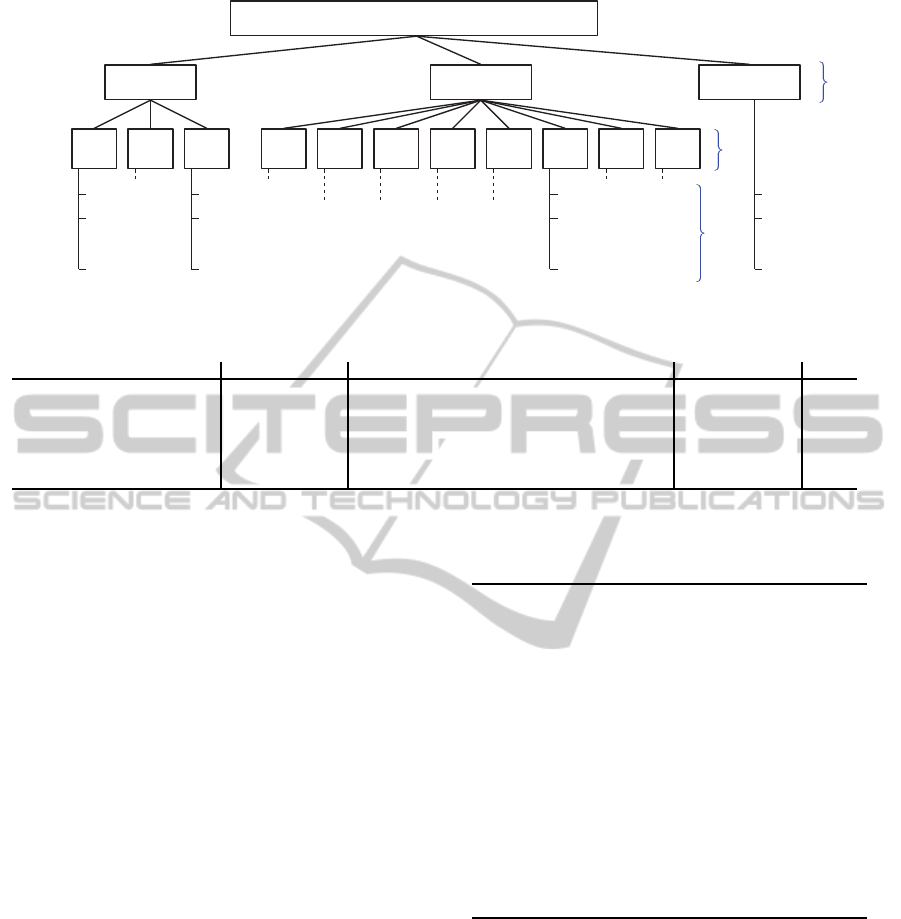
AHP, originally introduced by (Saaty, 1996), has the
advantage of organizing critical aspects of the prob-
lem in a manner similar to that used by the human
brain in structuring the knowledge, i.e. in a hierar-
chical structure of different levels consisting of the
overall goal, the criteria and sub-criteria, as well as
the alternatives. In this regard, our MCDM ranking
problem is brokendown into the hierarchical structure
depicted in Figure 3, and particularly in four distinct
levels:
• Level 1: the overall goal of the study is to rank the
different OEM company sites in terms of mainte-
nance reporting quality;
• Levels 2 and 3: the set of data quality dimensions,
and sub-criteria, used to assess the maintenance
reporting quality (derived from Krogstie’s frame-
work and listed in Table 1);
• Level 4 the alternativesthat are the OEM company
sites;
Given this hierarchy, AHP does perform the fol-
lowing computation steps for identifying the final
2
Frequency of application being 15.82% for AHP, while
Hybrid Fuzzy MCDM (1
st
position) are applied with a fre-
quency of 19.89% and Fuzzy AHP (3
rd
position) with a fre-
quency of 9.53%.
ranking of the alternatives with respect to the overall
goal:
1. Compare each element in the corresponding level
and calibrate them on the numerical scale. This
requires
(n−1)
2
pairwise comparisons, where n is
the number of elements with the consideration
that diagonal elements are equal to “1” and the
other elements will be simply the reciprocal of the
earlier comparisons;
2. Perform calculation to find the maximum eigen
value, consistency index (CI), consistency ra-
tio (CR), and normalized values for each crite-
ria/alternatives;
3. If the computed eigen value, CI and CR are sat-
isfactory, then decision/ranking is done based on
the normalized values.
Stages 1 and 2 are detailed in sections 3.1 and 3.2,
which respectively deal with expert preference-based
pairwise comparisons and ratio scale-based pairwise
comparisons (Saaty, 1990), and Stage 3 is described
in section 3.3. In order to make the understanding
easier, a scenario is considered throughout section 3,
whose parts are preceded by the symbol “➫”.
3.1 Pairwise Comparison based on
Expert Preferences
This section details how a decision maker evaluates
the importance of one criterion (or sub-criterion) with
respect to the others. To this end, OEM experts per-
form pairwise comparisons among criteria, as formal-
ized with P
C
in Eq. 1, with m the number of cri-
teria at a specific hierarchy level and from a same
“parent criterion”, e.g. m = 3 at level 2 of the AHP
structure (i.e., m = |{C
B
,C
C
,C
T
}|), m = 3 at level 3
with regard to the parent criterion ‘Believability’ (i.e.,
m = |{C
B1
,C
B2
,C
B3
}|), m = 8 at level 3 with regard
to the parent criterion ‘Completeness’, etc. The ex-
pert evaluation is carried out based on the 1- to 9-point
Saaty’s scale: {1, 3, 5,7,9}; w
ij
= 1 meaning that C
i
and C
j
are of equal importance and w
ij
= 9 meaning
DATA2015-4thInternationalConferenceonDataManagementTechnologiesandApplications
166

C
C1
C
C2
C
C3
C
C4
C
C5
C
C6
C
C7
C
C8
C
C1
1 3 1 3 7 3 9 3
C
C2
1/3 1 1/3 3 5 3 5 3
C
C3
1 3 1 3 5 3 5 3
C
C4
1/3 1/3 1/3 1 5 3 5 1
C
C5
1/7 1/5 1/5 1/5 1 1/3 3 5
C
C6
1/3 1/3 1/3 1/3 3 1 5 1/3
C
C7
1/9 1/5 1/5 1/5 1/3 1/5 1 1/5
C
C8
1/3 1/3 1/3 1 1/5 3 5 1
➠
W
C
C1
0.240
W
C
C2
0.165
W
C
C3
0.191
W
C
C4
0.128
W
C
C5
0.081
W
C
C6
0.085
W
C
C7
0.019
W
C
C8
0.089
(4)
that C
i
is strongly favored over C
j
.
P
C
=
C
1
... C
m
C
1
w
11
... w
1m
.
.
.
.
.
.
.
.
.
.
.
.
C
m
w
m1
... w
mm
(1)
The computation of the normalized eigenvector of
P
C
then enables to turn qualitative data into crisp ra-
tios. Although several approaches exist in the litera-
ture for normalized eigenvector compution, the Sim-
ple Additive Weighting (SAW) method (Tzeng and
Huang, 2011) is used in our study, as formalized in
Eq. 2.
W
i
=
∑
m
j=1
w
ij
∑
m
k=1
∑
m
j=1
w
kj
, w
ji
=
(
1 i = j
1
w
ij
i 6= j
(2)
W = [W
C
1
,...,W
C
i
,...,W
C
m
]
Finally, a P
C
matrix is characterized as consistent
if, and only if:
w
ij
= w
ik
× w
kj
∀i,k ∈ N |i 6= k; j ∈ N − {i,k}
However it is often hard to fulfill such a pre-requisite
when dealing with real expert preferences, which is
all the more true when the number of criteria to be
compared increases. Consistency of any matrix is cal-
culated through the Consistency Ratio (CR), as given
in Eq. 3, where RI is the Consistency index of a pair-
wise matrix generated Randomly (Saaty, 1980).
CR =
CI
RI
(3)
➫ In our case, pairwise comparisons are filled out
with the OEM’s executive officer. Eq. 5 provides in-
sight into the expert specifications regarding criteria
at Level 2 of the AHP structure. The computed nor-
malized eigenvector highlights that the officer judges
all criteria at this level of equal importance.
C
B
C
C
C
T
C
B
1 1 1
C
C
1 1 1
C
T
1 1 1
➠
W
C
B
0.33
W
C
C
0.33
W
C
T
0.33
(5)
CI=0; CR=0
Eq. 6 shows the pairwise comparisons carried out
at Level 3 of the AHP structure, with regard to the
parent criterion ‘Believability’ (to facilitate under-
standing, the calculation of the normalized eigenvec-
tor value W
C
B1
is detailed in Eq. 7). The eigenvector
values (cf. Eq. 6) highlight that the officer judges the
“Length of Work Description” slightly more impor-
tant (or critical) in the maintenance reporting quality
than the “Work Log Variation” (C
B1
), and far more
important than the “Technician Log Variation” (C
B3
).
C
B1
C
B2
C
B3
C
B1
1 3 5
C
B2
1
3
1 5
C
B3
1
5
1
5
1
➠
W
C
B1
0.54
W
C
B2
0.38
W
C
B3
0.08
(6)
CI=0.168; CR=0.289
W
C
B1
=
1+ 3 + 5
1+ 3 + 5 +
1
3
+ 1+ 5+
1
5
+
1
5
+ 1
(7)
=
9
16.74
= 0.54
Similarly, the experts carry out pairwise compar-
isons in Eq. 4 considering the sub-criteria of ‘Com-
pleteness’ (i.e., C
C1
to C
C8
); W
C
C1
is the most impor-
tant sub-criteria, followed by W
C
C3
and W
C
C2
respec-
tively. Regarding C
T
, there is no pairwise comparison
be performed since no sub-criterion has been defined.
The pairwise comparison approach introduced in
this section allows for taking into consideration ex-
pert know-how and judgments, and to turn them into
crisp ratios. However, pairwise comparison evalua-
tion is not always based on expert elicitation, some-
times them is necessary to take into consideration
monitoring system parameters such as: how many
times the field “DLC Code reported” (C
C6
) has been
left empty in the maintenance reports on Site i com-
pared with the other Sites. In this case, Saaty intro-
duced the concept of ‘relativescale’ or ‘pairwise com-
parison as ratios” (Saaty, 1990), which allows for con-
sidering various types of data and metrics. Section 3.2
provides greater detail about the types of data and
metrics that underly our pairwise comparisons as ra-
tios that mostly concern pairwise comparisons among
DataQualityAssessmentofCompany'sMaintenanceReporting:ACaseStudy
167

alternatives (i.e., level 4 of the AHP structure) with
respect to a each criterion taking place at the upper
level (i.e., at Level 3).
3.2 Pairwise Comparison as Ratios
Pairwise Comparison as ratios is a tool that allows
for comparing criteria (or alternatives with respect to
criteria) based upon a relative scale rather than us-
ing preference scales (e.g., the 1- to 9-point Saaty’s
scale). Eq. 8 provides insight into the pairwise com-
parison as ratio matrix considering the set of alterna-
tives A
i
(i.e., i referring to a OEM site), with I
c
x
(i) the
digital indicator (or metric) that enables us to quan-
titatively assess the alternative A
i
with respect to the
monitored system parameter c (i.e., with respect to
criteria defined at Level 3), and x referring to the fact
that several digital indicators can be used according to
the monitored system parameter/criterion c, as will be
discussed below. Note that the normalized eigenvec-
tor values of the pairwise comparison as ratios with
respect to criterion c are denoted by W
A
c
i
in Eq. 8.
A
1
A
2
... A
z
A
1
1
I
c
x
(1)
I
c
x
(2)
...
I
c
x
(1)
I
c
x
(z)
A
2
I
c
x
(2)
I
c
x
(1)
1 ...
I
c
x
(1)
I
c
x
(z)
.
.
.
.
.
.
.
.
.
.
.
.
.
.
.
A
z
I
c
x
(z)
I
c
x
(1)
I
c
x
(z)
I
c
x
(2)
... 1
➠
W
A
c
1
W
A
c
2
.
.
.
W
A
c
z
(8)
Two digital indicators I
c
x
(i) are defined:
• I
c
sim
(i) (Empty Indicator – Eq. 9): used to calcu-
late the number of times a “field” was left empty
in reports carried out on Site i, with k the total
number of reports performed on Site i:
I
c
sim
(i) =
Number of empty fields on Site i
k
(9)
➫ Let us consider the example of pairwise com-
parison as ratios with regard to C
C6
and Site 1 and
2. On Site 1, 76 maintenance reports have been
carried out and 45 of these reports contain the
DLC code (meaning that 59% of all the reports
contain the requested information, see Eq. 10),
while on Site 2 only 44% of the reports contain
the requested information (see Eq. 11).
I
C
C6
sim
(1) =
45
76
= 59% (10)
I
C
C6
sim
(2) =
49
88
= 44% (11)
The pairwise comparison as ratios is then com-
puted using all I
c
x
(i) indicators and considering all
alternatives (i.e., the 54 sites). Eq. 12 provides in-
sight into such pairwise comparison as ratios with
respect to C
C6
, in which I
C
C6
sim
(1) and I
C
C6
sim
(2) (com-
puted above) are used.
A
1
A
2
... A
54
A
1
1
59
44
... 0.15
A
2
44
59
1 ... 0.67
.
.
.
.
.
.
.
.
.
.
.
.
.
.
.
A
54
6.64 1.50 ... 1
➠
W
C
C6
A
1
0.187
W
C
C6
A
2
0.002
.
.
.
.
.
.
W
C
C6
A
54
3E-06
(12)
• I
c
avg
(i) (Average Indicator – Eq. 13): used to cal-
culate the average delays for reporting the main-
tenance reports per site (i.e., regarding C
T
) or the
average length of work description (i.e., C
B1
) per
site. Mathematically, I
c
avg
(i) is computed based on
Eq. 13, where q is either the reporting delay value
or the description length value of one of the k re-
ports carried out on Site i.
I
c
avg
(i) =
k
∑
q=1
q
k
(13)
➫ Let us assume that 4 maintenance reports have
been carried out on Site 1, and that the work de-
scription length is equal to 44, 5, 13 and 101 re-
spectively. In that case, the average indicator with
regard to C
B1
and Site 1 will be equal to 40.75
(see Eq. 14). Similarly to Eq. 12, the pairwise
comparison as ratios is computed considering all
I
c
x
(i) indicators and all alternatives. The final ma-
trix is not presented here due to the similarity with
the one presented in Eq. 12.
I
C
B1
avg
(1) =
44+ 5+ 13+ 101
4
= 40.75 (14)
Note that we highlighted in Table 1 (see last col-
umn) what indicators – I
c
sim
(i) or I
c
avg
(i)) – is used with
regard to each criterion.
3.3 Alternative Ranking
Figure 4 sums up all variables and related weights
computed in the previous sections. It is now neces-
sary to aggregate the different weights in order to con-
verge towards a final ranking of the alternatives/sites.
To this end, the global weight of each alternative with
respect to all criteria C
x
is computed based on Eq. 15.
GW
C
x
A
i
= W
C
x
A
i
×W
C
x
×W
C
x(parent)
(15)
Let us apply this formula in Eq. 16 considering
alternative A1 (i.e., Site 1) and criterion C
C6
, whose
DATA2015-4thInternationalConferenceonDataManagementTechnologiesandApplications
168
W
C
B1
0.540
W
C
B2
0.380
W
C
B3
0.080
W
C
C1
0.240
W
C
C2
0.165
W
C
C3
0.191
W
C
C4
0.128
W
C
C5
0.081
W
C
C6
0.085
W
C
C7
0.019
W
C
C8
0.089
W
C
B
= 0.33
W
C
C
= 0.33
W
C
T
= 0.33
Reporting Quality Assessment and Ranking of OEM Sites
1.00
Site 1 : W
C
B1
A
1
Site 2 : W
C
B1
A
2
Site 54 : W
C
B1
A
54
Site 1 : W
C
B3
A
1
Site 2 : W
C
B3
A
2
Site 54 : W
C
B3
A
54
Site 1 : W
C
C6
A
1
= 0.187
Site 2 : W
C
C6
A
2
= 0.002
Site 54 : W
C
C6
A
54
= 3E-06
Site 1 : W
C
T
A
1
Site 2 : W
C
T
A
2
Site 54 : W
C
T
A
54
Level 1
Level 2
Level 3
Level 4
See Eq. 5
See Eq. 4 & 6
See Eq. 12
Figure 4: AHP structure and associated weights.
Table 2: Global Weight Computation of all Alternatives with respect to all Criteria.
C
B1
C
B2
C
B3
∑
C
Bx
C
C1
C
C2
C
C3
C
C4
C
C5
C
C6
C
C7
C
C8
∑
C
Cx
∑
C
T
Site 1 GW
C
B1
A
1
... GW
C
B3
A
1
∑
x={1..3}
GW
C
Bx
A
1
... ... ... ... ... GW
C
C6
A
1
... ...
∑
x={1..8}
GW
C
Cx
A
1
GW
C
T
A
1
Site 2 GW
C
B1
A
2
... GW
C
B3
A
2
∑
x={1..3}
GW
C
Bx
A
2
... ... ... ... ... GW
C
C6
A
2
... ...
∑
x={1..8}
GW
C
Cx
A
2
GW
C
T
A
2
.
.
.
.
.
.
.
.
.
.
.
.
.
.
.
.
.
.
.
.
.
.
.
.
.
.
.
.
.
.
.
.
.
.
.
.
.
.
.
.
.
.
.
.
.
Site 54 GW
C
B1
A
54
... GW
C
B3
A
54
∑
x={1..3}
GW
C
Bx
A
54
... ... ... ... ... GW
C
C6
A
54
... ...
∑
x={1..8}
GW
C
Cx
A
54
GW
C
T
A
54
“parent criterion” is logically C
C
.
GW
C
C6
A
1
= W
C
C6
A
1
×W
C
C6
×W
C
C
(16)
= 0.187 × 0.085× 0.333
= 0.053
The global weight related to each alternative is
then computed as summarized in Table 2. It is thus
possible to aggregate those global weights per “par-
ent criterion”, i.e. regarding Believability (C
B
) Com-
pleteness (C
C
) and Timeliness (C
T
) as formalized in
the columns detoned by
∑
C
Bx
,
∑
C
Cx
and
∑
C
T
in Ta-
ble 2.
We do not further detail the calculations, we rather
provide (in Table 3) the final alternative/site ranking
with regard to each “parent criterion”; e.g., Site 1 is
ranked 17
th
out of the 54
th
sites in terms of ‘Believ-
ability’, 3
rd
out of the 54
th
sites in terms of ‘Com-
pleteness’, and 2
nd
in terms of ‘Timeliness’. Based
on these first results, first conclusions can be drawn:
Figure 5 provides a comparison view (using a spi-
der chart) among different alternatives/sites (we vol-
untary did not include the 54 alternatives for clarity
purposes) that helps us to see how good each com-
pany’s site is with regard to each data quality dimen-
sion. Note that in this case, the wider the shape (e.g.,
Site 11 and 32 have the widest/biggest shapes), the
better the company’s site.
In order to obtain the final ranking of the alterna-
tives, i.e. aggregating all alternative global weights
into a single and final score, it is necessary to sum
∑
C
Bx
,
∑
C
Cx
and
∑
C
T
regardingeach alternative/site.
Such results are presented and discussed in section 4.
Table 3: Site ranking with respect to each data quality di-
mension (i.e., parent criteria).
Believability Completeness Timeliness
Site 1 30
th
3
rd
2
nd
Site 2 4
th
15
th
27
th
Site 3 7
th
37
th
31
st
.
.
.
.
.
.
.
.
.
.
.
.
Site 11 33
rd
7
th
1
st
.
.
.
.
.
.
.
.
.
.
.
.
Site 32 2
nd
4
th
18
th
.
.
.
.
.
.
.
.
.
.
.
.
Site 37 46
th
52
th
37
th
.
.
.
.
.
.
.
.
.
.
.
.
Site 47 19
th
35
th
31
th
.
.
.
.
.
.
.
.
.
.
.
.
4 USE CASE RESULTS
This section presents the results of one experiment of
the maintenance reporting quality assessment.
In practice, our tool has been developed with Mat-
lab, which enables the executive officer to assess, at a
given point in time, the quality of the different com-
pany’s sites considering historical data/reports. The
assessment period can be adjusted by the officer as
he/she sees fit (e.g., to assess/compare sites over the
previous days, weeks or months). The user interface
(UI) provides the executive officer with the possibil-
DataQualityAssessmentofCompany'sMaintenanceReporting:ACaseStudy
169

Timeliness
1
st
12
th
23
th
34
th
1
st
12
th
23
th
34
th
45
th
54
th
45
th
34
th
23
th
12
th
1
st
Site 32
Site 11
Site 47
Site 37
Completeness
Believability
Figure 5: Comparison of sites 11, 32, 37 and 47.
ity to modify his/her preferences regarding the “pair-
wise comparison based on expert preferences”. For
example, if for some reasons he/she wants to give
further importance to the “Completeness” dimension
over Believability and Timeliness. Considering the
pairwise comparison as ratios, such rations are com-
puted by performing SQL queries against the OEM’s
information system that contains the maintenance re-
ports (cf. Figure 2).
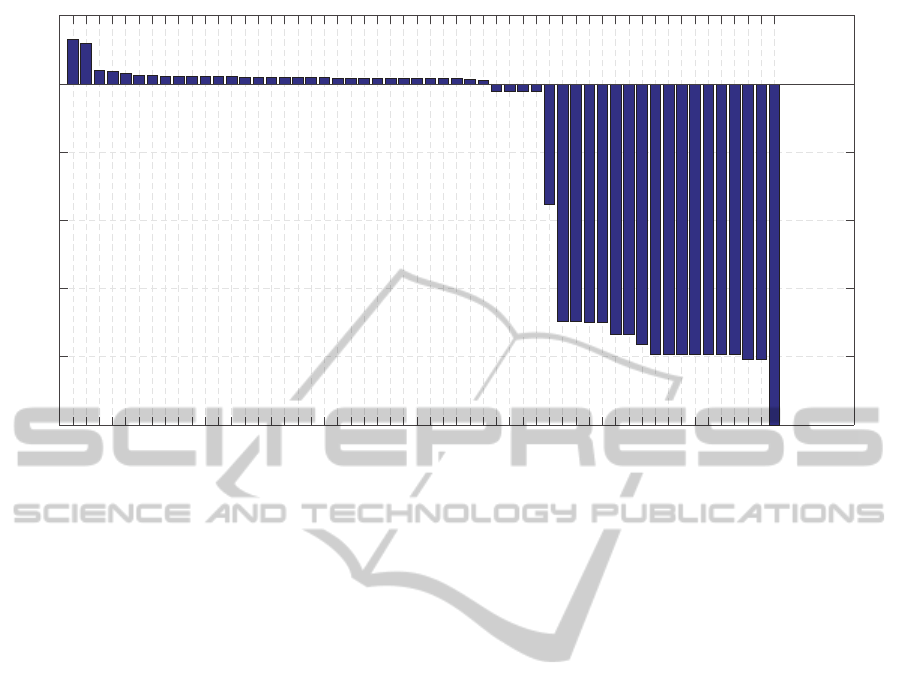
Based upon the executive officer preferences (the
ones specified throughout section 3), the histogram
in Figure 6 gives insight into the maintenance report-
ing quality assessment results: x-axis referring to the
54 sites, y-axis giving the quality maintenance report-
ing quality score. In total (considering all reports,
from all sites), 275.585 reports have been processed
and analyzed. The histogram shows that some qual-
ity scores dropped below “0”; the reason being that
a penalty score has been introduced when a report
field was left empty
3
. The histogram thus provides the
overall ranking: Site 11 has the better quality score,
followed by Site 1, Site 18... ; Site 15 has the low-
est quality score. Although the histogram does not
provide enough information to identify the reasons
for a good or non-standard reporting, it nonetheless
provides first insights into qualitative results that may
help to understand some of the reasons (e.g., a lack
of training, insufficient manpower, . ..). These results
also offer the opportunity to identify and understand
the good reporting practices from the best sites so as
to learn and apply those practices on the less perfor-
3
Although other penalty strategies could be applied, we
propose as a first step to define the penalty as (−1 × K)
with K the criterion importance (signifying that the higher
the criterion importance, the higher the penalty score for not
having filled out the report field)
mant sites. Another action from the executive officer
perspective is to cluster the sites based on reporting
quality, thus enabling easier implementation of cor-
rective actions driven by the clustering.
Again, let us remember that the executive officer
has the possibility to customize his/her own UI dash-
board by selecting different views, e.g. the histogram
view (Figure 6), the spider chart view (Figure 5), etc.,
each of them providing more or less detailed and ag-
gregated information (the level of aggregation of the
results varies depending upon the selected view).
5 CONCLUSIONS
In recent years, implementation of effective mainte-
nance strategies proved to be a significant source for
financial savings and enhanced productivity. At the
heart of those strategies is the quality of data that
includes, among other things, maintenance reporting
activities. Indeed, maintenance data has directs im-
pact on other company activities such as on:
• after-sales services: the quality of maintenance
reports makes it possible to assess the mainte-
nance work, thus helping to reach a higher quality
after-sales services;
• on the design of future generations of products:
processing and analyzing ‘relevant’ maintenance
reports help to better understand how the products
from the company behave throughout their prod-
uct lifecycle, thus helping to enhance the design
of the next product generations (Fr¨amling et al.,
2013);
• predictive maintenance strategies: providing real-
time and remote predictivemaintenance is becom-
ing a very promising area in the so-called IoT
(Buda et al., 2015), whose objective is to provide
systems with the capability to discover and pro-
cess real-time data and contexts so as to make
pro-active decisions (e.g., to self-adapt the sys-
tem before a possible failure). Although real-time
data is of the utmost importance in the predictive
maintenance process, combining such data with
historical maintenance reporting data (regarding a
specific product item) has the potential to gener-
ate new knowledge, thus leading to more effective
and product-centric decisions;
• government regulation compliance: in some do-
mains, it is mandatory to comply with govern-
ment regulations (e.g., in automotive, avionics, or
healthcare domains). In this respect, assessing the
quality of maintenance reporting can prevent the
company from having regulation non-compliance
DATA2015-4thInternationalConferenceonDataManagementTechnologiesandApplications
170
Site 11
Site 1
Site 18
Site 34
Site 25
Site 33
Site 10
Site 43
Site 42
Site 49
Site 32
Site 4
Site 35
Site 9
Site 12
Site 5
Site 22
Site 52
Site 39
Site 21
Site 2
Site 46
Site 36
Site 38
Site 51
Site 40
Site 16
Site 50
Site 27
Site 13
Site 41
Site 23
Site 3
Site 28
Site 47
Site 20
Site 26
Site 44
Site 6
Site 7
Site 29
Site 24
Site 17
Site 19
Site 14
Site 8
Site 30
Site 31
Site 45
Site 53
Site 54
Site 37
Site 48
Site 15
-1
-0.8
-0.6
-0.4
-0.2
0
0.2
Overall Data Quality Score
Figure 6: Site ranking according to the maintenance reporting quality assessment study.
issues, e.g. by carefully following the data qual-
ity on each company’s site and identifying when
the quality is too poor, or when a key data quality
dimension is not of sufficient quality;
Given the above statements, a methodology for as-
sessing the quality of enterprises’ daily maintenance
reporting is developed in this paper, which relies, on
the one hand, on the Krogstie’s data quality frame-
work and, on the other hand, on a simple arithmetic
MCDM framework (AHP) in order to handle the ag-
gregation of the expert preferences, application fea-
tures, etc. (the reason for combining both techniques
being given in sections 2 and 3). An important as-
pect of our methodology, and adapted framework, is
that this framework can further be extended in two re-
spects:
• Data quality framework extension: as highlighted
in Figure 1, only a few concepts and relation-
ships from the Krogstie’s framework were con-
sidered (semantic quality, knowledge quality... ),
which is mainly due to the company’s expecta-
tions and needs. Accordingly, the framework can
be further extended considering the other con-
cepts/relationships (not used yet) such as Lan-
guage Quality (e.g., for domain appropriateness,
participant knowledge appropriateness...), Syn-
tactic Quality (e.g., for syntactical correctness
purposes, meaning that all statements in the model
are according to the syntax of the language), and
so forth;
• AHP structure extension: as described in sec-
tion 2.2, a first set of criteria and sub-criteria
have been considered, but further data quality di-
mensions can easily be added to the overall AHP
structure (see Figure 3).
Our maintenance reporting quality assessment
framework has been developed and applied in cooper-
ation with a Finnish OEM company in order to eval-
uate and rank 54 office branches, which are spread
in different countries. Based on this initial evaluation
(cf. section 4), the OEM partner has since then es-
tablished adapted action plans for enhanced reporting
practices, and is now interested in extending this ini-
tial framework.
ACKNOWLEDGEMENT
This research was conducted in the Future Industrial
Services (FutIS) research program, managed by the
Finnish Metals and Engineering Competence Clus-
ter (FIMECC), and funded by the Finnish Funding
Agency for Technology and Innovation (TEKES), re-
search institutes.
REFERENCES
Atzori, L., Iera, A., and Morabito, G.(2010). The internet of
things: A survey. Computer networks, 54(15):2787–
2805.
Batini, C., Cappiello, C., Francalanci, C., and Maurino, A.
(2009). Methodologies for data quality assessment
DataQualityAssessmentofCompany'sMaintenanceReporting:ACaseStudy
171

and improvement. ACM Computing Surveys (CSUR),
41(3):16.
Berndt, D. J., Fisher, J. W., Hevner, A. R., and Studnicki,
J. (2001). Healthcare data warehousing and quality
assurance. Computer, 34(12):56–65.
Buda, A., Kubler, S., Borgman, J., Fr¨amling, K., Mad-
hikermi, M., and Mirzaeifar, S. (2015). Data supply
chain in industrial internet. In Proceedings of the 11th
IEEE World Conference on Factory Communication
Systems.
Dunn, S. (1998). Reinventing the maintenance process: to-
wards zero downtime. In Queensland Maintenance
Conference Proceedings, Queensland, Australia.
Figueira, J., Greco, S., and Ehrgott, M. (2005). Multiple
criteria decision analysis: state of the art surveys, vol-
ume 78. Springer Science & Business Media.
Fr¨amling, K. (1996). Mod´elisation et apprentissage des
pr´ef´erences par r´eseaux de neurones pour l’aide `a la
d´ecision multicrit`ere. PhD thesis, INSA Lyon.
Fr¨amling, K., Holmstr¨om, J., Loukkola, J., Nyman, J., and
Kaustell, A. (2013). Sustainable plm through intelli-
gent products. Engineering Applications of Artificial
Intelligence, 26(2):789–799.
Jarke, M. and Vassiliou, Y. (1997). Data warehouse quality:
A review of the dwq project. In IQ, pages 299–313.
Kahn, B. K., Strong, D. M., and Wang, R. Y. (2002). Infor-
mation quality benchmarks: product and service per-
formance. Communications of the ACM, 45(4):184–
192.
Knight, S.-A. and Burn, J. M. (2005). Developing a frame-
work for assessing information quality on the world
wide web. Informing Science: International Journal
of an Emerging Transdiscipline, 8(5):159–172.
Krogstie, J., Lindland, O. I., and Sindre, G. (1995). Defin-
ing quality aspects for conceptual models. Proceed-
ings of the IFIP8.1 Working Conference on Informa-
tion Systems Concepts: Towards a Consolidation of
Views, 1995:216–231.
Lindland, O. I., Sindre, G., and Solvberg, A. (1994). Un-
derstanding quality in conceptual modeling. Software,
IEEE, 11(2):42–49.
Mardani, A., Jusoh, A., and Zavadskas, E. K. (2015).
Fuzzy multiple criteria decision-making techniques
and applications–two decades review from 1994 to
2014. Expert Systems with Applications.
Mobley, R. K. (2002). An introduction to predictive main-
tenance. Butterworth-Heinemann.
Peabody, J. W., Luck, J., Jain, S., Bertenthal, D., and Glass-
man, P. (2004). Assessing the accuracy of administra-
tive data in health information systems. Medical care,
42(11):1066–1072.
Price, R. J. and Shanks, G. (2009). A semiotic information
quality framework: Theoretical and empirical devel-
opment.
Saaty, T. L. (1980). The analytic hierarchy process: plan-
ning, priority setting, resources allocation. New York:
McGraw.
Saaty, T. L. (1990). How to make a decision: the analytic
hierarchy process. European journal of operational
research, 48(1):9–26.
Saaty, T. L. (1996). Decision making with dependence
and feedback: The analytic network process, volume
4922. RWS publications Pittsburgh.
Tzeng, G.-H. and Huang, J.-J. (2011). Multiple attribute de-
cision making: methods and applications. CRC Press.
Wang, R. Y. and Strong, D. M. (1996). Beyond accuracy:
What data quality means to data consumers. Journal
of management information systems, pages 5–33.
Zheng, G., Zhu, N., Tian, Z., Chen, Y., and Sun, B. (2012).
Application of a trapezoidal fuzzy ahp method for
work safety evaluation and early warning rating of hot
and humid environments. Safety Science, 50(2):228–
239.
DATA2015-4thInternationalConferenceonDataManagementTechnologiesandApplications
172
