
Systematic Equipment Performance Analysis of Canadian Kraft Mill
Through New and Adapted Key Performance Indicators
Doctoral Consortium Contributions
Radia Ammara, Louis Fradette and Jean Paris
Department of Chemical Engineering, École Polytechnique de Montreal, Montréal, Canada
1 RESEARCH PROBLEM
Lower paper prices and demand, external
competition and high energy and chemical costs
have caused economic problems for the Canadian
pulp and paper industry. As a result to this
precarious situation, significant efforts are being
undertaken to transform the pulp and paper industry
into an efficient a profit-oriented industry. A pioneer
solution to address this issue is the retrofitting of
biorefineries into existing mills. This alternative
helps P&P mills diversify their product portfolio and
generate new revenues. However, this
implementation requires additional supply of energy.
Thus, a key step to be undertaken before
implementation of a biorefinery option is the
optimization of a mill with respect to energy and
material. Several process integration (PI) techniques
such as pinch analysis or mathematical optimization
showed interesting results when applied in
methodological way to a P&P mill (Kermani et al.,
2014). However, these integration or optimization
techniques implicitly assume that the unit operations
and equipments in place operate efficiently and as
intended to (Moshkelani et al., 2013), which is often
not the case in a real Kraft mill. On the other hand,
there is no incentive in seeking to optimize a
process, when it does not fairly represent the real
system. The results of the optimisation technique are
in this case biased and not trustworthy. Equipment
performance analysis is a necessary prerequisite step
to be undertaken prior to any optimization or
enhancement measure. The assessment of equipment
performance applied in a strategic and
methodological way using adapted key indicators
can help identify areas with poor efficiency,
diagnose the causes of inefficiencies and propose
improvement projects with low investment cost and
that can significantly reduce the operating cost of the
mill (Keshtkar, 2013); (Mateos-Espejel et al.,
2010a); (Mateos-Espejel et al., 2010b); (Mateos-
Espejel et al., 2011a); (Mateos-Espejel et al., 2011c).
2 OUTLINE OF OBJECTIVES
The main objective of this research study is to
develop a strategic methodology to evaluate the
performance of unit operations using new and
adapted key performance indicators. The systematic
approach allows to:
Systematically identify areas and equipments
with poor performance from the perspective of
energy, water and raw materials utilization,
through the use of new and adapted key
performance indicators.
Diagnose effectively the causes of inefficiency.
More than one KPI will be used to characterize
the unit operation and thus allowing a better
understanding of performance.
Propose improvement projects to address the
found inefficiencies.
At the end o this research study, a practical step by
step guideline will be provided to the mills managers
to help them characterize their unit operations,
analyse their energy efficiency, examine their
utilization of material and resources and diagnose
the performance of key unit operations with more
than one KPI for the purpose of overall performance
monitoring, control and enhancement.
3 STATE OF THE ART
Pulp and Paper industry ranks fourth in terms of
energy consumption among industries worldwide.
Globally, in 2007, the P&P industry accounted for
approximately 5% of total world industrial final
energy consumption. The pulp and paper industry
produces various types of pulp from virgin materials
(wood and non-wood) and recycled materials (waste
paper) that are subsequently processed into paper
produced in either integrated or non-integrated mill.
The Kraft process is the prevalent pulping
3
Ammara R., Fradette L. and Paris J..
Systematic Equipment Performance Analysis of Canadian Kraft Mill Through New and Adapted Key Performance Indicators - Doctoral Consortium
Contributions.
Copyright
c
2015 SCITEPRESS (Science and Technology Publications, Lda.)
process in North America because of its closed loop
recovery of pulping chemical and its strong and
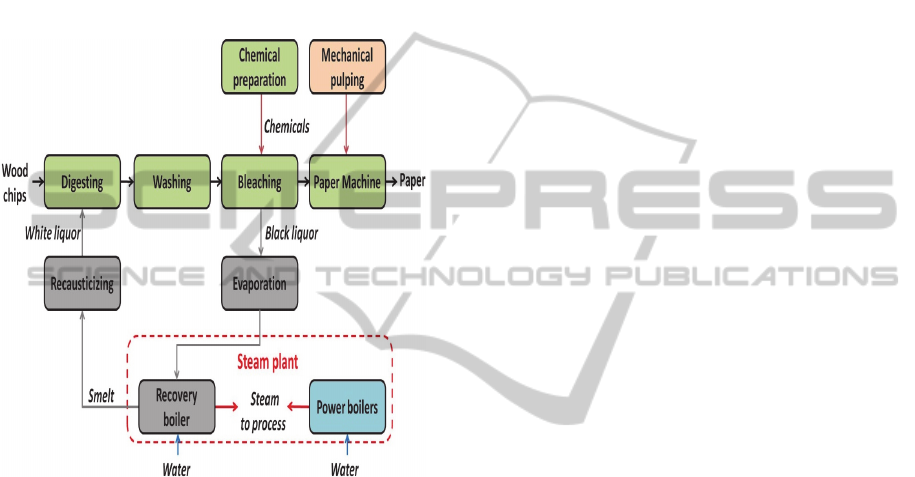
bright produce. A simplified schematic of the Kraft
process is shown in figure (1).
Kraft process consists of two main parts: a paper
line and a chemical recovery line. The paper line is
composed of four departments: digesting where the
woodchips are cooked, washing, bleaching and
chemical preparation where the remaining lignin is
removed from the fibers, and finally the paper
machine.
Figure 1: Simplified diagram of the mill Kraft process.
The core of the Kraft process is the chemical
digester (also called cooking vessel) in which the
individual cellulosic fibers are separated from lignin
to form pulp. A series of counter-current washers is
used to separate the black liquor from the fibers in
the washing department. The purpose of bleaching is
to remove the leftover lignin and brighten the fibers.
Modern bleaching is achieved through a continuous
sequence of process stages using different chemicals
and conditions in sequence. The bleached pulp is
then sent to paper machine. The chemicals used on
site are prepared in the chemical preparation
department. On the other hand, the chemical
recovery line consists of three main departments:
evaporation, recovery boiler, and chemical recovery.
The weak black liquor (spent cooking liquor coming
out of the digester) is concentrated in multi-effect
evaporators and then concentrated before being
burnt the recovery boiler to produce steam for the
process and recover the spent chemicals. The latter
is sent to the chemical recovery plant where a series
of reactions take place and the white liquor is
regenerated and sent back to the digester.
Process integration (PI) is an efficient approach
that allows industries to increase their profitability
through reduction of energy, water and raw material
consumption and thus reducing their operating costs.
PI embodies several conventional methods such as
pinch analysis, mathematical optimization or hybrid
techniques combining both the thermodynamics of
pinch and the numerical computations of the
mathematical optimization.
The problem of these process integration
techniques implicitly assume that unit operations
and equipments in place operate efficiently or as
intended to (Moshkelani et al., 2013). In reality, this
is often not the case. Equipment performance
analysis is a necessary prerequisite step prior to
undertake any integration measure. However, this
prerequisite step of evaluation of the process is
either simple or nonexistent in the actually available
and published Kraft or integrated biorefineries
performance enhancement/optimization methodo-
logies. There are no clear guidelines on how to
define a base case and how to evaluate a process for
complete performance efficiency in terms of energy
and resources utilization. There is no systematic or
strategic methodology for a complete equipment
performance analysis. Also, the key performance
indicators available and used are not well suited to
efficiently identify and diagnose the causes of
inefficiencies in the mill, in terms of process
performance or energy and material utilization
(Villarreal, 2011); (Mateos-Espejel, 2009).
On the other hand, pulp and paper mills have
several recycle streams that increase process
interactions, which makes conventional pinch
analysis or process integration techniques ill-suited.
These techniques are applied to tackle energy
efficiency without regards to the interactions of the
complete process systems. Thus, fail to address the
problems or the entire process with its interactions.
An equipment performance analysis when
strategically developed and applied may consider
both specific operating conditions of a unit operation
and its interactions with other sections of the
process. Many key performance indicators have
been developed and applied; however, they evaluate
the efficiency of a process or a unit operation by
comparing it to other mills and not to their own
theoretical maximum efficiencies. These KPIs may
be applied as a pre-benchmarking study helping
mills managers situate their energy consumption
performance comparing to that of other mills.
However, the available KPIs do not take into
SMARTGREENS2015-DoctoralConsortium
4

account operating conditions and design parameters.
This makes them not very suited for a good
performance analysis.
Dimensional analysis is a mathematical system
using conversion factor to move one unit of
measurement to a different unit of measurement
(Langhaar, 1951). The basic idea of dimensional
analysis is that physical laws do not depend on the
arbitraries in the choice of units of physical
quantities. Every physical equation or relation
between variables and/or dimensioned constants
should be dimensionally consistent. In other words,
each term of the equation or relation should have the
same dimensions. Dimensional consistency imposes
a certain number of constraints that are functional
relations between the variables. This constitutes the
main principle for dimensional analysis.
Manipulating variables to create dimensionless
groups or numbers to describe the physical
phenomenon has widely been used in the chemical
engineering or fluid mechanics field such as
Reynolds number (Re) to describe the type of flows
in all types of fluid problems, Froude number (Fr),
for modeling flow with a free surface, or Nusselt
(Nu), Biot (Bi), Peclet (Pe) for heat transfers or
Carnot (ƞ) for energy efficiency. Hence, it is a
pertinent idea to create performance indicators based
on dimensional analysis.
Pulp and paper industries are driven by steam,
water and chemicals which makes them suitable for
exergy studies. Exergy analysis is a valuable tool to
evaluate the efficiency of a process. However, it has
not evolved into a systematic method, such as Pinch
Analysis or Water Pinch and has not been applied on
a real Canadian Kraft mill, in combination with
other tools for equipment performance analysis.
Moreover, traditional energy studies only consider
thermal energy. Exergy analysis considers all forms
of energy and also the internal energy of the matter
called chemical exergy.
Most published studies on performance
evaluation analysis or energy improvement methods
are based on computer simulation models. A
recurrent problem of process simulation is the lack
of explanation or information of how the data, used
for all analyses, were gathered or treated. The
simulation models are often not based on real
reconciled mill data. There is no incentive in seeking
to optimize a model, when it does not match the
actual behavior of the real plant. A representative
model based on reconciled data is a prerequisite step
to any optimization or evaluation measure.
However, lack of data redundancy in real Kraft mills
has made data reconciliation complicated or
unfeasible. No data reconciliation of a complete
operating Canadian Kraft mill has been published.
There have been studies on data reconciliation on
Canadian newsprint mills, but never on a real Kraft
mill (Bellec et al., 2007); (Jacob and Paris, 2003).
4 METHODOLOGY
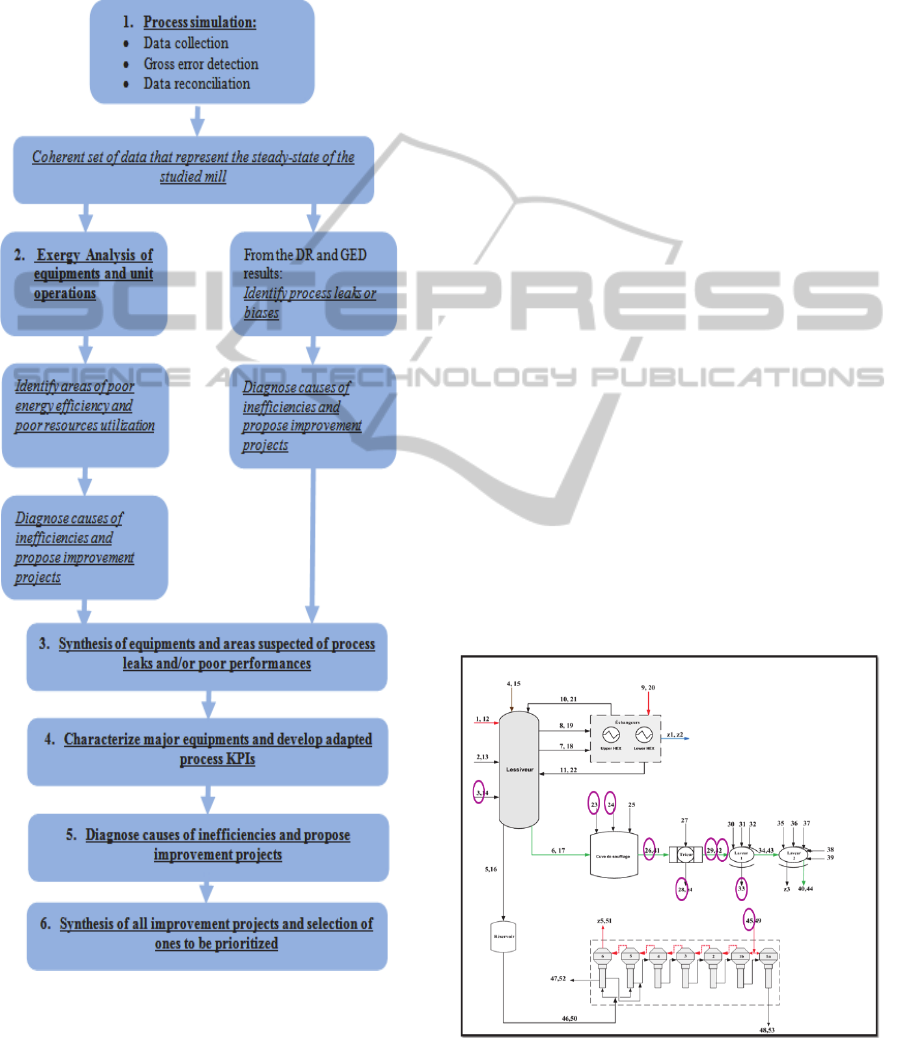
To perform a complete equipment performance
evaluation, the overall unified methodology shown
in figure 8 is developed and applied. It consists of 6
main steps. The first step is to obtain a coherent
model simulation that represents a steady-state of the
process. To do so, real mill data collection, gross
error detection and data reconciliation have been
performed. Mill measurements data are collected for
a chosen period of time. Since measurements
inherently contain random errors due to sensors
noise, the mass and balance around unit operations
often do not balance. Data reconciliation is an
optimization problem that aims to minimize the
weighted sum of squared differences between the
measured and the reconciled values under
constraints that correspond to mass and heat balance
(Bagajewicz, 2000); (Leibman et al., 1992); (Maquin
et al., 2000); (Maquin et al., 1989). On the other
hand, while DR is meant to correct random errors,
gross errors due to a sensor failure should be
detected first (Maronas and Arcas, 2009). This is
done by verifying that all measurements remain
within acceptable data range. Many statistical tests
have been developed. However, they have never
been applied on a real operating mill (Dewulf et al.,
2008); (Gong and Wall, 1997); (Gong and Wall,
2001); (Regulagadda et al., 2010); (Sato, 2004). The
results of the GED and DR show largely adjusted
areas. This helps identify possible process leaks or
biases present in the system (Krishnan-Dumitrescu,
2008). DR allows getting a coherent process model
that represents a steady-state of the studied mill and
also identifies a preliminary list of suspected
problematic unit operations. Largely adjusted areas
are highlighted for further analysis.
From the coherent steady-state of the process,
exergy analysis of individual unit operations and of
entire departments of the process has been
performed. Exergy is a measure of both quality and
quantity of the energy involved in transformations
within and across the boundaries of a system. Unlike
energy, exergy can be destroyed or lost, and thus
unavailable for future transformation with the
process system. Hence exergy analysis allows
SystematicEquipmentPerformanceAnalysisofCanadianKraftMillThroughNewandAdaptedKeyPerformance
Indicators-DoctoralConsortiumContributions
5
identifying poor energy performance areas and gives
insight on how well exergy is used onsite.
Data reconciliation and exergy analysis help
target problematic areas. A list of suspect poor
performance efficiency equipments is established.
Figure 2: Overall methodology.
Adapted key performance indicators are
developed to characterize and describe the process
efficiency of the listed suspect equipments. A
synthesis of improvement projects is then
performed.
A list of priority improvement projects are
proposed and recommended to the mills, in order to
improve their overall efficiency.
Key performance indicators are developed by
doing a dimensional analysis study around each unit
operation. More than one KPI is used to describe the
performance of the phenomena that takes place in a
unit operation.
Figure 1 schematically displays the proposed
overall methodology of the PhD study.
5 EXPECTED OUTCOME
Figures 3 and 4 display the results from the three
first steps of the methodology. Figure 2 displays the
largely adjusted variables in the process after data
reconciliation. 53 measured variables have been
considered to be able to obtain an observable
representative system, suitable for reconciliation.
The variables being largely adjusted are gathered
around specific unit operations suspected of poor
performance efficiency or process leak or biase.
Data reconciliation and gross error detection
identified the washing and digester departments and
more precisely the steaming vessel (in the digester)
and the 2 brown stock washers to be inefficient.
DR and GED fail to identify or locate the error
without any doubt. It should be combined with other
tools to effectively locate the error and diagnose the
cause of inefficiency.
Figure 3: Largely adjusted areas after data reconciliation.
SMARTGREENS2015-DoctoralConsortium
6
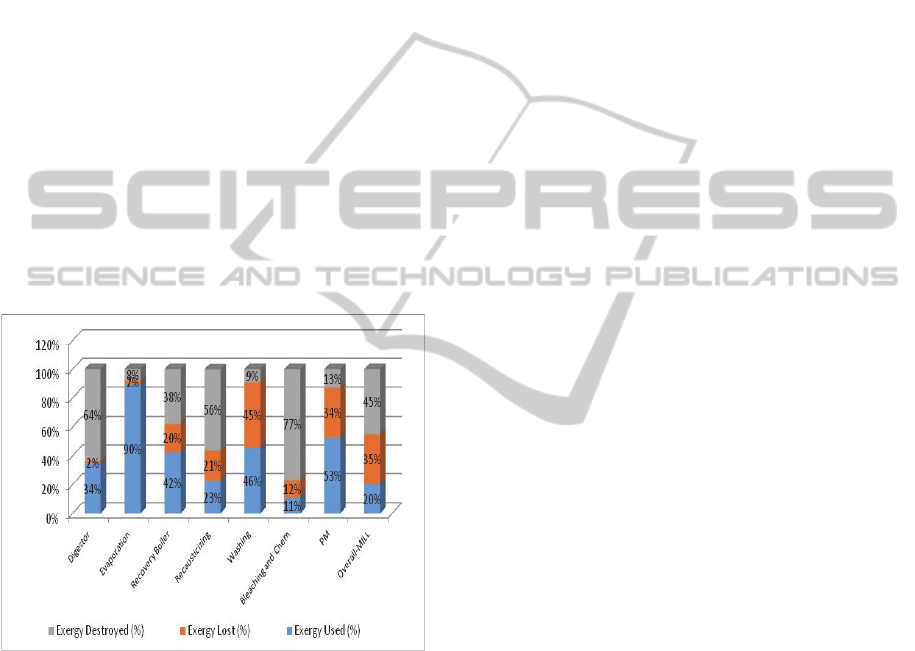
Figure 3 displays the results of the exergy
analysis performed around all unit operations and
sections of the case-study process. Chemical,
electrical and thermal exergies have been
considered. Kinetic and potential exergies have been
neglected. Exergy efficiency has been defined as the
ratio of the exergy of useful output product over the
useful exergy input. This definition is very
appropriate from engineering and practical point of
view as the lost or unavailable exergy is not used
within a system and the transiting exergy does not
contribute in any exergy transformation and thus
should not be considered in the calculation of the
efficiency. The digester, washing, recausticizing,
bleaching and steam plant departments are areas
where energy savings are possible. Exergy
destruction could be reduced in the digester and the
recovery and power boilers. Exergy lost from the
washing and steam plant could be reduced by
recovery of the heat content of the effluents and
stack gases. This is possible either by PI techniques
and/or by combination with the installation of heat
upgrading systems.
Figure 4: Exergy efficiency per department (%).
The steaming vessel, the brown stock washers 1
and 2, the D
0
EOPD
1
bleaching towers, the recovery
boiler and 4 power boilers and the clarifiers should
be further investigated using more specific and
adapted KPIs to diagnose the cause of inefficiencies.
This is done in steps 4, 5 and 6 of the methodology.
Dimensional analysis of key equipments gave
rise to a number of nondimensional groups with
significant physical meaning and that describe the
phenomena that takes place in the unit operation.
The main characteristics of these non-dimensional
groups are that they describe the phenomena looking
into account operating conditions and design
parameters which makes them suitable for KPIs
developments.
At the end of this PhD thesis, practical and
adapted KPIs will be developed for all key
equipments of the Kraft process. A practical
stepwise guideline will be provided for mills
engineers to assist them in their equipment
performance evaluation.
REFERENCES
Maziar Kermani, Z.P.-L., Marzouk Benali, Luciana
Savulescu, Francois Maréchal. An Improved Linear
Programming Approach for Simultaneous
Optimization of Water and Energy. in 24th European
Symposium on Computer Aided Process Engineering.
2014. Budapest, Hungary: Elsevier.
Moshkelani, M., et al., The forest biorefinery and its
implementation in the pulp and paper industry:
Energy overview. Applied Thermal Engineering, 2013.
50(2): p. 1427-1436.
Keshtkar, M.J., Steam and Water Combined Analysis
Integration and Efficiency Ehancement in Kraft
Pulping Mills, in Chemical Engineering
Department2013, Ecole Polytechnique de Montreal.
Mateos-Espejel, E., et al., Simulation of a Kraft pulp mill
for the integration of biorefinery technologies and
energy analysis. Pulp & Paper Canada, 2010a. 111(3):
p. 19-23.
Mateos-Espejel, E., et al., Systems interactions analysis
for the energy efficiency improvement of a Kraft
process. Energy, 2010b. 35(12): p. 5132-5142.
Mateos-Espejel, E., L. Savulescu, and J. Paris, Base case
process development for energy efficiency
improvement, application to a Kraft pulping mill. Part
I: Definition and characterization. Chemical
Engineering Research and Design, 2011a. 89(6): p.
742-752.
Mateos-Espejel, E.S., L., Marechal, F., Paris, J., Unified
Methodology for thermal energy efficiency
improvement: Application to Kraft process. Chemical
Engineering Science 2011c. 66: p. 135-151.
Garza Villarreal, H., Assessment and Enhancement of the
Performance of the Pulp Washing Operation in Kraft
Mills, 2011, École Polytechnique de Montréal.
Mateos-Espejel, E., Development of a Stratergy for
Energy Efficiency Improvement in Kraft Process
Based on Systems Interactions Analysis, P. Montreal,
Editor 2009.
Langhaar, H.L., Dimensional analysis and theory of
models. Vol. 2. 1951: Wiley New York.
Bellec, S., et al., On-line processing and steady-state
reconciliation of pulp and paper mill process data.
PULP AND PAPER CANADA-ONTARIO-, 2007.
108(6): p. 36.
Jacob, J. and J. Paris, Data sampling and reconciliation:
application to pulp and paper mills. Part: I
SystematicEquipmentPerformanceAnalysisofCanadianKraftMillThroughNewandAdaptedKeyPerformance
Indicators-DoctoralConsortiumContributions
7

methodology and implementation. Appita journal,
2003. 56(1): p. 25-29.
Bagajewicz, M., A brief review of recent developments in
data reconciliation and gross error
detection/estimation. Latin American Applied
Research, 2000. 30: p. 335-342.
Leibman, M.J., T.F. Edgar, and L.S. Lasdon, Efficient data
reconciliation and estimation for dynamic processes
using nonlinear programming techniques. Computers
& chemical engineering, 1992. 16(10–11): p. 963-986.
Maquin, D., O. Adrot, and J. Ragot, Data reconciliation
with uncertain models. ISA transactions, 2000. 39(1):
p. 35-45.
Maquin, D., M. Darouach, and J. Ragot, Observability and
data validation of bilinear systems. Advanced
Information Processing in Automatic Control,
AIPAC'89, 1989: p. 113-118.
Maronna, R. and J. Arcas, Data reconciliation and gross
error diagnosis based on regression. Computers &
chemical engineering, 2009. 33(1): p. 65-71.
Dewulf, J., et al., Exergy: its potential and limitations in
environmental science and technology. Environmental
Science & Technology, 2008. 42(7): p. 2221-2232.
Gong, M. and G. Wall, On exergetics, economics and
optimization of technical processes to meet
environmental conditions. Work, 1997. 1: p. 5.
Gong, M. and G. Wall, On exergy and sustainable
development—Part 2: Indicators and methods.
Exergy, An International Journal, 2001. 1(4): p. 217-
233.
Regulagadda, P., I. Dincer, and G.F. Naterer, Exergy
analysis of a thermal power plant with measured
boiler and turbine losses. Applied Thermal
Engineering, 2010. 30(8–9): p. 970-976.
Sato, N., Chemical Energy and Exergy. Chemical,
Petrochemical & Process2004: Elsevier Science Ltd.
1-160.
Lucia krishnan-Dumitrescu, W.e.o.a.c.L., Data
reconciliation for Industrial Processes, in 18th
European Symposium on Computer Aided
Engineering2008, Elsevier.
SMARTGREENS2015-DoctoralConsortium
8
