
Establishing Construction Scheduling Progress Curve based on
Buidling Information Modeling Quantity Takeoffs
Kun-Chi Wang
1
, Wei-Hao Wu
1
, Pei-Yuan Hsu
1
, Abdoul-Aziz Gansonre
1
,
Wei-Chih Wang
1
and Cheng-Ju Kung
2
1
Department of Civil Engineering, National Chiao Tung University, Hsinchu, Taiwan
2
Concord Tech Co., Ltd, Taipei, Taiwan
Keywords: Building Information Modeling, Construction Schedule Control, Quantity Takeoff, Cost Cumulative Curve
(S-curve), Scheduling Activities, Cost Items.
Abstract: A cost cumulative progress curve (called S-curve) is often used as a basis for effective schedule control
which is a key to the success of construction projects. In establishing a planned S-curve of a construction
project, the cost of each scheduling activity must be determined. Furthermore, the contractual costs
associated with the cost items should be fully distributed to all scheduling activities. However, the
relationships between scheduling activities and cost items are complex because these relationships may be
1-to-1, many-to-1 or many-to-many relations. This research proposes a searching algorithm to conduct
quantity takeoffs in Revit and QTO to facilitate the establishment of the planned S-curve. The proposed
search algorithm defines different search steps (using various searching parameters, such as "floor",
"physical object", "cost item", and "area") to identify corresponding cost items associated with different
types of activities. The benefits of the proposed algorithm is demonstrated by applying it to a high-tech
facility building in northern Taiwan.
1 INTRODUCTION
Project scheduling is a fundamental task in the
management and execution of construction projects
(Hendrickson and Au 2003). A cost cumulative
curve (called S-curve), a graphical representation of
the cumulative progress of a construction project,
from start to finish, is often used as a basis for
effective schedule control of a project. In
constructing a planned S-curve of a construction
project, the cost of each scheduling activity must be
determined. Notably, the contractual costs associated
with the cost items should be fully allocated to all
scheduling activities.
To calculating the costs of an activity, first, one
needs to determine the quantities of the planned
construction materials (such as reinforced steel, form,
and concrete) associated with the activity. Then,
based on the unit prices associated with the
construction materials, the costs of the activity are
obtained by multiplying the quantities and unit
prices. However, finding the construction materials
associated with each activity is complicated because
the relationships between activities and construction
materials (or cost items) may be 1-to-1, many-to-1
or many-to-many relations.
Consider a many-to-many relationship for
example. Both activities, setting 1st-floor
columns/walls steel and setting 1st-floor beams/slabs
steel, are related to the costs of two cost items
(construction materials), SD420W steel and SD420
steel. Furthermore, for instance, the activities of
280kgf/cm2 concrete grouting for the 1st floor slab,
the 2nd floor slab and the 3rd floor slab represent a
many-to-one relationship, where “many” activities
corresponds to “one” cost item (280kgf/cm2
concrete). Although this above calculation process is
possible, it is highly time-consuming and error-
prone.
Recently, BIM quantity takeoffs capacity has
progressively shown its effectiveness (Shen and Issa
2010; Chen 2011; Chai 2012; Wijayakumar and
Jayasena 2013). This study thus intends to utilize
BIM quantity takeoffs capacity to support the
quantity takeoffs of each scheduling activity for
obtaining the costs, leading to the establishment of a
planned S-curve for effective schedule control.
139
Wang K., Wu W., Hsu P., Gansonre A., Wang W. and Kung C..
Establishing Construction Scheduling Progress Curve based on Buidling Information Modeling Quantity Takeoffs.
DOI: 10.5220/0005522901390144
In Proceedings of the 10th International Conference on Software Engineering and Applications (ICSOFT-EA-2015), pages 139-144
ISBN: 978-989-758-114-4
Copyright
c
2015 SCITEPRESS (Science and Technology Publications, Lda.)

2 LITERATURE REVIEW
2.1 BIM Quantity Takeoffs
While traditional estimation methods conduct
quantity takeoffs from 2D CAD drawings, a BIM
tool can obtain the required data and measurements
for quantity takeoff from a 3D model (Rundell 2006;
Shen and Issa 2010). Recently, many researchers in
Taiwan have developed BIM-based tools to support
quantity takeoffs. For example, Chen (2011) used
Autodesk Revit to perform quantity takeoffs for a
twelve-story reinforced concrete office building. His
study showed that the quantities of concrete and
steel extracted from BIM were 0.5% and 3.7% less
than the conventional estimation, respectively. Chai
(2012) developed a Revit API program to
automatically calculate the quantities of forms.
Regarding the quantities of forms, for instance, the
BIM generates the results were close to the ones
calculated manually, with only 1% difference.
2.2 BIM and Cost Estimates
Eastman et al. (2011) pointed out that although there
are BIM-based quantity takeoffs tools available to
assist the cost estimates, there is no BIM software
with full estimation functions. Therefore, a cost
estimator must either export the BIM quantities into
the cost estimation software, Link the BIM tool
(software) to the cost estimation software through an
API, or export BIM model data into a BIM-based
cost estimation software (Rundell 2006; Eastman et
al. 2011).
3 MODEL FOR ESTABLISHING A
S-CURVE
This study proposes a model to establish S-curves of
construction projects. The proposed model consists
of four steps, as shown in Fig. 1: (1) developing a
BIM model associated with cost items, (2)
conducting searching algorithms to perform quantity
takeoffs in Autodesk QTO, (3) mapping contractual
unit prices from cost estimation software, and (4)
converting to Excel to build a S-curve. These four
steps are described in the following subsections.
Step 1: Developing a BIM Model Associated
With Cost Items.
In the proposed model, first, a BIM model with the
level of detail (LOD) 300 must be built. This BIM
model is composed of physical components and
information parameters. Physical components are
such as columns, beams, walls, slabs, doors,
windows and rooms.
The information parameters in each physical
component are divided into two parts: additional
geometric parameters and cost-item parameters.
Besides to the geometric data (such as length, width,
height, area, and volume) of a physical component,
additional geometric parameters are required to
conduct quantity takeoffs. For instance, the
information required to conduct the quantity takeoffs
for the steels of a wall include: the data of length and
height of the wall from the common geometric
parameters; and, the data of spacing of horizontal
bar, spacing of vertical bar, steel unit weight, and the
number of bar layer for this wall from the additional
geometric parameters.
To add the cost items associated with each
physical component, this study uploads the
contractual cost items to the Revit using the
"keynotes", "assembly codes", and "family type
catalogs" functions in Revit. This step sets a base to
enable each physical component to map the cost
items that specify the construction materials used in
erecting the component.
Step 2: Conducting Searching Algorithms to
Perform Quantity Takeoffs
in Autodesk QTO.
The model proposes to apply the search takeoff tool
in Autodesk QTO to create takeoff objects (that is,
cost items associated with each activity) and then
quantify the objects. To specify the takeoff objects
needs to set search criteria first. The proposed search
algorithm defines various search criteria (floor,
physical object, cost item, and area) with respect to
different types of scheduling activities (structure,
site work, and finishes activities).
For example, the structure activities are such as
setting steel of 1st floor columns/walls, setting steel
of 1st floor beams/slabs, setting form of 1st floor
columns/walls, setting forms of 1st floor
beams/slabs, etc. Thus, in the structure activities, the
search criteria are floor (1st, 2nd, 3rd, etc.), physical
object (column, wall, beam, and slab), and cost item
(involved construction materials).
Specifically, for instance, activity “setting steel
of 1st floor columns/walls” includes two physical
components: columns and walls. Each component is
associated with two cost items, namely, “steel,
SD420, labor and material included” and “steel,
SD420W, labor and material included”. The takeoffs
of steel in this activity are performed in four steps:
ICSOFT-EA2015-10thInternationalConferenceonSoftwareEngineeringandApplications
140
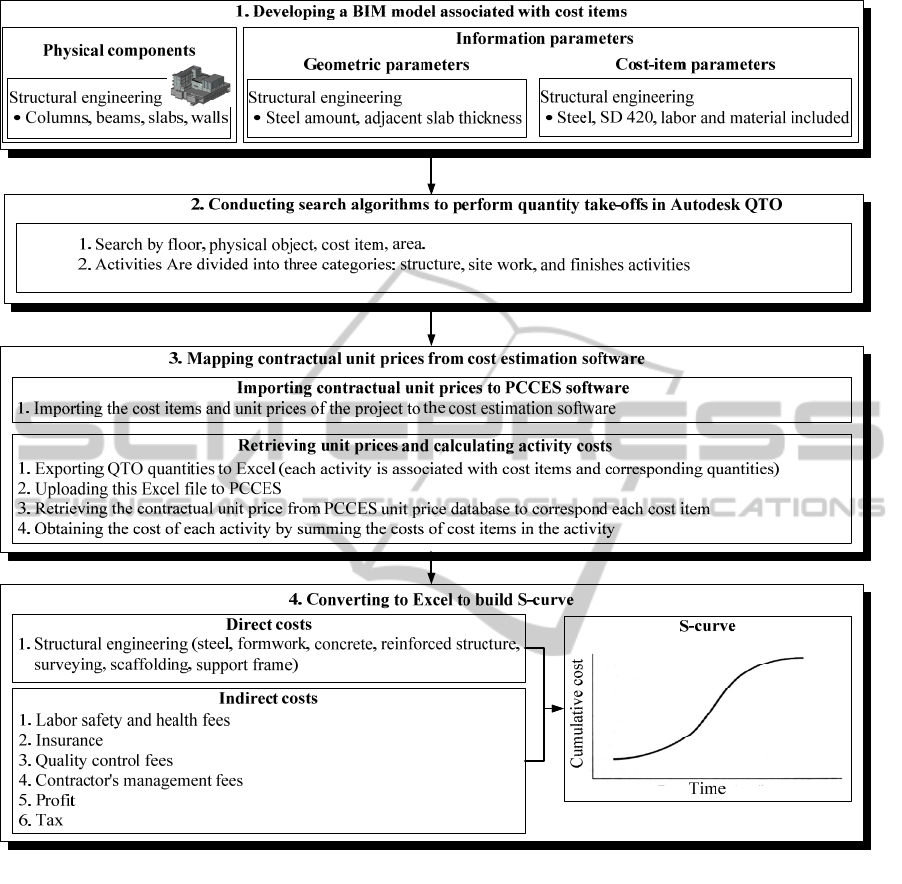
Figure 1: Proposed model.
• Step 2.1: In the search takeoff tool, use “1st
floor” (floor), “column” (physical component)
and “steel, SD420, labor and material included”
(cost item) as search criteria to retrieve all the
columns that use “steel, SD420, labor and
material included” and are located on the first
floor. The geometric parameters of columns are
used to quantity the column steel via takeoff
formulas.
• Step 2.2: Step 2.1 is repeated for the other cost
item (steel, SD420W, labor and material
included) of “column”.
• Step 2.3: Step 2.1 is repeated for "wall" and cost
item (steel, SD420, labor and material included).
• Step 2.4: the quantities of steel of “wall”, cost
item (Steel, SD420W, labor and material
included) are also obtain through the same
process.
Notably, several structure activities are
associated with the same cost items “steel, SD420,
labor and material included” and “steel, SD420W,
labor and material included”. Therefore, the example
here relates to a many-to-many relationship (i.e.,
many activities-to-two cost items).
Step 3: Mapping Contractual Unit Prices from
Cost Estimation Software.
After conducting step 2, the cost items associated
with quantity takeoffs in each activity are transferred
EstablishingConstructionSchedulingProgressCurvebasedonBuidlingInformationModelingQuantityTakeoffs
141
to a cost estimation software (called Public
Construction Cost Estimation System or PCCES)
that is widely used in Taiwan. Via PCCES, the
contractual unit price of each cost item is retrieved
automatically. As a result, the costs of the cost items
in each activity can be computed.
Step 4: Converting to Excel to Build a S-curve.
The costs of each activity calculated in PCCES are
exported to a MS Excel file. Next, in an activity, the
costs are uniformly allocated in the activity duration
to obtain the daily costs. Notably, the activity costs
are related to direct costs. Indirect costs of a project,
such as safety and health fees, and quality control
fees, are assumed to be uniformly spread out the
entire project duration. Finally, the daily costs of
various activities in each day can be obtained,
resulting into the establishment of a progress curve
(or S curve) of the project.
4 CASE STUDY
4.1 Project Description
The case study concerns a project that involves a
high-tech related building in northern Taiwan. This
building built with RC has three upper-structure
floors and two underground-structure floors. The
total building floor area is 14,966 m2, and the
construction budget is approximately US$7.4
million. And the project contractual duration is 598
days. This project has an intermediate schedule
associated with 93 activities, in which the numbers
of structure, site work, and finishes activities, are 59,
9, and 25, respectively.
4.2 Evaluations and Results
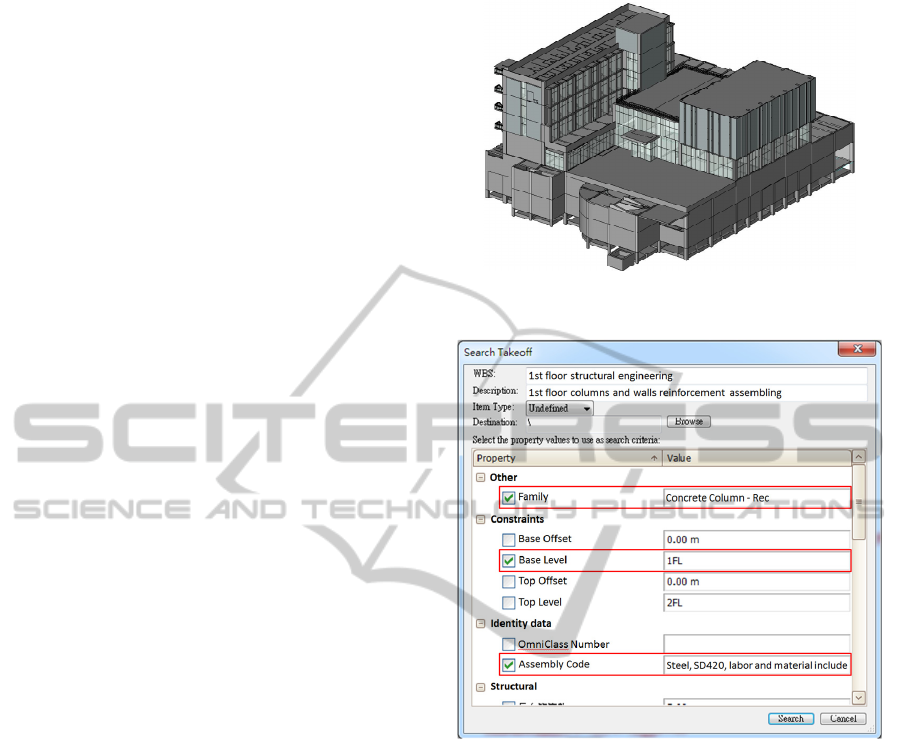
First, a 3D BIM-based model was built using
Autodesk Revit Architecture, as shown in Fig. 2.
This BIM model is composed of physical
components and information parameters (including
additional geometric parameters and cost-item
parameters). This BIM model is then transferred to
Autodesk QTO to conduct quantity takeoffs.
In performing step 2, Fig. 3 presents a snap shot
of applying the search takeoff tool to quantify the
cost item, “steel, SD420, labor and material
included" of activity “setting steel of 1st floor
columns/walls”.
After going through the modeling steps 1~4, Fig.
4 displays the established S curve in the project.
Figure 2: Autodesk Revit model of case project.
Figure 3: Searching criteria in QTO.
4.3 Discussions
During the course of this case study, lessons learned
are summarized as follows.
• In establishing an S curve, if the duration of an
activity is too short (for example, one or two
weeks; the case of a detailed schedule), then
numerous activities will be involved, increasing
the computation effort in QTO. If the duration is
too large (for example, two or three month; the
case of a milestone schedule), the QTO effort is
much less, but the accuracy of an S-curve
decreases. Hence, this study recommends to use
an intermediate schedule.
• The search algorithm can reduce errors in
mapping the activities and cost items. However,
the current algorithm is still performed manually.
• An S curve is often done after the project
contract has been awarded, in which the
•
ICSOFT-EA2015-10thInternationalConferenceonSoftwareEngineeringandApplications
142

0%
5%
10%
15%
20%
25%
30%
35%
40%
45%
50%
55%
60%
65%
70%
75%
80%
85%
90%
95%
100%
Project time
P
e
r
c
e
n
t
a
g
e
o
f
c
u
m
u
l
a
t
i
v
e
c
o
s
t
s
Figure 4: Established S curve of case project.
contractual quantities already exit. In a cost item,
if the overall quantity extracted by QTO differs
from the contractual quantity, one may need to
adjust the extracted quantity.
5 CONCLUSIONS
The relationships between scheduling activities and
cost items may be 1-to-1, many-to-1 or many-to-
many relations, which are very complicated to
specify the costs of each activity. This study
proposes a searching algorithm to conduct quantity
takeoffs in Revit QTO to facilitate calculate the
costs of each activity. To do so, the search algorithm
uses the "keynotes", "assembly codes", and "family
type catalogs" functions in Revit to connect the
activities and their corresponding cost items. Next,
the search algorithm defines different search steps
(using various searching criteria, such as "floor",
"physical object", "cost item", and "area") to identify
various cost items associated with different types of
activities (including structure, temporary, and
finishes activities). Then, the extracted quantities of
cost items associated with each activity is transferred
to a cost estimation software, which can provide the
unit prices of corresponding cost items for obtaining
the total cost of the activity. At last, integrating the
costs of activities and the schedule, a planned S
curve of a construction project can be established to
support schedule control.
A case study has shown the benefits of the
proposed search algorithm and model. Future
research directions are as follows. For instance,
some of the steps in conducting search algorithms
and modeling are not automated. Using API to
performing these steps automatically should improve
the user friendliness.
ACKNOWLEDGEMENTS
The authors would like to thank the Ministry of
Science and Technology in Taiwan (Contract No:
MOST 103-2622-E-009-022-CC3) for their financial
support. We also thank the Concord Tech Company
for their technical assistance regarding the use of
Autodesk software. We are also indebted to Ming-
Feng Yeh, Jang-Jeng Liu, Yuan-Yuan Cheng and
Ming-Tsung Lee for providing valuable information
and practical experience.
REFERENCES
Chen, J. T., 2011. Verification of Quantity Takeoff from
BIM Based Models of Reinforced Concrete Structure,
EstablishingConstructionSchedulingProgressCurvebasedonBuidlingInformationModelingQuantityTakeoffs
143

Master thesis, Chung Hua University, Department of
Civil Engineering.
Chai, C. Y., 2012. Application of Building Information
Modeling to Formwork Quantity Takeoff, Master
thesis, National Taiwan University, Department of
Civil Engineering.
Eastman, C., Teicholz, P., Sacks, R., Liston, K., 2011,
BIM Handbook, A Guide to Building Information
Modeling for Owners, Managers, Designers,
Engineers, and Contractors, Second Edition, John
Wiley and Sons, Inc., New Jersey.
Hendrickson, C., Au, T. 2003. Project Management for
Construction - Fundamental Concepts for Owners,
Engineers, Architects and Builders. <http://pmbook.ce.
cmu.edu> (Jun. 24, 2014).
Rundell, R., 2006, How BIM can support cost estimating,
1-2-3 Revit: BIM and Cost Estimating, Part 1, 2013
Longitude Media, LLC. <http://www.cadalyst.com/
cad/building-design/1-2-3-revit-bim-and-cost-
estimating-part-1-3350> (May. 13, 2014).
Shen, Z., Issa, R. R., 2010. Quantitative evaluation of the
BIM-assisted construction detailed cost estimates.
Information Technology in Construction, 15, 234-257.
Wijayakumar, M., Jayasena, H. S., 2013. Automation of
BIM quantity take-off to suit QS's requirements. In
Proceedings of the Second World Construction
Symposium 2013: Socio-Economic Sustainability in
Construction, June 14-15, Colombo, Sri Lanka.
ICSOFT-EA2015-10thInternationalConferenceonSoftwareEngineeringandApplications
144
