Optimizing Steel Melt Shop Operations using an Iterative
Hierarchical Decomposition based Discrete Event Simulation Model
Atanu Mukherjee and Arnab Adak
Dastur Business & Technology Consulting, A division of M. N. Dastur & Company (P) Ltd, Kolkata, India
Keywords: Steelmaking, Logistics, Bottleneck, Simulation, Modeling, Throughput, Utilization.
Abstract: Maximizing productivity in a steel melt shop requires appropriate equipment and facility design and the
synchronization of production across units like iron making, steel making, holding furnaces and casting of
the molten metal. This requires that blockages and bottlenecks in the production chain be identified and
overcome and the logistics in terms of equipment and facilities to move the materials appropriately
designed. Removal of blockages and bottlenecks requires a combination of process redesign and
investments in facilities and equipment in the production units supported by potential logistics redesign in
terms routing and scheduling of equipments like cranes, ladle cars hot metal ladles and steel ladles used in
the production shop . This approach addresses the system-wide bottleneck removal problem such that
congestions, interferences, delays, stoppages and idle times coupled with process and cycle time variations;
do not limit the end-to-end production. This paper presents how we improved the productivity in a melt-
shop by using an iterative hierarchical decomposition based modelling and simulation approach to help
identify the bottlenecks causing capacity loss, and experiment with options to redesign the system by
suggesting mechanisms for improvement and additional facilities and logistical resources. The
implementation of the system has resulted in a 28% increase in melt-shop throughput and increase and
significant increase in profitability by decreasing hot metal diversions to alternative casting facilities.
1 INTRODUCTION
Steel is produced from iron and ferrous ores and
scrap through two major processes – Iron-making
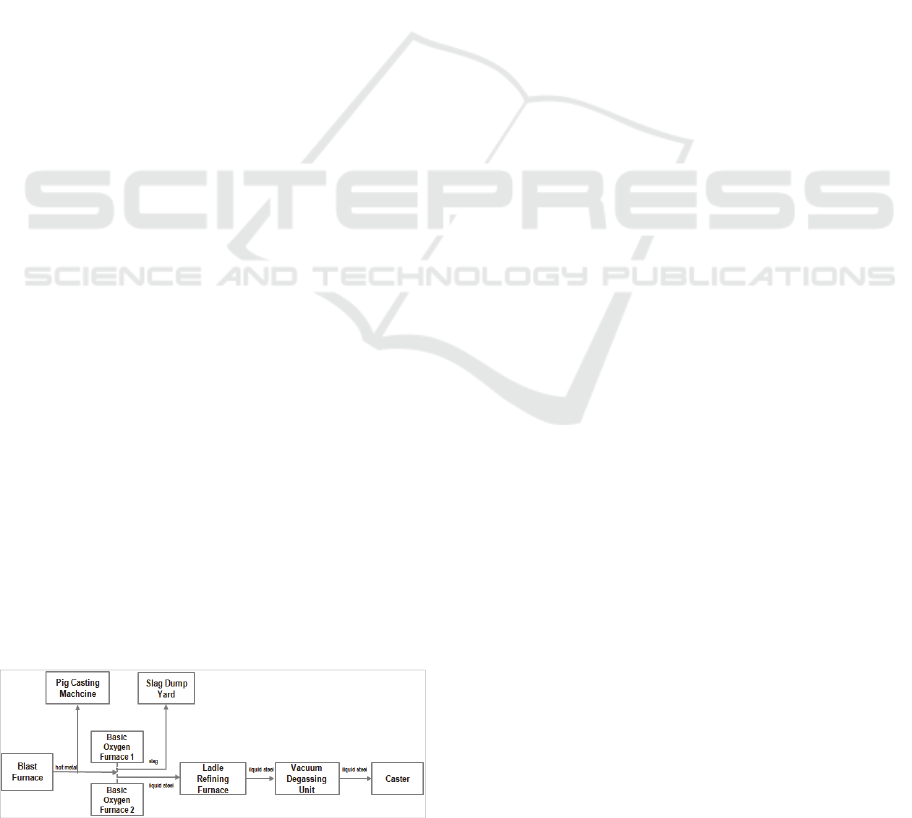
and Steelmaking. Figure 1 shows the overview of
the process of producing steel in an integrated steel
plant.
Figure 1: The steel production process overview.
The first phase in steel production is iron-making
where oxygen and impurities are removed from iron
ore using other raw materials through a process in a
counter-current heat exchanger known as the blast
furnace. A Blast Furnace (BF) produces molten
iron/pig iron, termed as Hot-metal. In an iron-
making unit of a steel plant, the hot-metal from the
blast furnace is tapped in the cast house either in
open top ladles or in torpedo ladles. These ladles are
then moved to the Steel-making unit, also called
Steel Melting Shop (SMS) by locomotives to be fed
to the Basic Oxygen Furnace (BOF). The BOF
converts liquid iron from BF and scrap steel into
liquid steel which is then refined in ladles and finally
cast at the casters. In case the BOF is not ready to
accept hot metal due to production bottlenecks or
capacity mismatches it is sent to Pig Casting
Machine (PCM) to be cast into saleable iron ingots.
The goal of a steel plant is to synchronize
operations across the iron and steel making units
such that throughput is maximized. This translates
into specific unit optimization goals along with
synchronization and coordination requirements cross
the units. From a unit optimization perspective, it is
essential that the BOF does not have any wait time
other than the preparation time. This means that the
optimal number of ladles, the optimal number of
cranes and the optimal movement algorithm of
cranes needs to be determined such that the hot
111
Mukherjee A. and Adak A..
Optimizing Steel Melt Shop Operations using an Iterative Hierarchical Decomposition based Discrete Event Simulation Model.
DOI: 10.5220/0005524101110117
In Proceedings of the 5th International Conference on Simulation and Modeling Methodologies, Technologies and Applications (SIMULTECH-2015),
pages 111-117
ISBN: 978-989-758-120-5
Copyright
c
2015 SCITEPRESS (Science and Technology Publications, Lda.)

metal feed to the BOF is synchronous and without
wait. Also, timely arrival of hot metal from the iron-
making-unit needs to be ensured.
In the steel-melting-shop unit, the liquid steel
from the BOF is taken to the Caster where the liquid
steel is molded via secondary refining units
comprising of Ladle Refining Furnace (LRF) and/or
Vacuum Degassing (VD) units. The BOF should be
synchronized with the Casters such that the heat
sequences for different grades are maintained while
maximizing the utilization of the equipment to
ensure the highest throughput from hot-metal
charging to casting. It is always preferred to have
uninterrupted sequence during continuous casting to
achieve higher production and yield.
Our study was based on an integrated steel plant
having two BOFs, with one working and one
standby mode, one LRF, one Vacuum Degassing
unit and one three-strand Caster (operated with two
strands). The existing operations needed to be
studied and analyzed in detail and additional
facilities/ improvements in the system needed to be
proposed to utilize the Caster, LRF and BOF fully
and thereby increasing the overall throughput of the
system. It was also needed to suggest the number of
hot metal ladles and steel ladles in active circulation
required for the suggested production.
2 THE PROCESS AND
OPERATIONS
Hot metal in the Blast Furnace (BF) is cast as per BF
cast schedule into open top ladles placed in transfer
cars on railway tracks. The ladle transfer car is
carried to SMS or PIG Casting Machine (PCM) by
captive locomotive depending on the readiness of
the converter to accept the hot metal.
At SMS the full ladle is picked up from the
transfer car by an overhead crane and carried to the
sampling point. In case an empty ladle is ready for
return to BF, the full ladle is picked and kept on the
pit, the empty ladle placed on the transfer car and
then the full ladle is picked up again by the overhead
crane. Once the sampling is complete, the ladle is
carried to the BOF. In the mean time scrap is
charged to the BOF by scrap charging crane. On
completion, the hot metal is charged to the BOF and
blowing starts. Near the end of the blowing cycle,
temperature is measured and samples are taken for
analysis. After pouring of the hot metal to the BOF,
the ladle is carried to the pit by overhead crane for
sending back to the BF.
Steel ladle on steel transfer car gets under the
BOF vessel and steel is tapped into the ladle through
the tap hole. Once tapping is complete, slag pot car
gets under the BOF vessel and slag is poured into
the slag pot through the BOF vessel mouth.
After processing of 8 heats in the BOF,
maintenance operations, also known as dozing and
mouth jam cleaning are carried out. After 15 heats of
BOF operation the maintenance operation of tap
hole changing is performed. And after 75 heats,
other maintenance works on the vessel are carried
out. The numbers are varied depending on the status
and completion of the casting sequence.
After tapping of steel into the steel ladle, it is
transported to the ladle refining aisle by the ladle
transfer car, picked up by overhead crane and placed
on the LRF transfer car. The purging lines are fixed
and the transfer car goes into the LRF. The steel is
further refined in the LRF by adding alloying
materials to give it special properties as required.
Once the LRF processing is complete, the ladle
transfer car brings out the ladle and the purging lines
are removed. The ladle is also moved to the VD unit
by overhead crane, and further treatment done.
The ladle is transported to the caster turret from
the LRF or VD by overhead cranes. The ladle sits in
a rotating turret at the casting machine. One ladle is
in the 'on-cast' position (feeding the casting
machine) while the other is made ready in the 'off-
cast' position, and is switched to the casting position
when the previous ladle is empty. Once casting of
one ladle is over, and the turret rotates, the empty
ladle is transported from the turret to the slag
dumping area and slag is dumped. After slag
dumping, the ladles are sent to the ladle preparation
area and placed back on the transfer car for the next
tapping from the BOF.
3 OVERALL THROUGHPUT
IMPROVEMENT
The process of steelmaking and casting, from BOF
to Caster, may be categorized into three distinct
stages, viz. primary steelmaking, secondary
steelmaking and casting. Primary steelmaking is
concerned with the production of liquid steel, which
is subsequently refined in terms of both its
composition and its cleanliness through a host of
secondary steelmaking processes. Molten steel with
desired composition, cleanliness and temperature is
finally transformed into solid products through
continuous casting. Figure 2 shows the categories of
the steelmaking process.
SIMULTECH2015-5thInternationalConferenceonSimulationandModelingMethodologies,Technologiesand
Applications
112

Figure 2: The steelmaking process categories.
The overall throughput of the steel making process
depends on the functioning of each of these units at
efficiency levels which maximizes the total output.
The functioning of these units at their required
efficiency levels which maximizes output, depends
on:
Design or rated capacity of the unit
Operating efficiency
Overall shop logistics
The units can be operated at their design or rated
capacity by improving operating efficiency of unit or
shop logistics. Related work in the area of logistics
optimization (McGinty et al., 2008) and hidden
capacity discovery (Mukherjee et al., 2012) has been
carried out to address specific improvement goals
around this area. Our approach is an integrated
holistic approach to plant operations improvement
through simulation so as to include unit operations,
logistics, cycle times and their interactions.
4 APPROACH OF ITERATIVE
AND HIERARCHICAL
DECOMPOSITION
A large number of problems in production
operations can be initially analyzed using simple
relationships that do not require assumptions about
the distribution of service times and inter-arrival
times in a queuing network. Several such
relationships, called operational laws (Buzen, 1976)
(Jenning and Buzen, 1978) are useful in looking at
the starting point for the analysis. For example, the
melt-shop operations is a form of the queuing
network where the job flow balance is maintained
and obeys the forced flow law. Each unit operation
(BOF, LRF, Casting etc.) in such a system has a
service time and the unit utilizations are proportional
to their service times. The unit with the highest total
service time has the highest utilization and is called
the bottleneck unit. This unit is the key limiting
factor in achieving higher throughput to start with.
Identification of the bottleneck unit was the first step
in operations performance improvement of the
system. Using baseline simulation we can estimate
the highest service demand in the operation chain.
So the approach was to see the opportunity for cycle
time /service time reduction and hence capacity
improvement in the BOF, Caster, LRF or VD.
Once we could reduce the cycle time to the
minimum level possible at the bottleneck unit, we
again simulated the model and stack-ranked the
service times in the production chain and looked at
how the bottlenecks shift across the production
units. Frequently, the bottlenecks shift in the
production chain during iterations of improvement.
If there is an opportunity for improvement in the
other unit cycle times/service times as the
bottlenecks shift we continue iterating till there is no
further opportunities for practical cycle time
improvement across the production chain.
Once we exhausted the opportunities for cycle
time improvement we argued that given the
difference in variability in the service times in each
of the units and their distributions, there might be
further scope for improvement. This led us to
observe the behavior of capacity utilizations across
the downstream units which could potentially create
a bottleneck so as to give us further insights. We
hypothesized that if indeed the capacity utilizations
of some of the units changed and tended to move in
a way which would affect the performance of that
unit, there could be opportunity for further
improvement in system performance by adding
capacity. Addition of that unit capacity needs to be
guided by the economics and the cost benefit of such
an option. Typically as a thumb rule, buffering units
like the holding furnace (LRF) are good candidates
for capacity addition to improve performance. We
would similarly iterate and exhaust all capacity
addition options till there are no further
opportunities for overall improvement in the system.
This progressive hierarchical decomposition of
the chain and iterating based on the two heuristics
drives the simulation towards an optimal solution.
We think that this method can be applied to large
scale manufacturing scenarios with many units and
can be a useful method for analyzing and potentially
optimizing large scale systems through simulation.
5 BASELINE SIMULATION
MODELING AND ANALYSIS
A baseline simulation model was built using the
Promodel software to simulate the operations of
SMS with the existing service times of the units. The
service time for each unit operation (also referred as
cycle time) included processing time, downtimes
due to maintenance, preparation times and transfer
BOF LRF + VD Caster
P
rimary steelmaking Secondary steelmaking Casting
OptimizingSteelMeltShopOperationsusinganIterativeHierarchicalDecompositionbasedDiscreteEventSimulation
Model
113
times. Logistics movements including rail
movement of the transfer cars and the crane
movements was modeled in the software using its
feature of network path and entity driven simulation.
The approach followed in the model building
was LEAP (Locations, Entities, Arrival, and
Processing). The first task in building the model was
to identify the locations which included source
locations, destination locations and intermediate
locations where the entities will arrive at and exit
from during the movement in the system. It was also
necessary to identify the entities which will originate
at the BF and BOF and exit from Caster; and the
entities like hot metal ladles and steel ladles which
will keep on moving in the system to facilitate
movement of other entities. Also, resources like
transfer cars, cranes, locomotives were created
which will move the entities from one location to the
other. Once the entities were identified and created,
the arrival of the entities had to be modeled as per
the arrival schedule. That included hot metal at BF;
Scrap at scrap yard for charging to BOF; and Steel
and Slag at the BOF for tapping. The next task was
to create the appropriate network path for transfer
car movements and crane movements. The final step
was to create the processing logics for the entities at
a particular location and thereafter creating the
routing logics for moving to the next location using
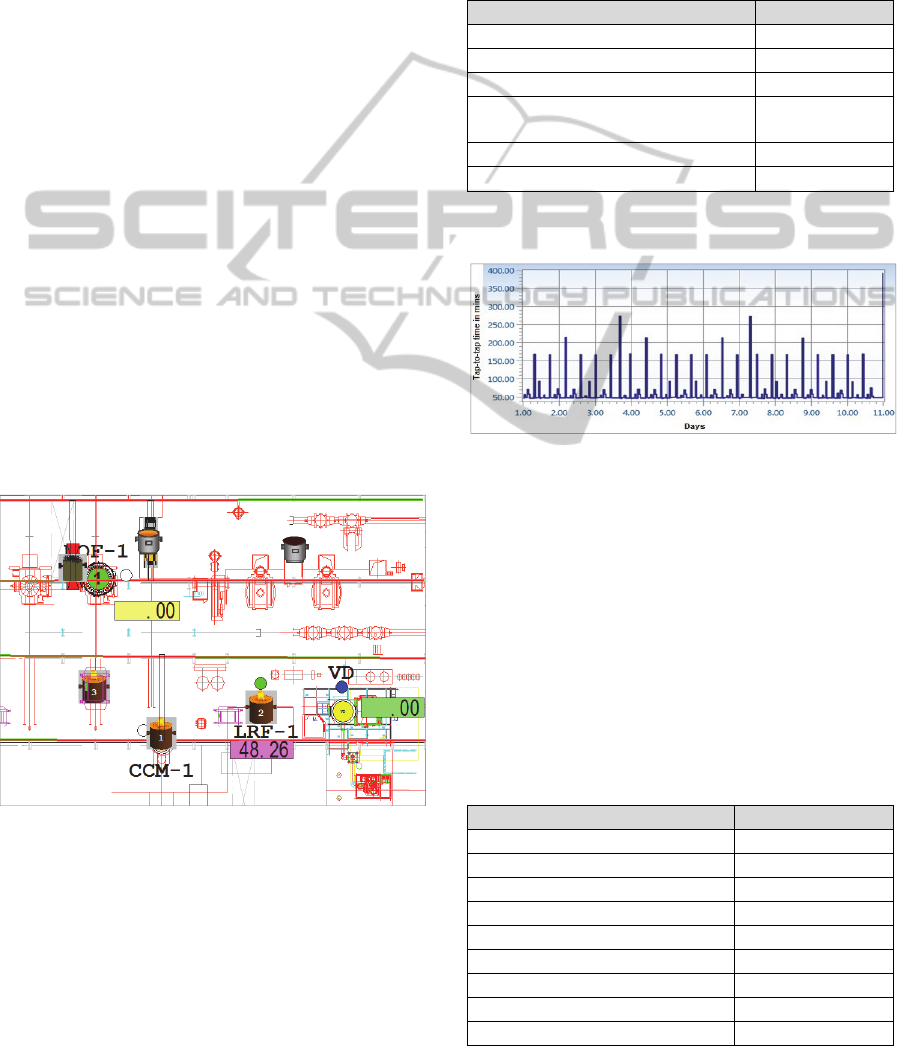
the required resources. Figure 3 shows a screenshot
of the simulation model.
Figure 3: The model screenshot.
To model the behaviour of various operation
parameters, one year operation data was collected
for the BOF, LRF, VD and Caster and were fitted
into various distributions and best fit distribution
was selected with the help of goodness of fit tests.
The model was run with the existing operation
parameters taking into consideration the stochastic
behaviour of the parameters involved in various
processes like blowing time at the BOF, tapping
time, LRF process time, VD treatment time, crane
availability etc. The transient response of the model
stabilized after 30 days of simulation time. The
results yielded are as shown in the Table 1.
Table 1: Results of simulation runs for 10 days with
existing parameters after attaining stabilization.
Results
Total heats 217
Average BOF tap-to-tap time 65 mins
LRF utilization 79.83 %
Caster utilization (using 2
strands)
52.60 %
VD utilization 47.60 %
Caster heat sequence Maintained
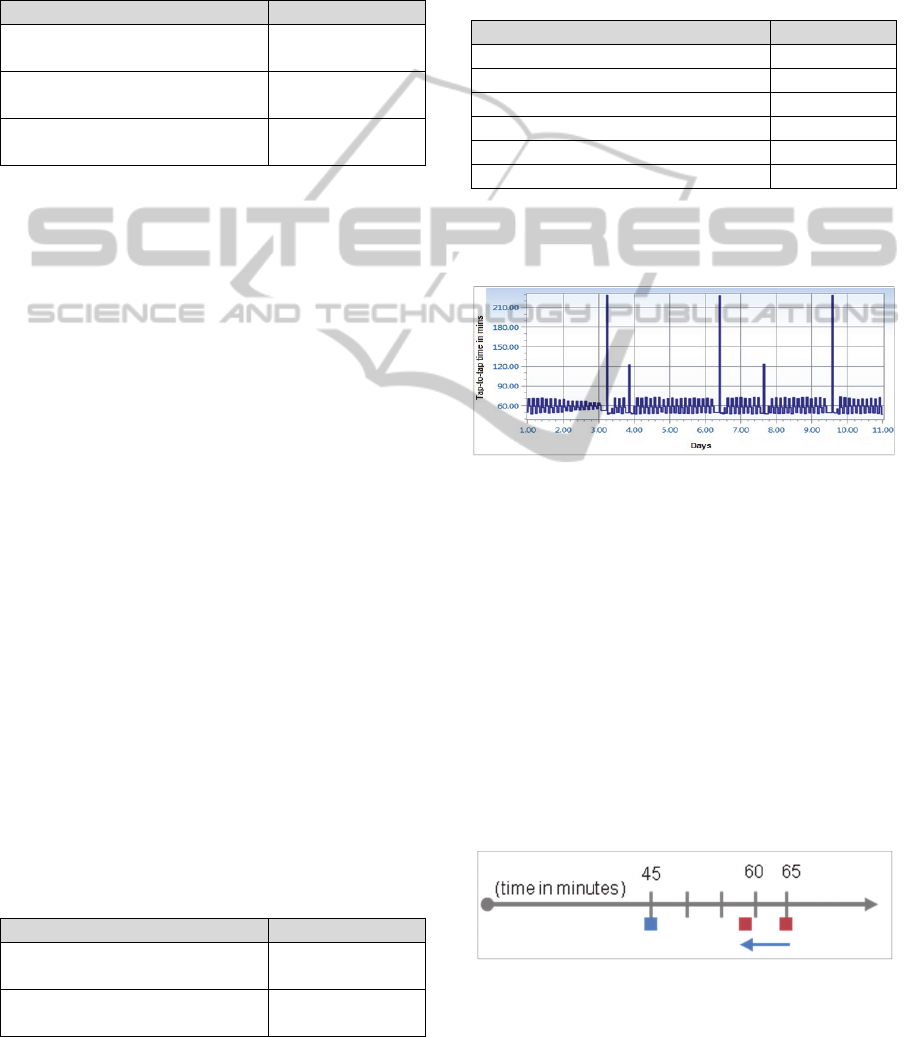
Also the behavior of the BOF tap-to-tap time turned
out to be as shown in Figure 4.
Figure 4: BOF tap-to-tap time with the existing
maintenance downtimes.
6 THE BOF PROCESSING AND
UTILIZATION ANALYSIS
The BOF converter unit being the generation point
in the steelmaking process, it was envisaged that
improving the cycle time by reducing downtimes at
the BOF will increase its throughput and hence the
overall throughput. Table 2 shows the various basic
activities involved in the BOF operations.
Table 2: Basic time components in BOF process.
Activities Time in minutes
Scrap charging 1 to 2
Hot metal pouring 4
Blowing 16 to 18
Deslagging 2 to 3
Temperature & Analysis 5
Tapping 4 to 6
Slagging off 2
Slag coating 5
Total 45 (max)
SIMULTECH2015-5thInternationalConferenceonSimulationandModelingMethodologies,Technologiesand
Applications
114
In addition to the above, currently there also
exists recurring events of dozing, mouth jam
cleaning, tap hole changing and other maintenance
operations as shown in Table 3 which contributes to
the BOF tap-to-tap time thereby reducing the BOF
throughput.
Table 3: Current BOF maintenance downtimes.
Event Time in minutes
Mouth jam cleaning and
dozing after every 8 heats
90
Tap hole changing after 15
heats
45
Other maintenance after 75
heats
180
With these BOF processing times the overall
steelmaking process behavior needed to be studied
and analyzed. Simulation has been used for studying
and analyzing systems operations previously and the
methodology applied has been ‘highly efficient’
when applied in complex logistic systems.
Considering the complexity of operations, criticality
of sequencing activities and the interdependencies of
the logistics parameters, it was decided to develop a
discrete event simulation model of the system and
evaluate the improvement options.
7 IMPROVEMENT STRATEGY
AT THE BOF
The baseline simulation results showed that the
number of heats from the BOF is constrained by the
higher tap-to-tap time caused by recurring
maintenance delays. It was evident that if these
delays can be reduced, the number of heats from the
BOF can be increased. Based on the technology
available it was envisaged that these delays could be
reduced using tap hole sleeves in the BOF vessel
which will allow a minimum corrosion and erosion
during the operation of the BOF and improving
operating efficiency. With the above measures the
maintenance downtimes was envisaged to be
brought down as shown in Table 4.
Table 4: Proposed BOF maintenance downtimes.
Event Time in minutes
Mouth jam cleaning and
dozing after every 15 heats
90
Tap hole cleaning and other
maintenance after 75 heats
180
However the envisaged maintenance downtimes
would affect the entire sequencing of activities from
the BOF to the Caster and needed to be evaluated
and validated using the model built. The model was
run again with the changed maintenance delays and
results were obtained as shown in Table 5.
Table 5: Results of simulation runs of 10 days with
proposed parameters after attaining stabilization.
Results
Total heats 237
Average tap-to-tap time 59 mins
LRF utilization 92.27 %
Caster utilization (using 2 strands) 60.29 %
VD utilization 54.88 %
Caster heat sequence Maintained
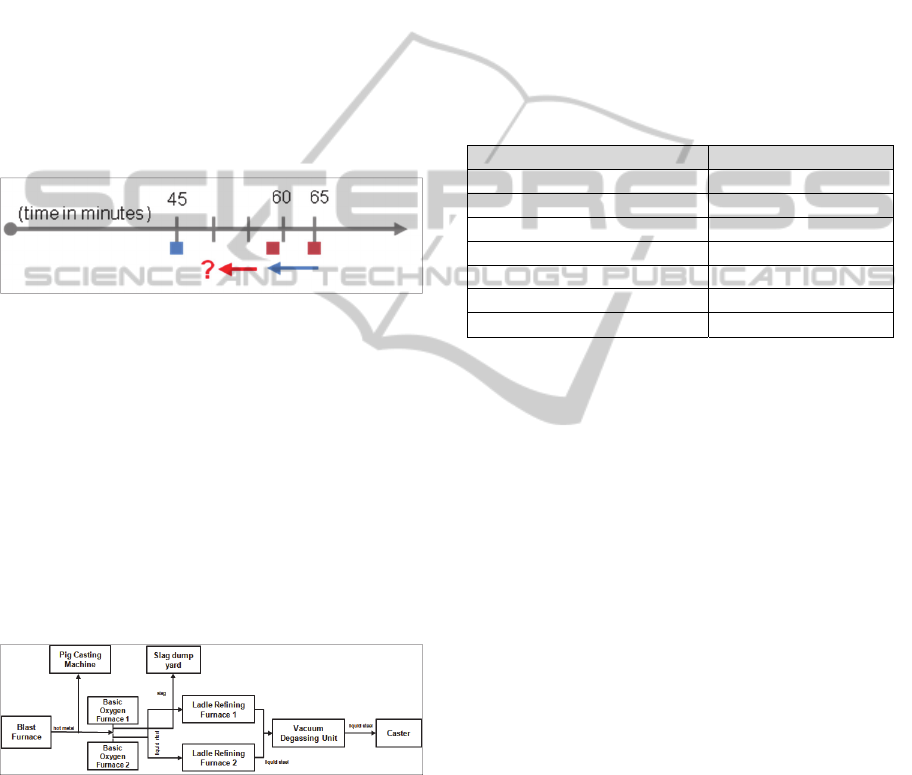
The behavior of the BOF tap-to-tap time with
proposed maintenance operations was found to be as
shown in Figure 5.
Figure 5: Tap-to-tap time with proposed operations.
It is clear that with the frequency of downtimes
reduced in the proposed mode of operation, the
surges in the tap-to-tap time are lesser resulting in a
lower average tap-to-tap time and hence higher
number of heats would be possible from the BOF.
According to the results, the average BOF tap-to-tap
time could be reduced from 65 mins to 59 mins as
shown in Figure 6, considering the reduced
downtimes at the BOF and the constraints in the
upstream and downstream facilities, with 45 mins of
minimum tap-to-tap time required in the BOF,
thereby increasing the overall throughput of the
system. Individually, the BOF had the potential to
reduce its tap-to-tap time further.
Figure 6: Reduced BOF tap-to-tap time.
However the additional component in the tap-to-tap
time over and above the basic BOF processing time
OptimizingSteelMeltShopOperationsusinganIterativeHierarchicalDecompositionbasedDiscreteEventSimulation
Model
115
is not only due to BOF maintenance downtimes, but
also is probably due to contributions from
downstream blockages like the LRF. The utilization
of the LRF being on the higher side points to a
probable blockage in the LRF (as per the result). So
if the downstream blockages can be removed it was
envisaged that the average BOF tap-to-tap time can
be further reduced to increase the throughput while
maintaining the synchronization between the BOF
and the caster.
Our next goal was to find out as to how much of
further reduction in tap-to-tap time is possible by
removing the downstream bottlenecks. So the next
step was to find a strategy to remove the
downstream blockage through additional buffering
thereby reducing the converter tap-to-tap time and
improving the overall throughput.
Figure 7: Further reducing the BOF tap-to-tap time.
It was further reasoned, that with higher LRF
utilization it would not be feasible to accommodate
more heats from the BOF and transport to the caster
at a higher rate. Hence the bottleneck was in all
likelihood the existing capacity of the LRF. It was
suggested that an additional LRF could be a
probable solution to make use of the additional BOF
capacity as well as the additional caster capacity
with three strands in operation. The modified
operations of the iron making and steel making unit
of the plant can be outlined by the schematic as
shown in Figure 8:
Figure 8: The steelmaking process with additional LRF.
8 SIMULATING WITH
ADDITIONAL LRF CAPACITY
Engineering of the additional LRF led to modified
layout with provision of transfer cars and crane
accessibility to the additional LRF. The sequencing
of heats with the additional LRF and operations
using three strands of the caster needed to be
validated to ensure proper synchronization of the
BOF with the Caster such that the heat sequences for
different grades are maintained while maximizing
the utilization of the Casters. It was also required to
find the maximum possible heats keeping in mind
when a heat sequence has started in a Caster, it
should complete the cast sequence without
interruption due to the unavailability of heat.
The model was run with the additional LRF and
appropriate sequencing of heats at the LRFs. The
results found were as shown in Table 6.
Table 6: Results of simulation run with additional LRF for
10 days after attaining stabilization.
Proposed Operation
Total heats 278
Average tap-to-tap time 51 mins
LRF-1 utilization 45.86 %
LRF-2 utilization 45.78 %
Caster utilization 71.60 %
VD utilization 64.63 %
Caster heat sequence Maintained
The simulation results showed that with additional
LRF and the envisaged BOF maintenance
downtimes, the average BOF tap-to-tap time could
be brought down to 51 minutes and the caster could
be operated with three strands; as a result the
number of heats will increase substantially. The
simulation results also suggested that there needs to
be 4 hot metal ladles in active circulation and 4 steel
ladles in active circulation to support the logistics
and achieve the desired production.
9 COST BENEFIT ANALYSIS
A cost-benefit analysis was performed to analyze the
return on investment. Improving the overall
throughput increased the production of saleable steel
in terms of billets which otherwise was being
diverted to the pig casting machine for casting iron
ingots. The price of billets is generally higher than
price of iron ingots on a per ton basis. The marginal
cost of producing steel through caster or the pig
casting machine is minimal and is assumed to be
zero. The marginal cost of processing of steel in the
LRF was non-trivial. Additional operational costs
for BOF tap-hole sleeves were also non-trivial. It
was assumed that all the billets or pig cast ingots
that were produced were sold in the market at
SIMULTECH2015-5thInternationalConferenceonSimulationandModelingMethodologies,Technologiesand
Applications
116
average market prices. Investments in additional
buffer and processing capacity were in the form of a
35 ton LRF.
Table 7 shows the CAPEX, OPEX, revenue and
payback period based on the proposed modifications
in terms of capacity expansion and operating
practices.
Table 7: Cost benefit analysis.
Unit Costs & Operational Parameters
Tap hole sleeves 200 mm, 10
sleeve pack
$3000
Sleeve change interval 75 heats
Electrode consumption in
LRF
12 gm/KWH
Electricity consumption in
LRF
0.5 KwH/Degree
Celcius/ton
Average heating in LRF 5 Degree Celcius
Cost of Electricity 10 C/ KWH
Investments
1X35 Ton LRF 8 MM$
Product Price
Average Billet Price $480 /ton
Average Pig Iron Price $ 400/ton
Marginal Revenue R 5.3 MM$/year
Marginal Cost C (Sleeve
Cost + Electrode
Consumption + Power
Consumption)
~$400,000
Additional profit , P 4.9 MM$
Payback Period for
Investment
1 Year and 7
Months
10 CONCLUSIONS
The paper presents an approach for increasing the
overall throughput of a steel melt shop in an
integrated steel plant constrained by unit operations’
service times and capacity of facilities with the help
of simulation. Global optimization of the
steelmaking process has many interdependent
variables which are also probabilistic in nature
making the analysis intractable through traditional
analytical methods. Discrete event simulation with a
hierarchical iterative approach allowed us to
progressively analyze and re-design cycle time,
logistics and capacity improvement across the
operating units in the steel melt shop for better
throughput. The result showed that only reducing
downtimes at the BOF was not effective in
increasing the shop production and an additional
LRF was also necessary to obtain the benefits. The
recommendations resulted in effective utilization of
all the units so that the overall throughput was
maximized. Based on our recommendations the
number of heats processed increased from an
average of 21 per day to an average of 27 per day
resulting in an increase of 28%. The increased
overall steel production and reduced converter wait
times decreased the diversion of hot metal to the pig
casting machine improving the profitability of the
melt shop. The proposed system design and
recommendations is currently being implemented.
REFERENCES
McGinty, J. T., Young, J. D., Greene, C. E, Kendrick,
V.C., 2008. Use of Dynamic Computer Simulation for
Optimal Melt shop Logistics. In Iron & Steel
Technology.
Mukherjee, A., Adak, A., Raj, P., Kirtania, S., 2012.
Enhancing a System’s Performance by Utilizing its
Hidden Capacity using Discrete Event Simulation: A
Case Study of a Steel Melt Shop. In International
Simulation Conference of India. IIT Bombay, India.
Buzen, J. P., 1976. Fundamental operational laws of
computer system performance. In Acta Informatica.
Jenning, P., Buzen, J., 1978. The Operational Analysis of
Queuing Network Models. In Journal of ACM
Computing Surveys.
Harrell, C., Ghosh, B. K., Bowden, R. O., 2012.
Simulation Using Promodel, McGraw-Hill. USA, 3
rd
edition.
OptimizingSteelMeltShopOperationsusinganIterativeHierarchicalDecompositionbasedDiscreteEventSimulation
Model
117
