
Evaluation Metrics for VM Allocation Mechanisms in
Desktop Clouds
Abdulelah Alwabel, Robert Walters and Gary Wills
School of Electronics and Computer Science, University of Southampton, Southampton, U.K.
Keywords: Cloud Computing, Desktop Clouds, Evaluation Metrics, Node Failures, Throughput, Availability, Power
Consumption, DesktopCloudSim.
Abstract: Desktop Cloud computing is the idea of benefiting from computing resources around us to build a Cloud
system in order to have better usage of these resources instead of them being idle. However, such resources
are prone to failure at any given time without prior knowledge. Such failure events have a can negative
impact on the outcome of a Desktop Cloud system. This paper proposes metrics that can evaluate the
behaviour of Virtual Machine (VM) allocation mechanisms in the presence of node failures. The metrics are
throughput, power consumption and availability. Three VM allocation mechanisms (Greedy, FCFS and
RoundRobin mechanisms) are evaluated using the given metrics.
1 INTRODUCTION
Desktop Cloud computing is the idea of
benefiting from computing resources around us to
build a Cloud system in order to have better usage of
these resources instead of them being idle (Alwabel
et al., 2014a). Desktop Cloud computing is an
alternative to the traditional way of providing Cloud
services. Traditionally, Cloud service providers,
such as Amazon, dedicate a massive number of
computer nodes that are located in one or more data
centres to provide services over the Internet (Buyya
et al., 2009). The idea of Desktop Cloud is
stimulated by the success of Desktop Grid to offer
Grid services using resources contributed by people
over the Internet (Anderson et al., 2002).
There are several research issues in Desktop
Clouds that need further attention from researchers.
Research issues are security and privacy; resource
management; and node failures (Alwabel et al.,
2014a). Node failure rates in Desktop Cloud are
reported to be quite high and can affect the
performance of Desktop Clouds (Alwabel et al.,
2014b). It is proposed that a Virtual Machine (VM)
allocation mechanism can play an important role in
order to reduce the negative effect of node failures
(Alwabel et al., 2015a). This paper proposes metrics
that can be used to evaluate the behaviour of a VM
allocation mechanism. Section 2 of this paper gives
an overview of Desktop Cloud. Next section
proposes and discusses the evaluation metrics. The
third section presents our findings of employing the
metrics to evaluate several VM allocation
mechanisms from the literature. A conclusion and
future is presented in the last section.
2 DESKTOP CLOUD
COMPUTING
Desktop Cloud computing is a new type of Cloud
built using resources that would otherwise remain
idle and unused (Alwabel et al., 2014a). For
example, most PCs in universities remain idle and
unused after 5 pm. The idea of Desktop Cloud is
motivated by the success of Desktop Grids (Kondo
et al., 2004). The concept of Desktop Grid is to
exploit normal computing resources such as PCs and
laptops to process and execute Grid tasks. Several
Desktop Grid projects have proven success in
achieving this goal such as SETI@home (Anderson
et al., 2002).Desktop Cloud merges two ideas:
Desktop Grids and Cloud computing. Note
that“Desktop” term is derived from Desktop Grids
because both of Desktop Clouds and Desktop Grids
are mainly based on desktop PCs and laptops.
whilethe term “Cloud” comes from Cloud since
Desktop Cloud provides services based on the Cloud
63
Alwabel A., Walters R. and Wills G..
Evaluation Metrics for VM Allocation Mechanisms in Desktop Clouds.
DOI: 10.5220/0005525400630068
In Proceedings of the 2nd International Workshop on Emerging Software as a Service and Analytics (ESaaSA-2015), pages 63-68
ISBN: 978-989-758-110-6
Copyright
c
2015 SCITEPRESS (Science and Technology Publications, Lda.)

business model. Several synonyms are used which
mean Desktop Cloud, such as Ad-hoc Cloud,
Volunteer Clouds and Non-Dedicated Clouds. The
literature shows that very little work has been
carriedout in this research area.
“Ad-hoc Cloud”(Kirby et al., 2010) is the idea of
employing distributed resources within an
organisation to form a Cloud. “Nebula” Chandra and
Weissman, 2009; Weissman et al., 2011) is a
research project that aims to use distributed
resources with an aimof creating a volunteer Cloud
which offers services free of charge.
“Cloud@home”(Cunsolo and Distefano, 2010;
Cunsolo et al., 2009) is a project implementing the
“@home” philosophy in Cloud computing. The goal
of Cloud@home is to establish a new model of
Cloud computing built on resources that are donated
by individual users over the Internet. Further to that,
CERN has recently announced an initiative to bring
their Desktop Grid project, which is called
LHC@home, into the Cloud (Harutyunyan et al.,
2012). It is suggested that non-dedicated resources
can be used by Cloud providers when their local
infrastructure cannot meet demands ofCloud
consumers at peak times (Andrzejak et al., 2010).
Desktop Clouds can be formed into private
Clouds or public Clouds. The first scenario to build
a private Desktop Cloud can be considered as
follows:supposea university wishes to benefit from
its computing resources to form a Cloud. The
resources can be of any type ranging from PCs to
servers etc, each computing resource is called a
Cloud node when it joins the Cloud. Researchers and
staff within the universitycan benefit from this
Desktop Cloud by submitting their requests to
acquire Cloud services. Requests are processed in
the virtualisation layer on top of Cloud physical
nodes. Another scenario that can be considered is a
public Desktop Cloud that allows people to
contribute their own computing resources to be used
by Cloud clients (Cunsolo et al., 2009).The people
are invited to contribute their machines when these
resources become idle in order to form a Desktop
Cloud. People can be motivated to participate by
telling them that such projects can serve science and
research communities. Another incentive might be
being permitted to use the Desktop Cloud resources
when they want them.
One of the main issues in Desktop Clouds is the
high rate of node failures during run time (Alwabel
et al., 2014b). In Desktop Cloud computing, node
failure events can include any event that causes the
node to leave the Cloud for any reason. Next section
proposes several metrics that can be used to evaluate
the outcome of a VM allocation mechanism in the
presence of node failures.
3 EVALUATION METRICS
The efficiency of Cloud computing is defined by a
set of evaluation metrics. Employing efficient
metrics for Cloud computing is vital in order to
optimise the Clouds. It has been shown that there is
no systematicanalysis for evaluation metrics for
Cloud Computing (Li et al., 2012).The diversity of
architectures of Cloud providers requires evaluation
metrics to be platform independent(Goiri et al.,
2012). However, the literature shows there are
several studies assessing the service provided by the
Cloud from the prospective of customers. Most of
the literature (such as (Lenk et al., 2011),
(Stantchev, 2009) and (Villegas et al., 2012))
focuses on the cost-performance of services in order
to adopt a better decision-making policy that can
help customers to choose a service provider
according to their requirements. For example, some
customers can tolerate some performance
degradation in exchange for low cost of service.
A Virtual Machine (VM) allocation mechanism
can play an important part in the outcome of a Cloud
system. In this work, we considered three metrics
that can be used to evaluate a VM allocation
mechanism implemented in a Desktop Cloud. VM
allocation mechanism is the process of allocating a
VM to a Physical Machine (PM) (Alwabel et al.,
2014b). The metrics are throughput, power
consumption and availability. They are discussed
further in the following subsections.
3.1 Throughput
Throughput is an important metric to measure the
outcome of a Cloud system in the presence of node
failures. Throughput metriccalculates the number of
successfully completed tasks st that are submitted by
clients out of the total number of submitted tasks tt
(Garg et al., 2013). Throughput is calculated as
follows:
100∗
∑
Most papers in the literature focus on the
performance notion which includes attributes such
as response time and average turnover time such as
(Van et al., 2010) and (Stantchev, 2009). This is
because researchers assume that Cloud nodes are
very reliable (Buyya et al., 2010). However, we
ESaaSA2015-WorkshoponEmergingSoftwareasaServiceandAnalytics
64
consider throughput because it is known that node
failures in Desktop Clouds are norms rather than
exceptions (Abdulelah Alwabel et al., 2014b).
3.2 Power Consumption
Power consumption metric considers the amount of
energy pwr that is consumed by each node in the
infrastructure layer of a Cloud system. It is measured
by Kilo Watt hour (kWh). The metric of power
consumption is given as follows:
Beloglazov et al., (2012) set power consumption as
one of the metrics to measure the outcome of their
energy-aware resource allocation algorithm for
Cloud computing. Energy efficiency can be defined
as the number of instructions in billions executed per
Watt hour (Bash et al., 2011). The Standard and
Performance Evaluation Corporation (SPEC)
community released SPECpower metric to measure
power consumption (Lange, 2009). SPECpower is a
Java application that generates a set of transactions
completed per second. SPECpower calculates
energy consumed by total number of operations in
Watt-hours. Energy consumption is considered a
metric for evaluating the proposed model in Desktop
Clouds.
3.3 Availability
Availability means how much computing power is
available to accommodate new VM requests. The
failure of nodes can affect the availability of
Desktop Clouds. A question in this context is
whether the employed VM allocation mechanism
can help in improving node availability. Let avl
denote the availability of a Cloud node while the
total computing power of all Cloud nodes is
denotedtot.cp. The availability is given as follows:
∑
.
4 EXPERIMENT
The experiment is conducted to evaluate three VM
mechanisms which are First Come First
Serve(FCFS) (Schwiegelshohn and Yahyapour,
1998), Greedy (Cunha et al., 2001) and RoundRobin
(Rasmussen and Trick, 2008).These mechanisms are
evaluated using the metrics proposed in the previous
section.
4.1 Experiment Design
A Desktop Cloud was simulated using
DesktopCloudSim (Alwabel et al., 2015b)
simulation extension to CloudSim (Calheiros et al.,
2011). CloudSim is a widely used simulation tool to
simulate the behaviour of a Cloud System.
DesktopCloudSim enables researchers to simulate
failure events happening within the infrastructure
level of a Cloud (i.e., enabling Cloud nodes to fail
during run time). In order to simulate a Desktop
Cloud, data of a Desktop Grid system retrieved from
Failure Trace Archive was used to simulate both the
infrastructure of a Desktop Cloud since both
Desktop Cloud and Desktop Grid use infrastructure
similar to each other (Alwabel et al., 2015a).
Secondly, the archive provides name of the machine
that fails along with the time of failure. Another
input to the simulation tool is the workload
containing tasks submitted to be executed. The
workload is collected from PlanetLab archive
(Peterson et al., 2006).
The Experiment assumes that 700 instances of
VMs are requested to run for 24 hours. The types of
VM instances are: micro, small, medium and large.
The VM instances are similar to VM types that are
offered by Amazon EC2. The type of each given
VM instance is randomly selected. The number of
VM instances and types remain the same for all run
experiment sets. Each VM instance processes a
bunch of tasks fromthe given workload.
It is assumed in the experiment that if a node
fails then all VMs on this node will be lost.
Destroying a VM instance causes all running tasks
on the VM to be destroyed which consequently
affectsthe throughput (i.e., these tasks are considered
failed tasks). The destroyed VM will berestarted on
another PM and begin to receive new tasks. Any
failed node which recovers may rejoin the Cloud.
The experiment is run 180 times, each time is a run
for one day in the simulation. 180 days represents
six-month period.The experiment was simulated and
run on a Mac i27 (CPU = 2.7 GHz Intel Core i5, 8
GB MHz DDR3) with operating system OS X
10.9.4. The results were processed and analysed
using IBM SPSS Statistics v21 software.
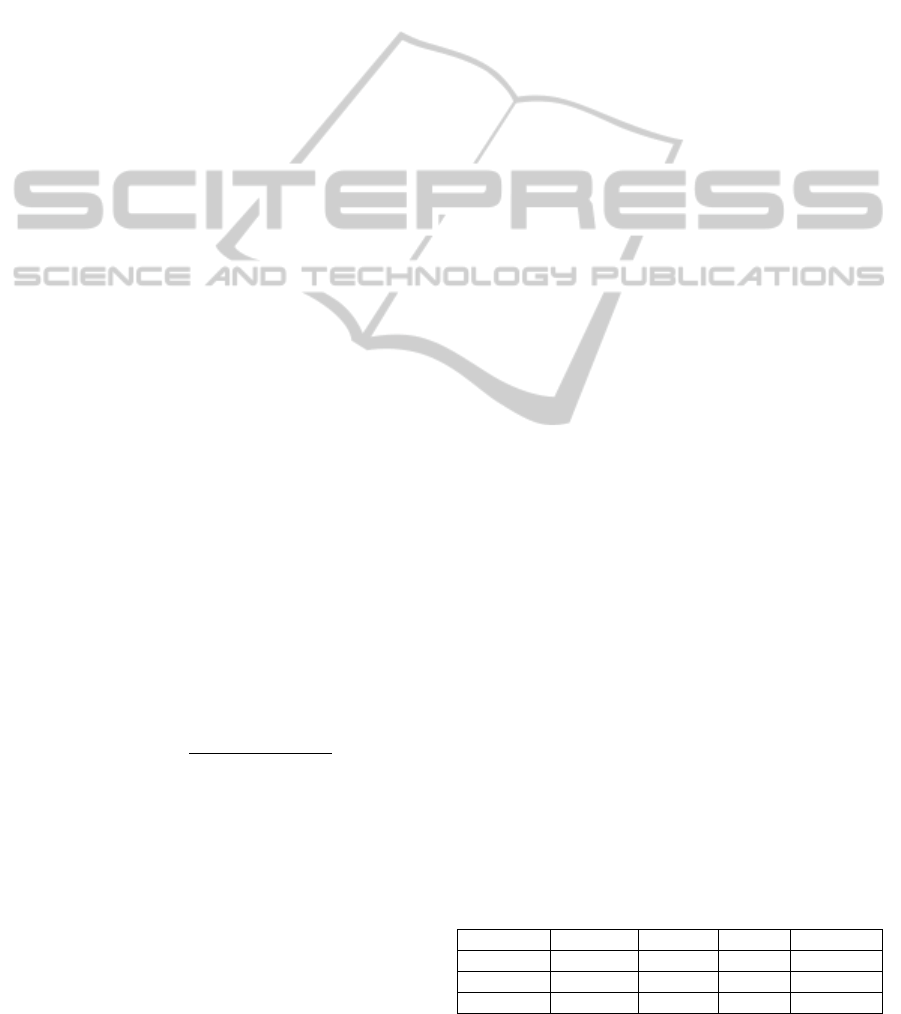
Table 1: Throughput Metric.
Mechanism Mean (%) Median (%) Variance Standard Dev.
FCFS 79.21 78.77 37.03 6.09
Greedy 88.61 89.48 16.85 4.1
RoundRobin 85.47 85.29 15.13 3.89
EvaluationMetricsforVMAllocationMechanismsinDesktopClouds
65
4.2 Results and Discussion
Table 1 shows a summary of results obtained when
measuring the throughput metric for each VM
allocation mechanism in the experiment.
Kolmogorov-Smirnov (K-S) test (Field, 2009) of
normality shows that the normality assumption was
not satisfied because the FCFS and Greedy
mechanisms are significantly non-normal, .05.
Therefore, the non-parametric test Friedman’s
ANOVA (Field, 2009) was used to test which
mechanism can yield better throughput. Friedman’s
ANOVA test confirms that throughput varies
significantly from mechanism to another,
2
397.14, .001. Mean, median, variance and
standard deviations are report in Table 1.
Three Wilcoxon pairwise comparison tests
(Field, 2009) were used to find out which
mechanism gave the highest throughput. Note that
three tests are required to compare threepairs of
mechanisms which are FCFS vs. Greedy, FCFS vs.
RoundRobin and Greedy vs. RoundRobin
mechanisms. The level of significance was set to
0.017 using Bonferroni correction (Field, 2009)
method because there were three post-hoc tests
required (.05/3 ≈ .017). The tests show that there is a
statistically significant difference between each
mechanism with its counterparts. Therefore, we can
conclude that Greedy mechanism produces highest
throughput since it has the median with highest
value (median = 89.48%).
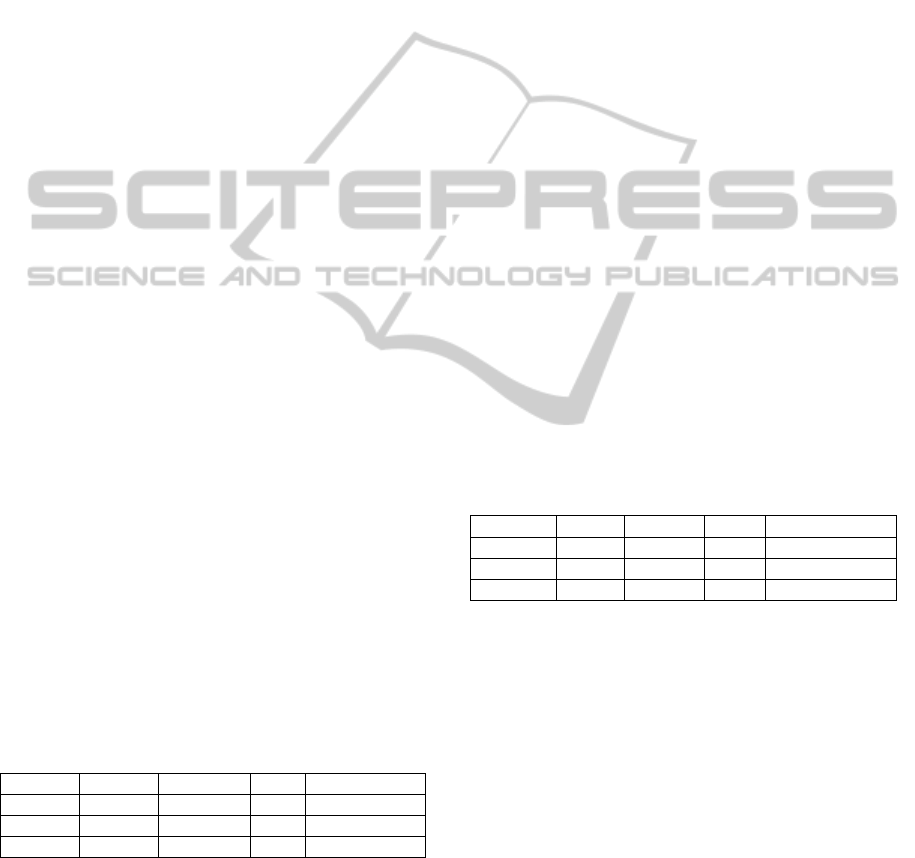
Table 2 reports the mean, median, variance,
standard deviation when power consumption was
measured in the experiment. Friedman’s ANOVA
test was applied to the power consumption results to
show if that there a significant difference between
the mechanisms,
2
540,
.001.Friedman’s ANOVA test was selected because
the power consumption results are not all distributed
normally since the critical value (p-value) <0.5 for
FCFS and Greedy mechanisms results.
Table 2: Power Consumption Metric.
Mechanism Mean (kWh) Median (kWh) Variance Standard Deviation
FCFS 533 538 867 29.45
Greedy 638 641 738 27.16
RoundRobin 1884 1883 22237 149
Three Wilcoxon tests were conducted to identify
which mechanism consumes the least power. The
tests showed that there is a statistically significant
difference between each pair of mechanisms.
Therefore, the FCFS mechanism consumes
significantly less power among the testes for
mechanism because the median of power
consumption of the FCFS is 538 kWh.
Table 3 shows a summary of descriptive results
obtained when measuring the availability metric for
each VM allocation. Since the results are not
normally distributed, Friedman’s ANOVA test was
used to test which mechanism can yield better
availability. Friedman’s ANOVA test confirms that
availability varies significantly from mechanism to
another,
2
510.78, 0.001. Mean,
median, variance and standard deviations are
reported in Table 3.
Three Wilcoxon pairwise comparison tests were
used to find out which mechanism produced best
availability. The tests show that there is a significant
difference between each pair of VM mechanisms.
Greedy mechanism outperformed other mechanisms
in terms of availability by looking at the median
(86.23%).
The results show that the throughput, power
consumption and resource availability can be
affected by node failures and thus, yield different
outcomes according to the implemented mechanism.
According to this experiment, Greedy mechanism
yields the best throughput and availability while the
FCFS mechanism consumesleast power. A note
worth mentioning from our experiment is that at
least10% of submitted tasks failed because of node
failures. Therefore, there is actual need to implement
a fault-tolerant mechanism for Desktop Cloud.
Table 3: Availability Metric.
Mechanism Mean (%) Median (%) Variance Standard Deviation
FCFS 85.03 84.59 4.21 2.05
Greedy 86.22 86.23 3.09 1.76
RoundRobin 81.98 81.91 2.44 1.6
5 CONCLUSIONS AND FUTURE
WORK
Desktop Cloud computing is a new type of Cloud
computingwhich aims to employ computing
resources to build a Cloud system. The resources
that are employed in Desktop Clouds are normal
computing resources such PCs and laptops. These
resources would remain idle and unused if they are
not used within a Desktop Cloud system.The model
of Desktop Cloud is to move Desktop Grid systems
towards Cloud computing era. This paper presented
throughput, power consumption and availability as
metrics that can be used to evaluate VM allocation
mechanisms.
ESaaSA2015-WorkshoponEmergingSoftwareasaServiceandAnalytics
66

The FCFS, Greedy and RoundRobin VM
allocation mechanisms were evaluated using the
proposed metrics. The experiment was conducted
using DesktopCloudSim simulation tool which
enables researchers to simulate Desktop Cloud
systems. Our findings showed that Greedy
mechanism can give better in terms of throughput
and availability while the FCFS mechanism can
consume the least power among other mechanisms.
Our findings showed that the failure of tasks can
reach up to 10% of all submitted tasks as a result of
node failures. Therefore, our future work is to
develop a new fault-tolerant VM mechanism for a
Desktop Cloud system. In addition to that,
researchers should pay attention to power consumed
by Cloud nodes in order to reduce it. The reduction
of power consumption can result in reducing the
running costs of Desktop Clouds.
REFERENCES
Alwabel, A., Walters, R., Wills, G.B., 2014a. A view at
desktop clouds. In: ESaaSA 2014.
Alwabel, A., Walters, R., Wills, G.B., 2014b. Evaluation
of Node Failures in Cloud Computing Using Empirical
Data. Open J. Cloud Comput. 1, 15 – 24.
Alwabel, A., Walters, R., Wills, G.B., 2015a. A Resource
Allocation Model for Desktop Clouds. In: Delivery
and Adoption of Cloud Computing Services in
Contemporary Organizations.
Alwabel, A., Walters, R., Wills, G.B., 2015b.
DesktopCloudSim : Simulation of Node Failures in
The Cloud. In: The Sixth International Conference on
Cloud Computing, GRIDs, and Virtualization CLOUD
COMPUTING 2015. iaria, Nice.
Anderson, D., Cobb, J., Korpela, E., Werthimer, D.,
Anderson, P., Lebofsky, M., 2002. SETI@home An
Experiment in Public-Resource Computing. Commun.
45.
Andrzejak, A., Kondo, D., Anderson, D.P., 2010.
Exploiting non-dedicated resources for cloud
computing. 2010 IEEE Netw. Oper. Manag. Symp. -
NOMS 2010 341–348.
Bash, C., Cader, T., Chen, Y., Gmach, D., Kaufman, R.,
Milojicic, D., Shah, A., Sharma, P., 2011. Cloud
Sustainability Dashboard, Dynamically Assessing
Sustainability of Data Centers and Clouds. In:
Proceedings of the Fifth Open Cirrus Summit.
Moscow.
Beloglazov, A., Abawajy, J., Buyya, R., 2012. Energy-
aware resource allocation heuristics for efficient
management of data centers for Cloud computing.
Futur. Gener. Comput. Syst. 28, 755–768.
Buyya, R., Broberg, J., Goscinski, A., 2010. Cloud
Computing Principles and Paradigms. John Wiley &
Sons.
Buyya, R., Yeo, C.S., Venugopal, S., Broberg, J., Brandic,
I., 2009. Cloud computing and emerging IT platforms:
Vision, hype, and reality for delivering computing as
the 5th utility. Futur. Gener. Comput. Syst. 25, 599–
616.
Calheiros, R., Ranjan, R., Beloglazov, A., De Rose,
C´.A.F., Buyya, R., 2011. CloudSim: a toolkit for
modeling and simulation of cloud computing
environments and evaluation of resource provisioning
algorithms. Softw. Pract. … 23–50.
Chandra, A., Weissman, J., 2009. Nebulas: Using
distributed voluntary resources to build clouds. In:
Proceedings of the 2009 Conference on Hot Topics in
Cloud Computing. USENIX Association, pp. 2–2.
Cunha, J., Kacsuk, P., Winter, S., 2001. Parallel Program
Development for Cluster Computing: Methodology,
Tools and Integrated Environments. Nova Biomedical.
Cunsolo, V., Distefano, S., 2010. From volunteer to cloud
computing: cloud@ home. Conf. Comput. Front. 103–
104.
Cunsolo, V., Distefano, S., Puliafito, A., Scarp, M., 2009.
Cloud@ home: Bridging the gap between volunteer
and cloud computing. ICIC’09 Proc. 5th Int. Conf.
Emerg. Intell. Comput. Technol. Appl. 2009.
Cunsolo, V.D., Distefano, S., Puliafito, A., Scarpa, M.,
2009. Volunteer computing and desktop cloud: The
cloud@ home paradigm. In: Network Computing and
Applications, 2009. NCA 2009. Eighth IEEE
International Symposium on. IEEE, pp. 134–139.
Field, A., 2009. Discovering statistics using SPSS, Third.
ed. SAGE Publications Ltd.
Garg, S.K., Versteeg, S., Buyya, R., 2013. A framework
for ranking of cloud computing services. Futur. Gener.
Comput. Syst. 29, 1012–1023.
Goiri, Í., Julià, F., Fitó, J.O., Macías, M., Guitart, J., 2012.
Supporting CPU-based guarantees in cloud SLAs via
resource-level QoS metrics. Futur. Gener. Comput.
Syst. 28, 1295–1302.
Harutyunyan, A., Blomer, J., Buncic, P., Charalampidis,
I., Grey, F., Karneyeu, A., Larsen, D., Lombraña
González, D., Lisec, J., Segal, B., Skands, P., 2012.
CernVM Co-Pilot: an Extensible Framework for
Building Scalable Computing Infrastructures on the
Cloud. J. Phys. Conf. Ser. 396, 032054.
Kirby, G., Dearle, A., Macdonald, A., Fernandes, A.,
2010. An Approach to Ad hoc Cloud Computing.
Arxiv Prepr. arXiv1002.4738.
Kondo, D., Taufer, M., Brooks, C., 2004. Characterizing
and evaluating desktop grids: An empirical study. Int.
Parallel Distrib. Process. Symp. 2004 00.
Lange, K., 2009. Identifying shades of green: The
SPECpower benchmarks. Computer (Long. Beach.
Calif). 95–97.
Lenk, A., Menzel, M., Lipsky, J., Tai, S., Offermann, P.,
2011. What Are You Paying For? Performance
Benchmarking for Infrastructure-as-a-Service
Offerings. 2011 IEEE 4th Int. Conf. Cloud Comput.
484–491.
Li, Z., O’Brien, L., Zhang, H., Cai, R., 2012. On a
Catalogue of Metrics for Evaluating Commercial
EvaluationMetricsforVMAllocationMechanismsinDesktopClouds
67

Cloud Services. … Int. Conf. 164–173.
Peterson, L., Muir, S., Roscoe, T., Klingaman, A., 2006.
PlanetLab Architecture : An Overview.
Rasmussen, R., Trick, M., 2008. Round robin scheduling–
a survey. Eur. J. Oper. Res. 617–636.
Schwiegelshohn, U., Yahyapour, R., 1998. Analysis of
first-come-first-serve parallel job scheduling. Proc.
ninth Annu. ACM … 629–638.
Stantchev, V., 2009. Performance Evaluation of Cloud
Computing Offerings. 2009 Third Int. Conf. Adv. Eng.
Comput. Appl. Sci. 187–192.
Van, H.N., Tran, F.D., Menaud, J.-M., 2010. Performance
and Power Management for Cloud Infrastructures. In:
2010 IEEE 3rd International Conference on Cloud
Computing. Ieee, pp. 329–336.
Villegas, D., Antoniou, A., Sadjadi, S.M., Iosup, A., 2012.
An Analysis of Provisioning and Allocation Policies
for Infrastructure-as-a-Service Clouds. 2012 12th
IEEE/ACM Int. Symp. Clust. Cloud Grid Comput.
(ccgrid 2012) 2, 612–619.
Weissman, J.B., Sundarrajan, P., Gupta, A., Ryden, M.,
Nair, R., Chandra, A., 2011. Early experience with the
distributed nebula cloud. In: Proceedings of the Fourth
International Workshop on Data-Intensive Distributed
Computing. ACM, pp. 17–26.
ESaaSA2015-WorkshoponEmergingSoftwareasaServiceandAnalytics
68
