
Beat Discovery from Dimensionality Reduced Perspective Streams of
Electrocardiogram Signal Data
Avi Bleiweiss
Platform Engineering Group, Intel Corporation, Santa Clara, U.S.A.
Keywords:
Electrocardiogram, Cardiac Arrhythmia, Spectral Decomposition, Dimensionality Reduction, Clustering.
Abstract:
Spectral characteristics of ECG traces have identified a stochastic component in the inter-beat interval for
triggering a new cardiac cycle. Yet the stream consistently shows impressive reproducibility of the inherent
core waveform. Respectively, the presence of close to deterministic structures firmly contends for representing
a single cycle ECG wave by a state vector in a low dimensional embedding space. Rather than performing
arrhythmia clustering directly on the high dimensional state space, our work first reduces the dimensionality of
the extracted raw features. Analysis of heartbeat irregularities becomes then more tractable computationally,
and thus claims more relevance to run on emerging wearable and IoT devices that are severely resource and
power constraint. In contrast to prior work that searches for a two dimensional embedding space, we project
feature vectors onto a three dimensional coordinate frame. This merits an essential depth perception facet to
a specialist that qualifies cluster memberships, and furthermore, by removing stream noise, we managed to
retain a high percentile level of source energy. We performed extensive analysis and classification experiments
on a large arrhythmia dataset, and report robust results to support the intuition of expert neutral similarity.
1 INTRODUCTION
Electrocardiogram (ECG) is a simple and effective
tool to assess the electrical and muscular functions
of the heart. The shape of the ECG signal (Gold-
berger and Goldberger, 1977) is commonly consid-
ered a faithful representation of cardiac physiology to
assist in diagnosing conditions for the heart to beat in
irregular or abnormal rhythm, known as Arrhythmia.
The interpretation of ECG tracing requires however
a considerable amount of cardiology training. One
of the major challenges in automating the analysis of
cardiac arrhythmias is the lack of coherency in the
captured time series of the heartbeat. Poor repeata-
bility of the recorded ECG signal in a succession of
tests administered on the same patient, and variabil-
ity of patient-to-patient morphologies that lend to ex-
tensive waveform shape dissimilarities, make it all
but difficult for a clustering algorithm (Kaufman and
Rousseeuw, 1990) to group complexes consistently,
and hence less likely to agree with the more manual
process of clinical diagnosis.
In recent years, wearable and Internet-of-Things
(IoT) technology for remotely monitoring continuous
ECG signals has emerged (Baig et al., 2013). These
devices use a non-invasive surface recording that em-
ploys from three to twelve electrodes, each connected
to a different part of the body. Electrodes measure
voltage or current change induced by the heart beat
over time and conceptually describe heart activity in
separable time series streams. Streams represent a
high dimensional state space for extracting raw car-
diac features, and often follow arrhythmia clustering
directly. However, operating on the large state space
is compute intensive and conceived practically infea-
sible to execute on wearable devices that are highly
restricted in compute capacity and power envelope.
A number of attempts have been made to analyze
cardiac time series in the context of deterministic dy-
namical systems. Kantz and Schreiber (Kantz and
Schreiber, 1998) argued that heart dynamics contain a
stochastic component in the inter-beat time intervals
(RR-interval) (Goldberger and Goldberger, 1977). On
the other hand, they showed that the single cycle ECG
wave, a PQRST complex (Figure 1), resembles regu-
lar structures and can be equally represented by state
vectors in a low dimensional embedding space. In-
spired by this observation, our work first removes
noise from the ECG signal by projecting the origi-
nal, high dimensional state space onto a lower, three
dimensional feature volume, while preserving stream
energy to a high percentile. Compared to prior work
39
Bleiweiss A..
Beat Discovery from Dimensionality Reduced Perspective Streams of Electrocardiogram Signal Data.
DOI: 10.5220/0005530500390048
In Proceedings of the 12th International Conference on Signal Processing and Multimedia Applications (SIGMAP-2015), pages 39-48
ISBN: 978-989-758-118-2
Copyright
c
2015 SCITEPRESS (Science and Technology Publications, Lda.)

(Li et al., 2012) that resorts to a two dimensional in-
trinsic space, our 3D projection facilitates a precur-
sory human inspection of arrhythmia formations by
means of a vital depth perception. Furthermore, clus-
tering and classification conducted on a dimensional-
ity reduced training set is considerably more compu-
tational efficient to better suit portable ECG devices.
As evident from a multitude of research studies
that exploit supervised machine learning techniques,
an attempt to coerce a cluster to a unique, cardiolo-
gist assessed arrhythmia label prove unsuccessful and
exhibits under par classification rates (Wenyu et al.,
2003). Rather, unsupervised learning from presumed
unlabeled heartbeat features and clustering a diverse
set of ECG morphologies by endorsing neutral simi-
larity in feature space, is better positioned to discover
patient groups that span a membership fusion of sev-
eral arrhythmia types. In our work, we investigate
a discovery (Rajaraman and Ullman, 2011) method
that extracts a statistical relation model of arrhythmia
bound cases from a large ECG data set, provided by
the UCI Machine Learning Repository (UCI, 1987)
and constructed of recordings taken from hundreds of
patients. The method incorporates both information
retrieval (Manning et al., 2008) and unsupervised ma-
chine learning (Duda et al., 2001) algorithms. Infor-
mation retrieval (IR) is rapidly becoming the domi-
nant form of data source access, and our work closely
leverages IR practices and follows efficient similar-
ity calculations directly from the well known Vec-
tor Space Model (Salton et al., 1975). Furthermore,
we are interested in objectively uncovering the under-
lying cluster nature of abnormal, cardiac rhythm in-
stances presented in the dataset, without resorting to
any prior knowledge of a cardiologist review.
The main contribution of our work is a novel, sta-
tistically driven system that combines IR and unsu-
pervised learning techniques to discover instinctive
cluster patterns from presumed unsolicited, ECG sig-
nal data. We employ Singular Value Decomposition
(SVD) (Cormen et al., 1990) for dimensionality re-
duction of cardiac streams that is equivalent to spec-
tral decomposition of a matrix, known for finding
independent linear correlations of feature vectors to
yield the best low rank approximation. For arrhyth-
mia clustering, we use the efficient Clustering Using
REpresentatives (CURE) (Guha et al., 1998) method,
a hierarchical algorithm that identifies groups of non-
spherical shapes and wide variations in size, from
perceived inseparable samples. More importantly,
CURE is robust to outliers that are prevalent in as-
sembling ECG traces. Owing to a compact cluster
representation of a small set of well scattered points,
CURE scales to large datasets and the search for clus-
ter similarities is considerably more effective com-
pared to either the centroid or all-points based ag-
glomerative methods. The remainder of this paper is
organized as follows. We overview the basics of ECG
recording and annotations, and highlight the motiva-
tion behind selecting orthogonal features from ECG
streams, in section 2. Section 3 briefs on the the-
ory of SVD that leads to our compact, 3D embedding
space, whereas in section 4 we review algorithm de-
tails of the CURE technique. Following in section 5,
we present our evaluation methodology of arrhythmia
cluster analysis and classification, and report quanti-
tative results of our experiments. We conclude with a
discussion and future prospect remarks, in section 6.
Figure 1: An end-to-end single cycle of normal ECG char-
acteristics, depicting both waves and intervals.
2 ECG STREAMS
An Electrocardiogram (ECG) provides graphical sur-
face recording of electrical cardiac events. Well estab-
lished electrode configuration tends to result in a spe-
cific tracing pattern, and changes in the ECG signal
provides the clinician indispensable data about car-
diac physiology. The tracing recorded from the elec-
trical activity of the heart forms a series of prominent
waves and complexes that are alphabetically labeled
as P, Q, R, S, and T . Each deflection occurs in regular
intervals for a healthy heart, and represents depolar-
ization or repolarization of myocardial tissue. Fig-
ure 1 shows an end-to-end single cycle of a normal
ECG signal and identifies conventional notations for
waves and basic intervals. A standard 12-lead ECG
is performed on a patient by attaching to his or her
skin a set of electrodes. The leads are grouped into
three frontal plane, bipolar limb leads: I, II, III; three
augmented voltage leads: aV R, aVL, aV F; and six
transversal plane, chest or precordial leads: V 1 −V 6
(Table 1). In essence, the 12-lead test supplies spatial
information of electrical events in orthogonal direc-
SIGMAP2015-InternationalConferenceonSignalProcessingandMultimediaApplications
40

tions, hence each separable recorded stream provides
a different view of heart activity, from a unique an-
gle across the body. The interpretation of the 12-lead
ECG is multi-faceted and is based on examining rate,
rhythm, the QRS axis, and the various intervals.
Table 1: A 12-lead ECG and their corresponding axes.
Group Lead Orientation
Bipolar Limb I lateral
II inferior
III inferior
Unipolar Limb aVR none
aVL lateral
aVF inferior
Unipolar Chest V 1 −V3 septal or anterior
V 4 −V6 anterior or lateral
The dataset we use is multivariate and coalesces
ECG signal features of different categories (Guvenir
et al., 1997), each described as a vector, possibly com-
bining real, integer, and boolean element types. A pa-
tient class leads off with attributes composed of age,
sex, height and weight. As eleven global recording
parameters are next and include the heart rate, mea-
sured in beats-per-minute, and a selection of average
duration figures in milliseconds of the QRS complex,
PR and QT intervals, and P and T waves. Along with
frontal plane orientations calculated in angles for each
of QRS, P, T , QRST , and J axes. To describe the dy-
namics of the multi-faceted signal shape, a pair of 12-
view stream sets follows, one set designated for each
the period and the amplitude cardiac feature groups.
Twelve properties form a period view that comprise
average width in milliseconds of each of the Q, R, S,
R
0
, and S
0
waves, with R
0
and S
0
signify a small peak
right after the R and S waves, respectively. Succeeded
by the number of intrinsic deflections and a collection
of six flags to indicate the presence or absence of any
of a ragged or a biphasic deflection to each of the P,
R, and T waves. Analogously, the per-view ampli-
tude class is made up of ten uniform real attributes.
Eight are peak measurements of each of the P, Q, R,
S, R
0
, S
0
, and T waves, together with the J depression
point, all obtained in increments of 0.1 millivolt steps.
In addition, an amplitude perspective contains two
area-under-curve elements, respectively defined as
QRSA = 0.1 ·
∑
k
i=1
0.5 · width
s
(i)
· height
s
(i)
, where k is
the count of segments, s
(i)
, presented in the QRS com-
plex, and QRSTA = QRSA+0.5·width
T
·0.1·height
T
that factors in the T wave. For a biphasic T wave,
the area derivation only considers the bigger segment.
A high level overview of our learning framework that
operates on the ECG streams is illustrated in Figure 2.
Detailed discussion of the pipelined stream transmis-
sion from a device to the server is outside the scope
of this paper.
Figure 2: The input to our learning framework is a set
of separable ECG streams in either 12-dimensional or 10-
dimensional vectors for the period and amplitude groups,
respectively. Input streams are each dimensionality reduced
to a canonical 3D embedding space, and unlabeled sam-
ple points are further clustered into 16 arrhythmia classes.
Transmission from any of a wearable or an IoT device to
the server is pipelined, one stream at a time.
3 DIMENSIONAL REDUCTION
Directly analyzing an extended time series of the ECG
multivariate stream poses a compute efficiency chal-
lenge and raises the quest for dimensionality reduc-
tion to both explore and perceptually visualize a com-
pact representation of the high dimensional data. In
one formulation, Li et al. (Li et al., 2012) exploit
Locally Linear Embedding (LLE) (Roweis and Saul,
2000) technique to map the ECG signal onto a single,
two dimensional global coordinate system. LLE har-
nesses neighborhood symmetries of linear reconstruc-
tions to learn the global structure of non-linear mani-
folds. In an alternate prospect, many sources of data
are described as a large matrix composition. Amongst
many application domains, matrix representation is
prominent in recommender systems, social networks,
and web page ranking. In our work, we render a col-
lection of ECG feature streams, each as an arrhythmia
matrix, A, that has patients as its rows, m, and the vec-
tor elements of cardiac features as columns, n. One
well established form of matrix analysis is Singular
Value Decomposition (SVD) (Cormen et al., 1990)
that gracefully leads to data reduction of desired di-
mensionality at a minimum reconstruction error.
BeatDiscoveryfromDimensionalityReducedPerspectiveStreamsofElectrocardiogramSignalData
41
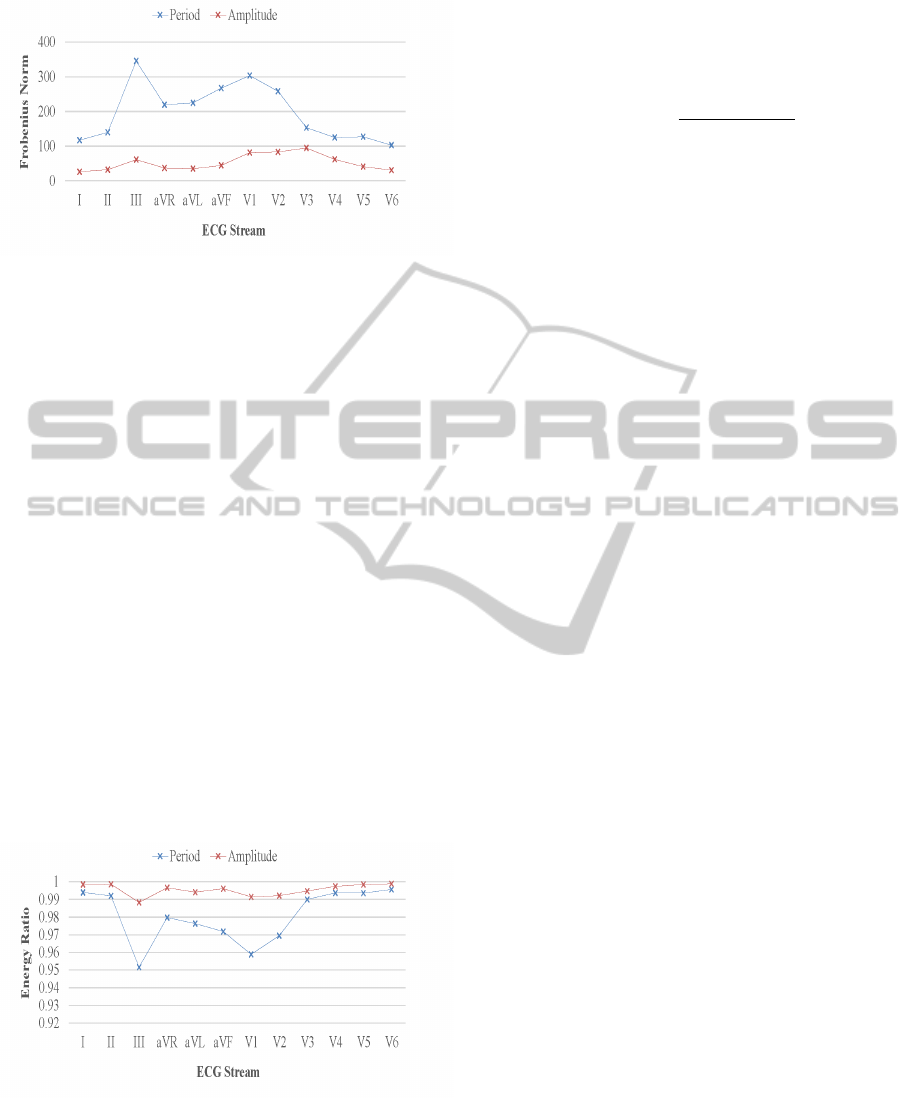
Figure 3: SVD Frobenius norm for similarity between the
original arrhythmia data matrix to its reduced form of three
dimensions, for each ECG view and parametrized by the
period and amplitude feature groups.
Let our input arrhythmia matrix A ∈ R
mxn
be of a
rank r, then SVD states that it is always possible to de-
compose a real matrix into a product of three unique
matrices A = UΣV
T
, where U ∈ R
mxr
and V ∈ R
nxr
are the left and right singular vectors, respectively,
and Σ ∈ R
rxr
is a diagonal matrix comprised of singu-
lar values. The diagonal entries of Σ are all positives
and sorted in a descending order (σ
1
≥ σ
2
≥ ... ≥ 0).
For SVD interpretation, columns r of U, Σ, and V are
perceived as concepts (Rajaraman and Ullman, 2011)
that are hidden in A, hence U relates patients to con-
cepts, similarly V connects ECG terms to concepts,
and Σ attaches a strength or importance to each con-
cept. SVD singles out linear combinations of the data
and yields an optimal set of axes to project the data
on. Each vector of V constitutes the projection axis
of the data, and the corresponding singular value in Σ
identifies the variance of data points for the specific
dimension. The transformed coordinates in the new
projection space are further obtained from the matrix
product UΣ.
Figure 4: SVD retained energy ratio for arrhythmia data
matrix reduction to a three dimensional embedding space,
for each ECG view and parametrized by the period and am-
plitude feature groups.
Reducing the ECG stream data to a k-dimensional
space is simplified to zero-ing out the smallest r − k
singular values in Σ, and producing the diagonal ma-
trix S. By dropping vectors of small importance, ma-
trix B = USV becomes the best rank-k approxima-
tion to A, with maximum similarity quantified by the
Frobenius norm
|A − B|
F
=
q
Σ
i j
(A
i j
− B
i j
)
2
. (1)
Figure 3 shows similarity between the original ar-
rhythmia data matrix to its reduced form of three di-
mensions, for each ECG stream and parametrized by
the period and amplitude feature groups. For every
perspective, matrix columns are markedly reduced
from 12 to 3 and from 10 to 3 for the feature groups,
respectively. The Frobenius norm distance standard
attributes better similarity to the amplitude streams,
mostly due to a nonuniform mixture of real and nom-
inal values apparent in a period feature vector. Like-
wise, Figure 4 depicts qualitative data reduction mea-
sures for each cardiac stream in their respective pe-
riod and amplitude feature groups. The metrics for
selecting the number of matrix dimensions to keep
is conventionally governed by the energy ratio term
∑
k
i=1
σ
2
i
/
∑
r
i=1
σ
2
i
. A ratio range of 0.8 to 0.9 is deemed
acceptable for a reasonable SVD reconstruction error,
yet our analysis denotes most energy is retained in
the top three matrix columns, with a percentile con-
sistently exceeding 95%, as amplitude views display
at least 0.98 proportion.
4 ARRHYTHMIA CLUSTERING
Expert ECG cardiologists largely rely on interpret-
ing visual cues for patient diagnosis, and mainly sub-
scribe to decode recognizable segmentation structures
(Hamameh et al., 2011). However, the abundant sig-
nal data produced by many small, real-time capture-
and-transmit devices necessitate a visual system that
is perceptually intuitive and requires effective algo-
rithms to analyze progressively multiple streams of
increased dimensionality. In our work, transforming
the high dimensional cardiac data to a form both ac-
ceptable for human perception and authentic to the
original data is facilitated by SVD. Projecting heart-
beat data onto a 3D space has the apparent advantage
over a 2D planar mapping (Li et al., 2012) in allowing
arbitrary rotations around the z axis to render the data
model from different vantage points. Multiple view-
points of ECG streams may reveal otherwise obscured
patterns that are essential for a domain expert to make
an informed analysis about a patient.
Our framework regards the 12-perspective stream
data, emitted from the ECG Holter, as separable and
has each of the cardiac views projected onto a per-
SIGMAP2015-InternationalConferenceonSignalProcessingandMultimediaApplications
42

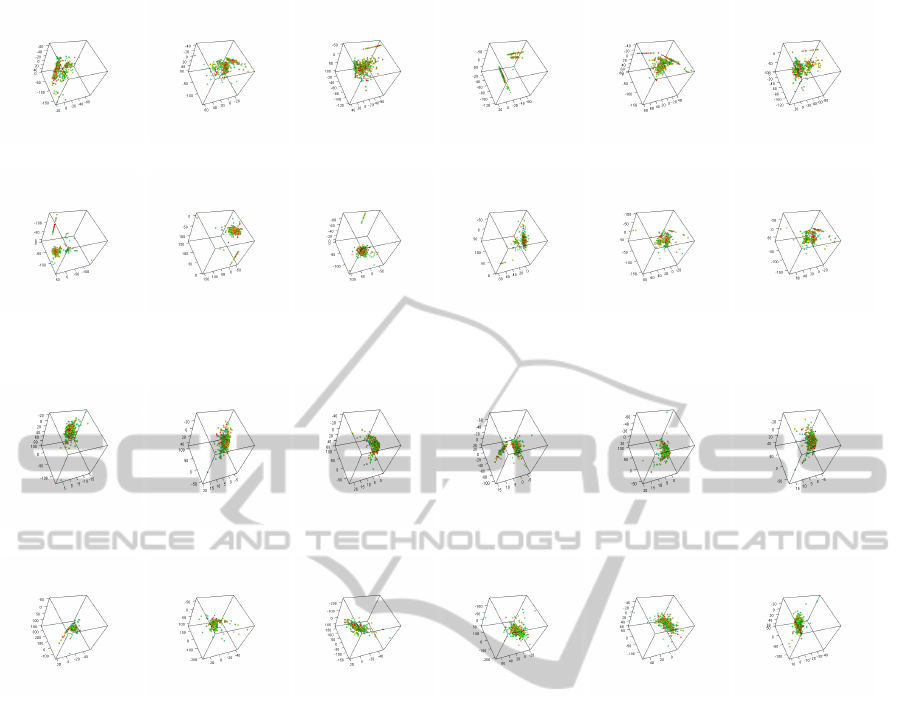
ceptually viable 3D space. Figures 5 and 6 further il-
lustrate stream renditions of the period and amplitude
feature groups, respectively. Each frame of reference
contains 452 patient samples perceived from a pre-
scribed spatial angle, and displayed in a three dimen-
sional space. A closer observation identifies distinct
and vital data needed for arrhythmia clustering, but
there are also clear indications for instances that over-
lay each other, although they might belong to a differ-
ent arrhythmia class, and furthermore, some samples
deviate distantly from the formed partitions. Hence,
our contention that a clustering method to operate ef-
fectively on arrhythmia streams captured from a large
number of patients, must grant clusters to form any
geometrical shape of variable size, and properly ad-
dress data point overlaps. In addition, the algorithm
is required to be robust in the presence of outliers. We
selected the hierarchical Clustering Using REpresen-
tatives (CURE) (Guha et al., 1998) method, explicitly
designed to support our set forth prerequisites.
Cluster analysis of ECG recordings is a powerful
tool for discovering patients of similar arrhythmia dis-
orders. In contrast to supervised methods, our evalu-
ation proceeds anonymously on presumed unlabeled
cardiac data without resorting to prior knowledge of
a cardiologist assessment. Several clustering meth-
ods have been devised in the domain of data mining,
each of its own strengths and shortcomings. For the
sake of keeping the description concise, the reader is
kindly referred to an excellent survey of clustering
methods exclusively applied to time series data (Liao,
2005). CURE stands out as a highly efficient, hierar-
chical clustering algorithm (Johnson, 1967) that has
linear storage requirements O(n) and time complexity
of O (n
2
) for low dimensional data of n points, each of
d dimensionality, and is no worse than the more con-
strained, centroid-based hierarchical method. CURE
is agglomerative and starts by placing each individ-
ual data point in a cluster of its own, and successively
merges the closest pair of clusters until the number of
clusters reduces to k. Each cluster contains a set of
representative points, c, chosen to be well scattered in
the cluster extent, and are further shrunk towards the
cluster centroid by a fractional factor α. Set apart ref-
erence points and the contraction operation that fol-
lows, serve the objectives for capturing a cluster of
arbitrary geometrical profile and mitigating the effects
presented by outliers, respectively. The distance be-
tween a cluster pair, u and v, is delineated by the clos-
est pair of representative points, p and q, one from
each of the clusters
dist(u,v) = min
p∈u.rep,q∈v.rep
dist(p,q). (2)
As the distance between two points, p and q, often
takes a Euclidean form of L
1
-norm or L
2
-norm met-
rics, but also a nonmetric similarity function. Our
cardiac feature vectors mix real, integer and boolean
components and data points may be rather thought of
as directions (Baeza-Yates and Ribeiro-Neto, 1999) in
the vector space model (Salton et al., 1975). Hence,
we chose the adjusted cosine similarity for a distance
measure that computes a 0 to 180 degrees angle be-
tween two zero-mean point vectors and is defined as
sim(p, q) =
(p − p
m
)(q − q
m
)
k(p − p
m
)k
2
k(q − q
m
)k
2
, (3)
where p
m
and q
m
are the mean of p and q, respec-
tively. Adjusted cosine similarity is widely used in
the domain of item-based collaborative filtering.
5 EMPIRICAL EVALUATION
To validate our system in practice, we have imple-
mented a software library that realizes the cluster
analysis of ECG streams in several stages. After col-
lecting and cleaning the archived cardiac data, our li-
brary commences with extracting patient, global, pe-
riod and amplitude based feature vectors. Our fea-
tures are regarded as unlabeled, and follow an explicit
clustering process. In addition to detecting the pres-
ence or absence of arrhythmia individually, each of
the constructed groups represent an objective arrhyth-
mia class and our goal is to further explore and quan-
tify the relations between automatically machine gen-
erated clusters to cardiologist diagnoses.
5.1 Experimental Setup
Our work exploits the R programming language (R,
1997) to acquire the raw arrhythmia data and fosters
cleanup to serve useful in our software environment.
We use the extensive and well maintained arrhythmia
dataset from the UCI Machine Learning Repository
(UCI, 1987), comprised of 452 patient instances with
each ECG trace represented as a 279 feature vector
elements, and chose to impute missing values, mani-
fested primarily in the axis orientation columns, with
the mean of the present feature items. For our study,
we selected the time series attributes held in the 12-
perspective, period and amplitude cardiac groups that
total a majority of 264 features, intentionally leaving
patient and global properties outside the scope of this
work. The measured figures of the dynamic signal
were obtained using the ECG system jointly devel-
oped by IBM and Mount Sinai University Hospital.
As a point of reference, expert cardiologist evaluation
BeatDiscoveryfromDimensionalityReducedPerspectiveStreamsofElectrocardiogramSignalData
43
(a) I. (b) II. (c) III. (d) aVR. (e) aVL. (f) aVF.
(g) V1. (h) V2. (i) V3. (j) V4. (k) V5. (l) V6.
Figure 5: Cardiac period feature group: visually depicted, separable 12-perspective ECG streams, each contains 452 patient
instances viewed from a user set vantage point and displayed in a three dimensional space.
(a) I. (b) II. (c) III. (d) aVR. (e) aVL. (f) aVF.
(g) V1. (h) V2. (i) V3. (j) V4. (k) V5. (l) V6.
Figure 6: Cardiac amplitude feature group: visually depicted, separable 12-perspective ECG streams, each contains 452
patient instances viewed from a user set vantage point and displayed in a three dimensional space.
is attached to each patient record and lists 16 types of
commonly observed cardiac arrhythmia (Table 2).
Our arrhythmia clustering is entirely autonomous
and avoids consulting a specialist diagnosis apriori.
Rather than found on a basis of fixed and unique
assignment of a single arrhythmia type to a patient
(Guvenir et al., 1997), our unsupervised methodology
clusters objectively by similarity in cardiac feature
space, and is therefore impartial to manual process
constraints. Hence, our generated arrhythmia groups
are each exposed to potentially contain a fusion of a
subset of the arrhythmia types specified in Table 2.
CURE is handed the input parameter k to follow the
generation of 16 logical groups for each of the sep-
arable, 12-perspective ECG streams, leading thereof
to a 192 multi-class classification paradigm. For our
reported experiments, we consistently use in a cluster
four representative points, c, that is the minimum set
required to provide concavity for the cluster geomet-
rical shape, and chose a shrinking factor, α, of 0.2 to
resonate with the all-points model and distant from a
more limiting, single centroid based algorithm.
5.2 Experimental Results
Our clustering process solely relies on automatic fea-
ture extraction from natively recorded ECG data and
incorporates statistical methods to facilitate the search
of unsolicited arrhythmia patterns and discover global
relations of cardiac irregularities that are not neces-
sarily bound to an individual patient evaluation. Per-
tinently, our analysis experiments exploit 452 patient
records that are SVD dimensionality reduced to a 3D
projection space, and are further partitioned across 16
relational arrays. First, we studied the inherent al-
location nature of the patient records. Respectively,
Figure 7 shows in a log scale cluster membership dis-
tribution of arrhythmia for both the cardiac period and
amplitude feature groups, each parametrized by the
twelve ECG perspectives. Plotted curves are spread
fairly consistently across views, yet the amplitude
chart exhibits a higher dynamic range, most likely ow-
SIGMAP2015-InternationalConferenceonSignalProcessingandMultimediaApplications
44
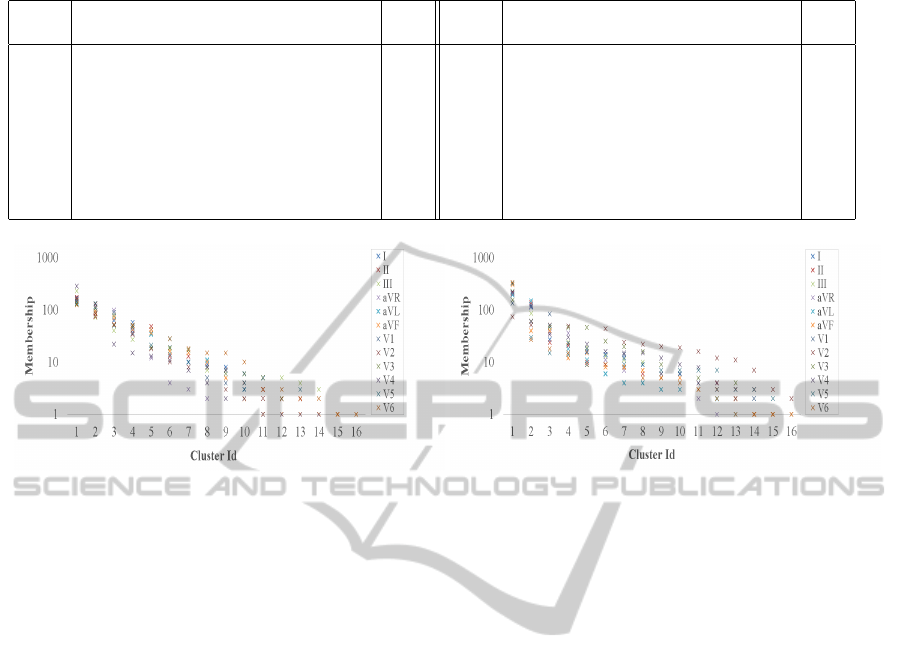
Table 2: Arrhythmia types and distribution assessed by an expert cardiologist.
Class Arrhythmia Dist Class Arrhythmia Dist
1 Normal 245 9 Left Bundle Branch Block 9
2 Coronary Artery 44 10 Right Bundle Branch Block 50
3 Anterior Myocardial Infraction 15 11 One Degree Atrioventricular Block 0
4 Inferior Myocardial Infraction 15 12 Second Degree Atrioventricular Block 0
5 Sinus Tachycardia 13 13 Third Degree Atrioventricular Block 0
6 Sinus Bradycardia 25 14 Left Ventricular Hypertrophy 4
7 Ventricular Premature Contraction 3 15 Atrial Fibrillation or Flutter 5
8 Supraventricular Premature Contraction 2 16 Other 22
(a) Period feature group. (b) Amplitude feature group.
Figure 7: Cluster membership distribution of 452 patient instances for both the cardiac period and amplitude feature groups,
each parametrized by an ECG perspective. Patient membership count in each of our unlabeled and statistically learned clusters
is shown in a log scale.
ing to a uniform vector type of real feature elements.
Next, we examined the relations of our arrhyth-
mia grouping to a human expert analysis, in both the
contextual level and proportionality of irregular car-
diac type assignment. Learning from ECG recordings
of a plurality of patients by applying neutral similar-
ity practices is predicted to reveal multiple arrhyth-
mia types attached to a single patient. Hence, group-
ing cardiac irregularities is equally bound to observe
a fusion effect with memberships that span several ar-
rhythmia categories. In our experiments, we inquire
the cardiologist evaluation for each person post clus-
tering, and assess the blend of cardiac abnormalities
in a cluster. Figure 8 shows arrhythmia type fusion
in clustering our dataset for both the cardiac period
and amplitude feature groups, each parametrized by
the set of ECG perspectives. Some clusters notice-
ably abide by owning a single and distinct arrhyth-
mia class, however most groups do contain several
cardiac anomalies with a count that ranges from two
to thirteen. Correspondingly, Figure 9 shows in rela-
tive error terms, membership distribution comparison
of machine generated clusters to a manual cardiolo-
gist assessment (Table 2). For the former, we take
the average across the 12-view ECG streams for each
the cardiac period and amplitude feature groups. Ev-
idently, our distributions track well and are for most
part inline with the partitions concluded from diag-
noses conducted by a professional. Noticeable how-
ever are fairly large errors for both the largest arrhyth-
mia classes and for clusters identified by an expert
as containing no patients and are therefore statisti-
cally unreasoned. For computational stability, we set
empty, manually assessed clusters to own one patient.
We have extended our discovery study to data that
is outside the scope of our acquired, ECG training set
by artificially generating synthetic cardiac streams. In
a sense, this set of query feature vectors is best re-
garded as means to distort the original ECG signal in
a controlled manner. To this extent, a query vector el-
ement is randomly selected in the range prescribed by
statistically summarizing every feature attribute in the
original dataset. For each the period and amplitude
feature groups and for each ECG perspective, we pro-
duced 50 test vectors to total 600 records per cardiac
collection, with an aggregate of 1200 query vectors.
In its entirety, query data is fully excluded from A,
our SVD matrix representation of the raw arrhythmia
dataset. Each query vector, q, first undergoes transfor-
mation onto the concept space by utilizing the SVD V
matrix and performing qV , and further dimensionality
reduced to our working, 3D projection space.
To feature match the query data, we ultimately at-
tempt to correlate a query perspective to a training
set cardiac view. We accomplish this by employing
a k-nearest neighbor (KNN) (Cormen et al., 1990)
BeatDiscoveryfromDimensionalityReducedPerspectiveStreamsofElectrocardiogramSignalData
45
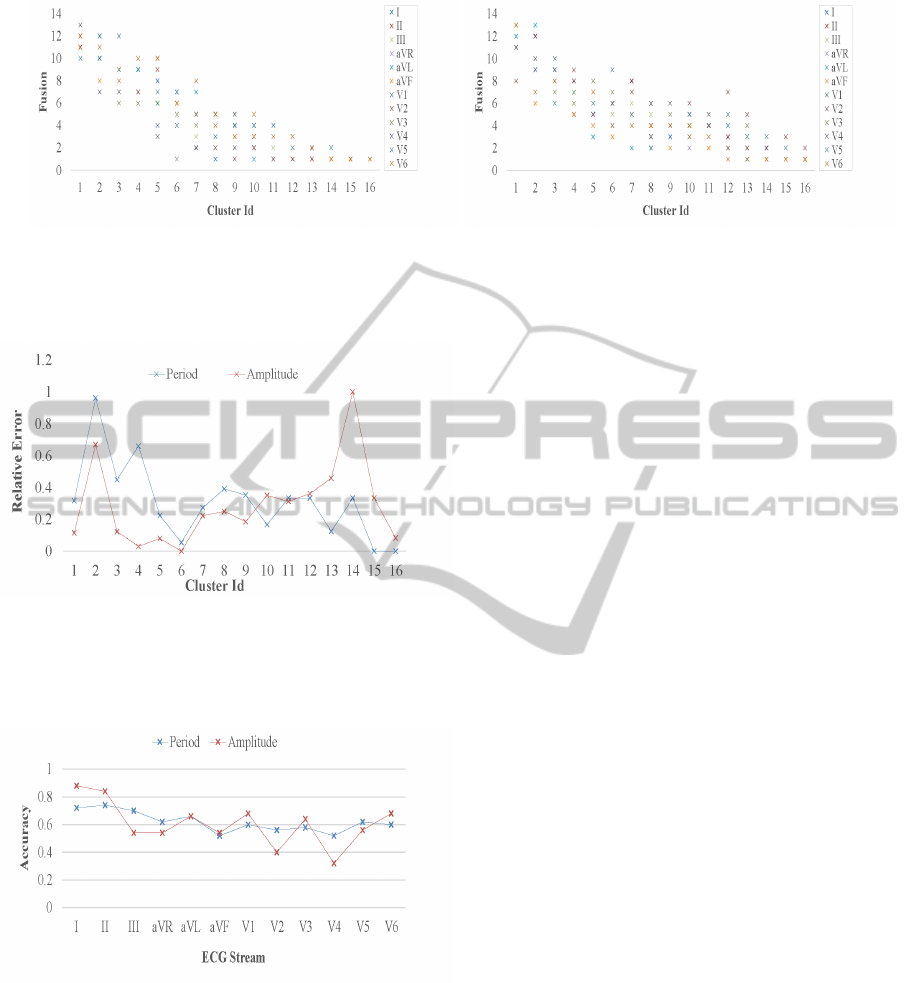
(a) Period feature group. (b) Amplitude feature group.
Figure 8: Arrhythmia type fusion in clustering 452 patient instances for both the cardiac period and amplitude feature groups,
each parametrized by an ECG perspective. Shown are the number of unique, expertly analyzed arrhythmia classes in each of
the unlabeled and statistically learned clusters.
Figure 9: Comparing membership distribution of machine
generated clusters to a manual cardiologist assessment for
452 patient instances. For the former, we take the average
across the 12-view ECG streams for each the period and
amplitude feature groups. Shown in relative error terms.
Figure 10: Classification accuracy in cross validating a
combined arrhythmia collection of query and training fea-
ture vectors, for each ECG view and parametrized by the
period and amplitude feature groups.
baseline classification model that performs a major-
ity voting. Every query vector, q, is sought after the
most similar ECG training record by linearly iterat-
ing the arrhythmia dataset and computing for each
pair the adjusted cosine similarity. The time com-
plexity of this process is O(nm), with n the number
of exclusive training instances and m the number of
queries. Throughout, the number of ECG view occur-
rences for each query perspective collection is accu-
mulated and the highest view score is elected. First,
we cross validated each query vector, q, against an
inclusive, m + n combined training dataset, using the
holdout method with a 90/10 two-way data split. Fig-
ure 10 depicts our accuracy rates for each ECG per-
spective and parametrized by the period and ampli-
tude cardiac group. The period group traces a more
smoother curve and tops at a rate of 0.72, in contrast
to an 0.88 peak for the amplitude group. Secondly, we
provisioned an additional step to evaluate the query
test set, m, on the exclusive training set, n. A confu-
sion matrix that enumerates predicted against actual
ECG perspectives, for each of the period and ampli-
tude feature groups is further depicted in Figure 11.
Results emerge rather underfitting and strongly im-
ply that the arrhythmia collection we use for training
is insufficient to properly represent the highly variant
hypothesis space of the query data.
We compared our unsupervised learning results to
the ones obtained by the originators of the ECG train-
ing dataset (Guvenir et al., 1997). Barring our cross
validation methodology that exploits exclusive query
data, our overall average accuracy of 0.61 is right on
par with their supervised VF15 algorithm that uses
however the raw dataset of fully populated attributes
and successively processes each into an interval data
structure. Unlike our setup that operates on the source
cardiac features verbatim, and reduces their dimen-
sionality by a factor of 4 and 3.33 for the period and
amplitude group, respectively. The work by Li et al.
(Li et al., 2012) that exploits two-dimensional man-
ifolds uses for evaluation a relatively small and pre-
annotated dataset of eight patients, each described by
six statistically driven features, and recorded from
three perspective ECG streams. A striking disparity
from our 452 patient instances, each represented as a
pair of 12 cardiac views, to make a fair and sustain-
SIGMAP2015-InternationalConferenceonSignalProcessingandMultimediaApplications
46
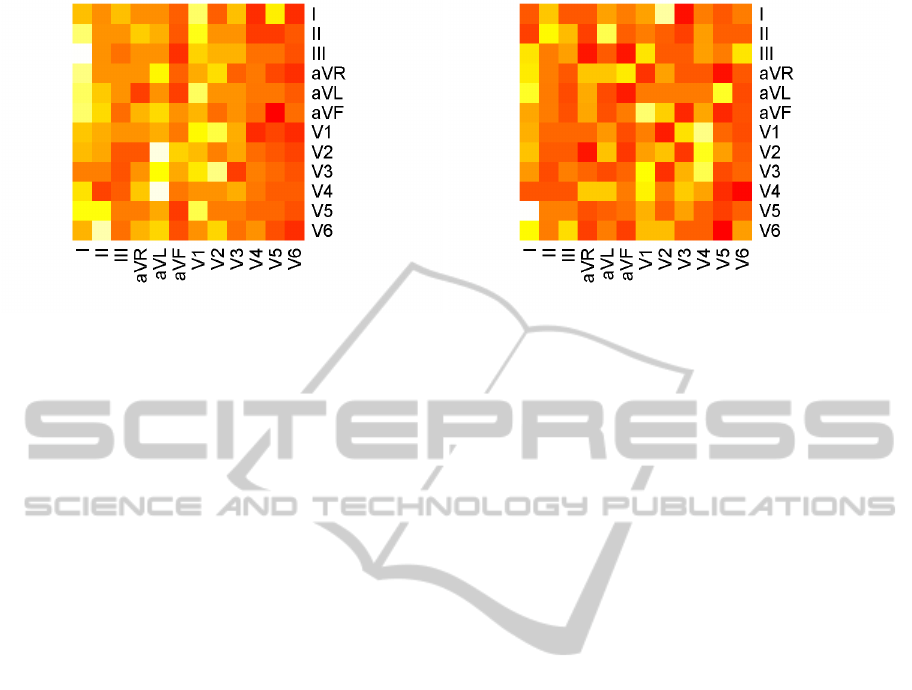
(a) Period feature group. (b) Amplitude feature group.
Figure 11: Confusion matrices of query data classification for each the period and amplitude feature groups. Showing pre-
dicted against expected behavior of each of the 12-perspective ECG streams.
able system level comparison on performance. On the
other hand, we contend that our 3D visuals of Figure 5
and 6 reveal authentically both cluster formations and
outliers to better assist a specialist in cardiac anomaly
analysis, whereas a two-dimensional projection is less
informative and more limited to exception detection.
6 CONCLUSIONS
We have demonstrated the apparent potential in de-
ploying information retrieval and unsupervised ma-
chine learning methods to accomplish the discov-
ery of cardiac arrhythmia categories. By disregard-
ing any prior cardiologist knowledge from presumed
unlabeled ECG recordings, our proposed system is
generic and scalable, and relies entirely on objective
closeness metrics in feature space. To accommodate
continuous streaming and the immediate response re-
quired for detecting abnormal cardiac behavior, our
framework separates ECG perspective channels for
effective transmission and progressive analysis, and
reduces the dimensionality of each to fit the low
power and communication constraint, wearables and
IoT devices. Raw data projection onto a three dimen-
sional embedding space integrates a vital stage for a
specialist to administer preparatory inspection of ar-
rhythmia clusters, and is of considerable advantage
compared to a 2D planar mapping in facilitating spa-
tial data visualization to minimize obstruction.
Our contribution to regard an ECG recording as
disjoint and compact perspective entities is substanti-
ated by the efficacy of our cluster analysis, data visu-
alization for human depth perception, and classifica-
tion. Unlike most systems that tend to aggregate all
cardiac view channels into a single discipline. With
the intuition of a scheduling scheme that prioritizes
the submission of a single ECG perspective at a time,
rather than issuing all view channels as a composite,
a better overlap of stream transmission latency from
an ECG device with either machine or human expert
analysis on the receiving end, is attained. Our system
classification rate commensurates with a correspond-
ing supervised model that incurs a higher computa-
tional cost by employing the unpacked dimensionality
of features. However, to ameliorate a fairly impaired
performance of cross validating a trained ECG with
exclusively generated, random cardiac test streams,
requires an expanded dataset of patient instances.
A direct progression of our work is to extract car-
diac features directly from a live ECG signal, and to
assess the efficiency of our devised pipelined sched-
uler for communicating distinct ECG perspectives in
a real world, many-devices-to-a-hub network forma-
tion. We look forward to advance our study and in-
corporate an augmented and a more statistically rea-
soned, ECG training dataset that makes the evalua-
tion of an exclusive test query collection of large vari-
ance more robust. Lastly, the flexibility of our soft-
ware allows us to pursue a higher level correlation
of ECG perspective pairs for both clustering and im-
proved recognition of visualization cues, and better
understand second order set of arrhythmia relations.
ACKNOWLEDGEMENTS
We would like to thank the anonymous reviewers for
their insightful suggestions and feedback,
BeatDiscoveryfromDimensionalityReducedPerspectiveStreamsofElectrocardiogramSignalData
47

REFERENCES
Baeza-Yates, R. and Ribeiro-Neto, B., editors (1999). Mod-
ern Information Retrieval. ACM Press Series/Addison
Wesley, Essex, UK.
Baig, M. M., Gholamhosseini, H., and Connolly, M. J.
(2013). A comprehensive survey of wearable and
wireless ECG monitoring systems for older adults.
MBEC, 51(5):485–495.
Cormen, T. H., Leiserson, C. H., Rivest, R. L., and
Stein, C. (1990). Introduction to Algorithms. MIT
Press/McGraw-Hill Book Company, Cambridge, MA.
Duda, R. O., Hart, P. E., and Stork, D. G. (2001). Unsu-
pervised learning and clustering. In Pattern Classifi-
cation, pages 517–601. Wiley, New York, NY.
Goldberger, A. L. and Goldberger, E. (1977). Clinical Elec-
trocardiography: A simplified approach. Mosby Year
Book, St. Louis, MO.
Guha, S., Rastogi, R., and Shim, K. (1998). CURE - an
efficient clustering algorithm for large databases. In
Management of Data (SIGMOD), pages 73–84, Seat-
tle, WA.
Guvenir, H. A., Acar, B., Demiroz, G., and Cekin, A.
(1997). A supervised machine learning algorithm
for arrhythmia analysis. In Computers in Cardiology
(CIC), pages 433–436, Lund, Sweden.
Hamameh, G., McIntosh, C., and Drew, M. S. (2011).
Perception-based visualization of manifold-valued
medical images using distance-preserving dimension-
ality reduction. Transactions on Medical Imaging,
30(7):1314–1327.
Johnson, S. C. (1967). Hierarchical clustering schemes.
Psychometrika, 32(3):241–254.
Kantz, H. and Schreiber, T. (1998). Human ECG: nonlin-
ear deterministic versus stochastic aspects. Science,
Measurement and Technology, 145(6):279–284.
Kaufman, L. and Rousseeuw, P. J., editors (1990). Finding
Groups in Data: An Introduction to Cluster Analysis.
Wiley, New York, NY.
Li, Z., Xu, W., Huang, A., and Sarrafzadeh, M. (2012). Di-
mensionality reduction for anomaly detection in Elec-
trocardiography. In Wearable and Implantable Body
Sensor Networks, pages 161–165, Aachen, Germany.
Liao, T. W. (2005). Clustering of time series data a survey.
Pattern Recognition (PR), 38(11):1857–1874.
Manning, C. D., Raghavan, P., and Schutze, H. (2008). In-
troduction to Information Retrieval. Cambridge Uni-
versity Press, Cambridge, United Kingdom.
R (1997). R project for statistical computing. http://www.
r-project.org/.
Rajaraman, R. and Ullman, J. D. (2011). Mining of Massive
Datasets. Cambridge University Press, New York,
NY.
Roweis, S. T. and Saul, L. K. (2000). Nonlinear dimension-
ality reduction by locally linear embedding. Science,
Measurement and Technology, 290(5500):2323–2326.
Salton, G., Wong, A., and Yang, C. S. (1975). A vector
space model for automatic indexing. Communications
of the ACM, 18(11):613–620.
UCI (1987). Machine learning repository - Arrhyth-
mia data set. https://archive.ics.uci.edu/ml/
datasets/Arrhythmia.
Wenyu, Y., Gang, L., Ling, L., and Qilian, Y. (2003). ECG
analysis based on PCA and SOM. In Neural Networks
and Signal Processing, pages 37–40, Nanjing, China.
SIGMAP2015-InternationalConferenceonSignalProcessingandMultimediaApplications
48
