
Evolving Close-to-Real Digital Microstructures in
Polycrystalline Materials
A Monte Carlo Simulation Approach
K. R. Phaneesh
1
, Anirudh Bhat
2
, G. Mukherjee
3
and K. T. Kashyap
4
1
Dept. of Mechanical Engineering, M. S. Ramaiah Institute of Technology, Bangalore, India
2
School of Aerospace Engineering, Georgia Institute of Technology, Atlanta 30332, U.S.A.
3
Consultant, Valley Stream Drive 513, Newark, 19702, Delaware, U.S.A.
4
Department of Mechanical Engineering, Atria Institute of Technology, Bangalore, India
Keywords: Monte Carlo Simulation, Metropolis Algorithm, Al-4% Cu, Annealing, Simulated Microstructure.
Abstract:
For more than three decades now simulation of recrystallization and grain growth phenomena in annealed
metals have been studied through a variety of computer modeling techniques including that of Monte Carlo
(MC) simulation. In this study, we have been able to show the efficiency of the MC technique by evolving
simulated microstructures comparable very closely to real microstructures. The real microstructures were
generated in about a 50% cold-worked alloy of Al-4% Cu (Duralumin) annealed to various degrees. The
digital microstructures were evolved through a 2D simulation of a square lattice using Potts model Monte
Carlo simulation technique based on the Metropolis algorithm. Through our work we have been able to
show the close similarity between microstructures of real metals and microstructures digitally evolved
through simulation, perhaps for the first time, thereby validating the MC technique as an efficient computer
simulation tool for grain growth studies.
1 INTRODUCTION
Annealing is an important heat treatment process
carried out widely in the industry during mechanical
and thermal processing of cold-worked
polycrystalline materials. During this process,
metals undergo three stages of microstructural and
behavioral transformation - recovery,
recrystallization and grain growth. While the first
two stages are driven by the energy stored in the
metals during cold working, grain growth is driven
primarily by the reduction of excess energy stored in
the grain boundaries (Humphreys and Hatherly,
2005). The final microstructure in a polycrystalline
material, i.e., the grain size & its distribution, grain
shape & its geometry, depends largely on the extent
of grain growth that has taken place which in turn is
influenced by time, temperature and the presence of
second phase particles.
The microstructures of polycrystalline materials
carry valuable information which helps predict their
mechanical behavior through study of their grain
shapes and sizes. The average grain size, especially,
has a profound effect on the strength of materials, as
given by the Hall-Petch equation. The average grain
size of polycrystals are known to vary according to
degree of growth driven by curvature on the one
hand, and on the other hand stunted by the presence
of second phase particles. The study of growth and
stagnation of grain size in polycrystals has been
widely aided by the simulation approach of
generating digital microstructures, which follow the
basic guide lines of formation of real
microstructures.
Microstructures of metals resulting from normal
grain growth is distinguished by two characteristics
– the first is the presence of microstructural
homogeneity, in the sense that the size of the largest
grain present in the ensemble is only 2.5 – 3 times
bigger than the average grain size of the
microstructure. The second characteristic is the time
invariance of the grain size distribution which
suggests self-similarity in grain shapes and sizes at
different stages of grain growth (Anderson et al.,
1984). Both these conditions of normal grain growth
found in real microstructures have been sufficiently
displayed in simulated microstructures by many
researchers through MC simulation studies
118
Phaneesh K., Bhat A., Mukherjee G. and Kashyap K..
Evolving Close-to-Real Digital Microstructures in Polycrystalline Materials - A Monte Carlo Simulation Approach.
DOI: 10.5220/0005531401180124
In Proceedings of the 5th International Conference on Simulation and Modeling Methodologies, Technologies and Applications (SIMULTECH-2015),
pages 118-124
ISBN: 978-989-758-120-5
Copyright
c
2015 SCITEPRESS (Science and Technology Publications, Lda.)

(Srolovitz et al., 1984; Saito, 1997; Wang et al.,
2009 and Phaneesh et al., 2013). These studies also
show the statistical similarity between
microstructures generated in real materials and
microstructures generated through MC simulation.
But what has not been very well demonstrated is the
grain shapes in simulated microstructures imitating
the grains in the real microstructures. Through our
work, and perhaps for the time according to our
studies, we have been able to show a stark similarity
between certain grains of digital and the real
microstructures, and in the process, validate further
the relevance of MC simulation technique in grain
growth studies. What is exceptional here is the fact
that the digital microstructures that have been
selected for comparison have been drawn from
various combinations of parameters such as various
surface fractions of static second phase particles (f)
which inhibit grain growth, variation in matrix sizes
(N) which represent the sample material surfaces,
different Q states which represent grain orientations,
various simulation temperatures (kT) which act as
effects of higher temperatures during simulation,
various stages of grain growth as given by Monte
Carlo steps (MCS), and so on. Thus this is a
comprehensive comparison between digital
microstructures drawn from a large simulation
domain and some real microstructures generated
from a very commonly used non-ferrous alloy,
Duralumin.
2 THE MONTE-CARLO
METHOD OF SIMULATION
The Monte Carlo method is a probabilistic computer
simulation technique used to study grain growth and
related phenomena. While analytical models predict
ensemble characteristics of microstructural
evolution, computer simulations have helped to
generate snapshots of the evolving microstructure
with time. Using the computational version of
metallography, both local and ensemble properties
of the microstructure may be determined from these
snapshots. Among a few computer simulation
methodologies which have been evolved over the
years, the Monte Carlo method is one of the
prominent techniques employed to simulate
microstructural evolution in crystalline materials.
This method was developed by Ulam et al., (1947)
for basically studying the diffusion of neutrons in
fissionable materials. But adaptation of Monte Carlo
technique using Potts model for the simulation of
microstructure was first introduced by (Anderson et
al., 1984 and Srolovitz et al., 1984) for two-
dimensional grain growth and extended to three-
dimensional grain growth by Anderson et al.,
(1989).
The procedure for Monte Carlo Potts model
simulation of grain growth based on Metropolis
Algorithm is as follows:
1. Choose the lattice type i.e. square or triangular.
It is square in our case.
2. A square matrix of size ‘N’ is then generated,
which contains all its elements as random
numbers ranging from 1 to Q, where Q stands for
the number of grain orientations.
3. Among the N
2
elements present in the matrix, a
random site is chosen and is compared with all
its nearest neighboring elements, which is eight
in case of square lattice.
If i = element randomly picked, and j = any of the
eight neighboring elements that i is compared with,
then,
∂
ij
= 0 if i j
∂
ij
= 1 if i = j
where ∂
ij
= Kroneckar delta, a relative interaction
energy value between one element and any other
neighboring element. The Hamiltonian (E
1
) is then
calculated for the chosen element by the following
relation,
(E
1
) =
∑
si ∂sj 1
(1)
where J ( > 0) is an interfacial energy constant of the
system and n the total number of lattice sites in the
system.
4. The grain orientation corresponding to the
chosen element is changed into a new random
element in its place and the Hamiltonian (E
2
) is
calculated again for the new element using
equation (1), and then giving the energy change,
ΔE = E
2
- E
1
(2)
5. If ΔE ≤ = 0, the change is accepted else
if ΔE > 0, compute probability
p = exp (-ΔE/kT) (3)
where k = Boltzmann constant, and, T = temperature
If r < p where r is a random number generated and
uniformly distributed between 0 & 1, the change is
still accepted, else, rejected.
The entire steps from 3 to 5 form one iteration and
are repeated ‘N
2
’ times, which then constitute one
Monte Carlo Step (MCS), which is the measure of
time in simulation. Also, in the current paper,
EvolvingClose-to-RealDigitalMicrostructuresinPolycrystallineMaterials-AMonteCarloSimulationApproach
119

simulations have been carried out at both kT=0 and
at values 1>kT>0, under periodic boundary
conditions. It is to be noted here that the term kT in
simulation replaces both the Boltzmann constant and
the temperature as an assumed combined product.
The term kT generally takes a value between 0 and 1
and represents the thermal energy of simulation. It is
analogous to the thermal energy of experimental
systems but not directly related (Janssens et al.,
2007). Just as in the real world, when a phase
change is imminent when a metal is heated beyond a
critical temperature, there is a critical value for the
term KTs, beyond which the microstructure
evolution through simulation seizes and a disordered
state sets in.
3 EXPERIMENTAL HARDWARE
AND SOFTWARE
All the experiments were carried out on a specially
built system with 16 GB ram, INTEL CORE 15-
2500K-6M-3.3 GHZ Processor and a Asus P8H67-
MLE Motherboard B3 Model. The code was written
on a Java Core Eclipse platform and close attention
was paid to memory management since very large
arrays were run. The code invokes generation of
massive random numbers which was achieved
through the JAVA virtual machine (JVM).
Random number generation plays a crucial role
in the process of computer simulation of grain
growth. Since computers are basically calculating
machines, and use deterministic algorithms to
generate random numbers, they basically produce
pseudo random numbers, unless and until they are
accessing some external device such as a gamma ray
counter or a clock. The very foundation of Monte
Carlo method lies on generation of robust and long
range random numbers, especially since certain
simulation trials have to last millions of Monte
Carlo Steps, preferably without repeating the
sequence. The JAVA virtual machine (JVM) has a
reliable random number generator based on linear
congruential algorithm and can produce billions of
random numbers (2
48
, to be precise) on the trot,
before it repeats the sequence.
4 RESULTS AND DISCUSSIONS
In this work, Al-4% Cu samples, initially hot
extruded to about 50%, were annealed at a
recrystallization temperature of 480
0
C, and held for
various durations such as 1, 2, 3, 4 and 10 hours.
They were then polished with emery sheets (with
grit sizes 80 – 1200) and etched with Keller’s
reagent (2.5% HF, 1.5% HNO
3
, 1% HCl, rest
ethanol) for 10 seconds. They were then washed in
running water and dried with methanol and hair
dryer. The microstructures were observed under a
microscope and snapshots were taken, at
magnifications of 50x, 100x, 200x, etc. Al-4% Cu
was selected because upon annealing the alloy
precipitates fine second phase particles of CuAl
4
which pin grain boundaries and stagnate the average
grain size.
On the other hand, simulations were run on
various matrix sizes with different quantities of
second phase particles randomly interspersed to
represent polycrystalline materials. The matrices
were processed with millions of steps of the
Metropolis algorithm simulating grain growth which
takes place in metals during annealing. Simulated
grain structures were captured at different stages of
grain growth evolution of various matrix samples
and selected portions of these microstructures have
been used for pictorial comparisons with real
microstructures. Pictures from stagnation stage,
which refers to a stage where no more evolution is
possible due to grain growth inhibition by second
phase particles, have also been used in the
comparison.
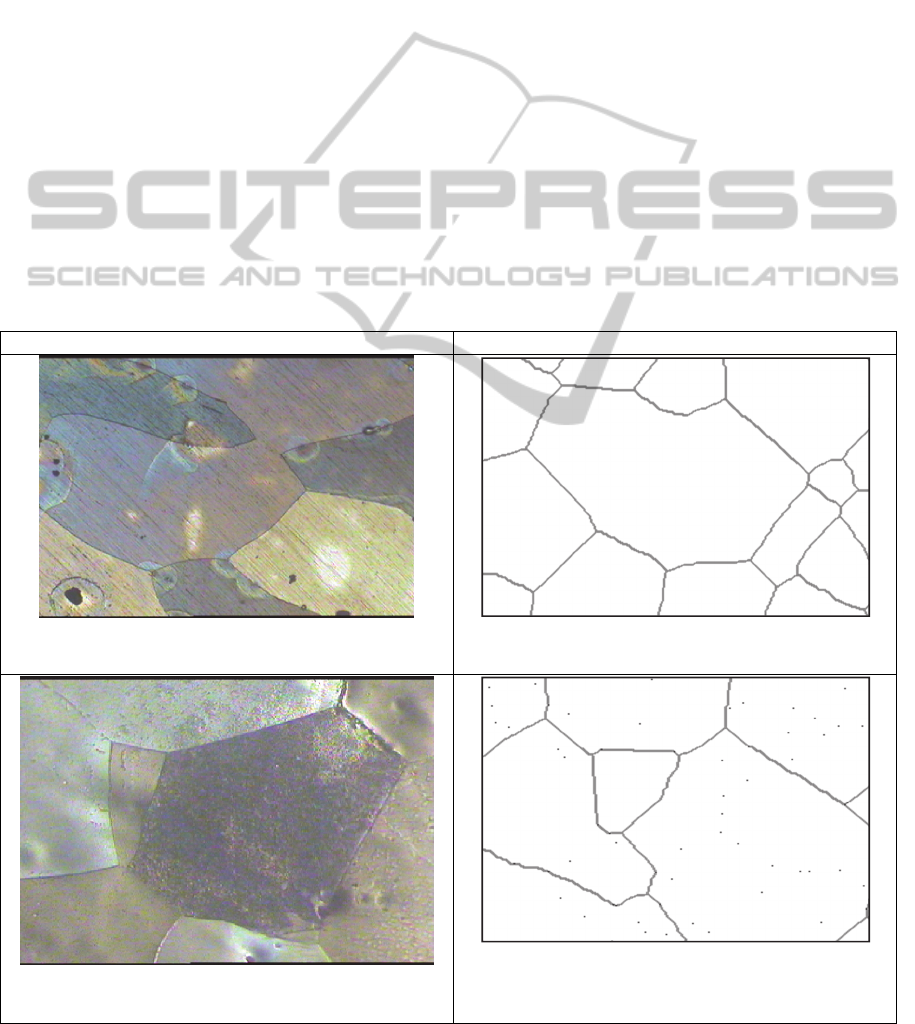
Table 1 shows pictorial comparisons between
various real microstructures on the left hand side,
and, the simulated microstructures on the right hand
side. The first set of pictures shown in Figure 1(a)
and 1(b) allows for a comparison between an Al-
4%Cu alloy annealed at 480
0
C for one hour, and
photographed at 100x magnification, with a portion
of the simulated microstructure evolved with a
square matrix of size (N) 1000 x 1000, a Q-state
value of 16, with zero percent of second phase
particles representing a pure metal and finally a
certain stage in grain growth as represented by the
number of Monte Carlo steps of 50,000.
Figures 2(a) and 2(b) show the comparison
between the same alloy annealed for two hours with
a digital microstructure having parameters N=1000,
Q=64, f=0.001, kT=0.5 and MCS=1,394,926 (at
stagnation). The selected crystal surface is based on
1000 x 1000 matrix with an assumed 64 (Q) grain
orientations. A value of f=0.001 means that a
surface fraction representing 0.1% of the surface of
the microstructure is occupied by second phase
particles each having a size of one unit being
randomly distributed throughout the matrix. These
static particles are shown as tiny dark spots in the
SIMULTECH2015-5thInternationalConferenceonSimulationandModelingMethodologies,Technologiesand
Applications
120
digital photos. Such second phase particles are also
present in the real microstructure of the Al-4% Cu
alloy but cannot be seen under normal metallurgical
microscope and at lower magnifications. These
second phase particles pin the grain boundaries and
stagnate them from growing any further. This is
observed both in reality as well as in Monte Carlo
simulation making it another valid reason for
adopting this technique. Figure 2(b) here represents
the stagnated stage of grain growth in simulated
environment. A value of kT=0.5 means that a higher
temperature effect (but which cannot be equated to
an exact real temperature) is introduced into grain
growth under simulation. It is very well known that
grains grow faster at higher temperatures and higher
values of kT show the same effect as well. Finally
grain growth has been stagnated due to inhibition of
grain boundaries by second phase particles at more
than a million steps of the algorithm, which is
equivalent to passage of time in simulation.
It should be, however, noted here that there are
no conclusions made to equate the simulation
samples to the real alloy samples but an effort is
made towards realistic representation of actual
microstructures through computer simulation. At
current levels of research, simulated microstructures
just represent generic metals and not particular
alloys. But future research may well be represent
real alloys through their simulated counterparts. This
opens the door for understanding grain structures of
real metals and their grain growth better.
All the rest of the photos from Figure 3 to Figure
8 show comparison between real and simulated
grain regimes under different parameters but show
excellent shape similarities between certain grains
on either side. Figures 3(a) and 3(b) show a
comparison between two vertices on either side by
encircling them. According to theory (Smith, 1952)
three grains meeting at a vertex should be at an
angle of 120
0
to each other for a stable grain
structure. This could very well be seen in the
vertices encircled and also in all real and simulated
microstructures further validating the technique.
Table 1: Comparison between Real and simulated microstructures.
Real microstructures from annealed Al-4% Cu alloy Simulated microstructures
Figure 1(a): Annealed at 480
0
C for 1hr, at 100x.
Figure 1(b): N=1000, Q=16, f=0, MCS=50000.
Figure 2(a): Annealed at 480
0
C for 2hr, at 100x.
Figure 2(b): N=1000, Q=64, f=0.001, MCS=1394926 (at
stagnation).
EvolvingClose-to-RealDigitalMicrostructuresinPolycrystallineMaterials-AMonteCarloSimulationApproach
121
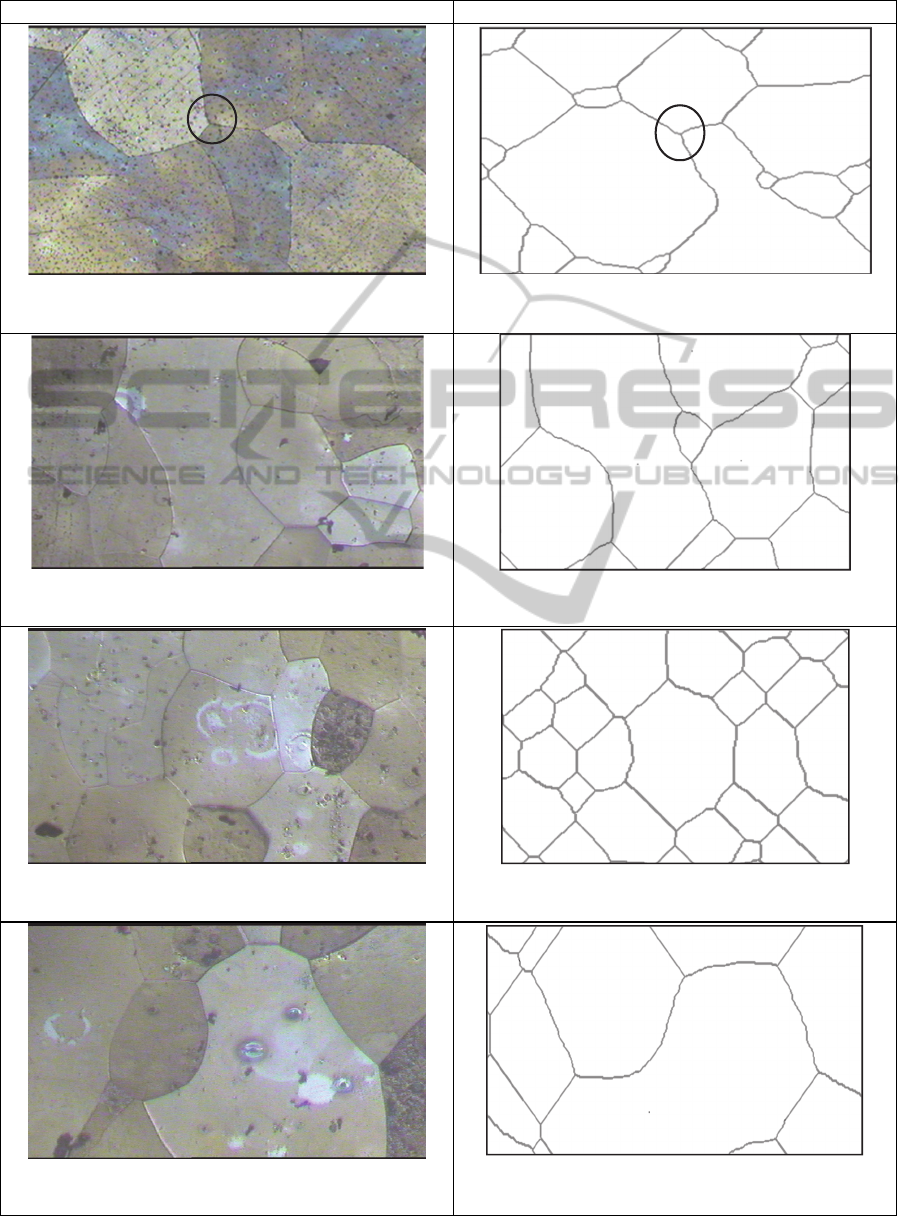
Table 1: Comparison between Real and simulated microstructures. (cont.)
Real microstructures from annealed Al-4% Cu alloy Simulated microstructures
Figure 3(a): Annealed at 480
0
C for 3hr, at 100x.
Figure 3(b): N=1000, Q=32, f=0, MCS=50000.
Figure 4(a): Annealed at 480
0
C for 3hr, at 100x.
Figure 4(b): N=1000, Q=32, f=0, MCS=50000.
Figure 5(a): Annealed at 480
0
C for 3hr, at 100x.
Figure 5(b): N=1000, Q=32, f=0, MCS=50000.
Figure 6(a): Annealed at 480
0
C for 3hr, at 200x.
Figure 6(b): N=1000, Q=64, f=0.001, MCS=60000.
SIMULTECH2015-5thInternationalConferenceonSimulationandModelingMethodologies,Technologiesand
Applications
122
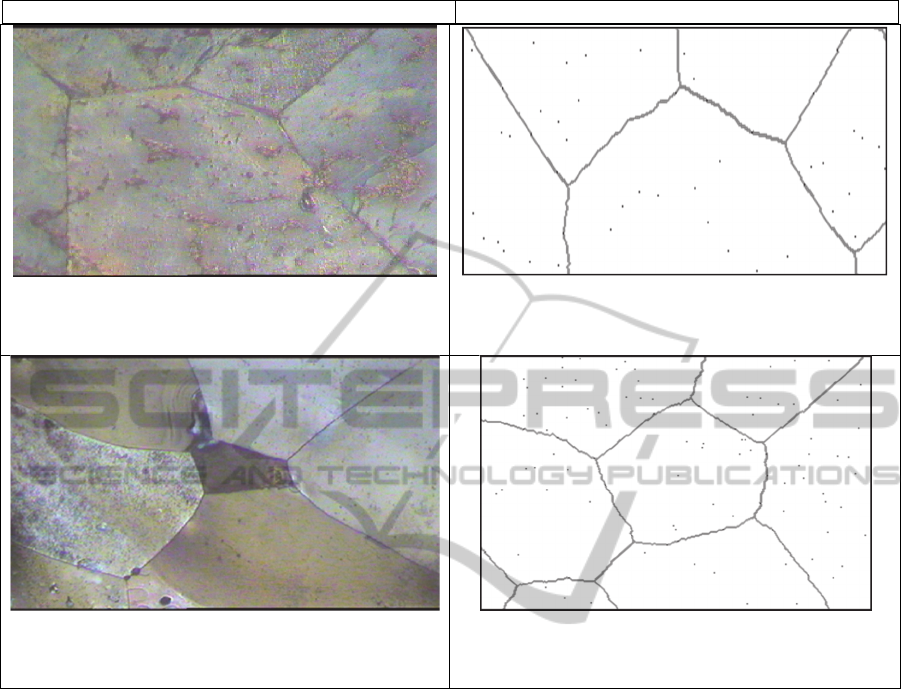
Table 1: Comparison between Real and simulated microstructures. (cont.)
Real microstructures from annealed Al-4% Cu alloy Simulated microstructures
Figure 7(a): Annealed at 480
0
C for 4hr, at 200x.
Figure 7(b): N=1000, Q=64, f=0.001, kT=0.4,
MCS=1589026(stagnation).
Figure 8(a): Annealed at 480
0
C for 10hr, at 50x.
Figure 8(b): N=1000, Q=64, f=0.001, kT=0.4,
MCS=1589026(stagnation).
5 CONCLUSIONS
This work has been able to show close similarity
between microstructures generated after annealing a
prominent non-ferrous alloy and the simulated
microstructures evolved by the Monte Carlo
simulation technique. The striking closeness
especially between certain set of grains between real
and simulated microstructures enhances the validity
of the MC technique to investigate grain growth and
its inhibition in polycrystalline materials. The 120
0
angle vertices found in stable grain structures in real
metals can also be seen prominently in digital
structures. But it should be iterated here that the
comparison only allows for the topological and grain
shape similarities between the two sets of
micrographs and no other comparisons are made
with respect to their evolution vis-a-vis time and
temperature. It is an ongoing work to relate real and
simulated microstructures on all parameters so that
MC simulation can be applied to particular alloys as
against generic as is being done now.
ACKNOWLEDGEMENTS
Acknowledgements are due to - Visvesvaraya
Technological University, Karnataka, India, which
funded this project (No. VTU/Aca/2009-10/A-
9/11417); Dr. S. Y. Kulkarni, Principal, Dr. Ramesh
Rao, Prof. & Head, Dept of Mechanical
Engineering, M. S. Ramaiah Institute of
Technology, Dr. R. Chandrashekar (rtd.), MSRIT,
Bangalore; Dr. K. N. B. Murthy, Principal, Dr. C. S.
Ramesh, P E S Institute of Technology, Bangalore.
REFERENCES
Anderson, M. P., Srolovitz, D. J., Grest, G. S. & Sahni, P.
EvolvingClose-to-RealDigitalMicrostructuresinPolycrystallineMaterials-AMonteCarloSimulationApproach
123

S. (1984) Computer simulation of grain growth - I.
Kinetics, Acta Metallurgica. 32. p.783-792.
Burke, J. E. & Turnbull, D. (1952) Recrystallization and
grain growth, Progress in Metal Physics. 3. p.220-292.
Hillert, M. (1965) On the theory of normal and abnormal
grain growth, Acta Metallurgica. 13 (3). p. 227-238.
Humphreys, F. J. & Hatherly, M. (2005) Recrystallization
and Related Annealing Phenomena. 2
nd
Ed. Elsevier,
Pergamon: U. K.
Janssens, K. G. F., Raabe, D., Kozeschnik, E.,
Miodownik, M. A. and Nestler, B. (2007)
Computational Materials Engineering - An
introduction to Microstructure Evolution. 1
st
Ed.
Elsevier.
Phaneesh, K. R., Bhat, A., Mukherjee, G. and Kashyap, K.
T. (2013) Bulletin of Material Science. 36 (4). p. 709 –
713.
Ryum, N. and Hunderi, O. (1989) On the analytic
description of normal grain growth, Acta Metallurgica.
37. p. 1375-1379.
Saito, Y. (1997) The Monte Carlo simulation of
microstructural evolution in metals, Material Science
& Engineering. A223. p. 114–124.
Smith, C. S. (1952) Grain shapes and other metallurgical
applications in topology, in: Metal Interfaces, ASM,
Cleveland, p. 65-108.
Srolovitz, D. J., Anderson, M. P., Sahni P. S and Grest, G.
S. (1984) Computer simulation of grain-growth: II.
Grain size distribution, topology, and local dynamics,
Acta Metallurgica. 32. p. 793-802.
Ulam, S., Richtmyer, R. D. and Von Neumann, J. (1947)
Statistical methods in neutron diffusion, Los Alamos
Scientific Laboratory Report. LAMS. p. 551.
Wang, H., Liu, G. and Qin, X. (2009) Grain size
distribution and topology in 3D simulation with large-
scale Monte Carlo method, International Journal of
Minerals, Metallurgy and Materials. 1. p. 37.
SIMULTECH2015-5thInternationalConferenceonSimulationandModelingMethodologies,Technologiesand
Applications
124
