
Mobile Malware Detection using Op-code Frequency Histograms
Gerardo Canfora, Francesco Mercaldo and Corrado Aaron Visaggio
Department of Engineering, University of Sannio, Benevento, Italy
Keywords:
Malware, Android, Security, Testing, Static Analysis.
Abstract:
Mobile malware has grown in scale and complexity, as a consequence of the unabated uptake of smartphones
worldwide. Malware writers have been developing detection evasion techniques which are rapidly making
anti-malware technologies uneffective. In particular, zero-days malware is able to easily pass signature based
detection, while dynamic analysis based techniques, which could be more accurate and robust, are too costly
or inappropriate to real contexts, especially for reasons related to usability. This paper discusses a technique
for discriminating Android malware from trusted applications that does not rely on signature, but on iden-
tifying a vector of features obtained from the static analysis of the Android’s Dalvik code. Experimentation
accomplished on a sample of 11,200 applications revealed that the proposed technique produces high precision
(over 93%) in mobile malware detection, with an accuracy of 95%.
1 INTRODUCTION
A recent report from Gartner (Gartner, 2014) shows
that the worldwide sales of mobile phones totaled 301
million units in the third quarter of 2014; in addition,
it estimates that by 2018 nine out of ten phones will
be smartphones. Accordingly, the number of smart-
phone applications is explosively growing. Unfortu-
nately, such popularity also attracts malware develop-
ers, determining an increased production of malware
for the Android platform. Not only official market-
places, such as Google Play (GooglePlay, 2014), but
a number of third-party marketplaces (AppBrain, Ap-
toide, Blackmart Alpha) provide smartphone applica-
tions: anecdotal evidence shows that these markets
are very likely to contain malware.
In February 2011, Google introduced Bouncer
(GoogleMobile, 2014) to screen submitted apps for
detecting malicious behaviors, but this has not elim-
inated the problem, as it is discussed in (Oberheide
and Miller, 2012). Existing solutions for protecting
privacy and security on smartphones are still ineffec-
tive in many facets (Marforio et al., 2011), and many
analysts warn that the malware families and their vari-
ants for Android are rapidly increasing. This scenario
calls for new security models and tools to limit the
spreading of malware for smartphones.
The Fraunhofer Research Institution for Applied
and Integrated Security has performed an evaluation
of antivirus for Android (Fedler et al., 2014): the con-
clusion is there are many techniques for evading the
detection of most antivirus. An example is repackag-
ing (Zhou and Jiang, 2012): the attacker decompiles
a trusted application to get the source code, then adds
the malicious payload and recompiles the application
with the payload to make it available on various mar-
ket alternatives, and sometimes also on the official
market. The user is often encouraged to download
such malicious applications because they are free ver-
sions of trusted applications sold on the official mar-
ket.
Signature-based malware detection, which is the
most common technique adopted by commercial an-
timalware for mobile, is often ineffective. Moreover it
is costly, as the process for obtaining and classifying a
malware signature is laborious and time-consuming.
There is another problem affecting the ability to
detect malware on Android platform. Antivirus soft-
ware on desktop operating system has the possibility
of monitoring the file system operations. In this way,
it is possible to check whether some applications as-
sume a suspicious behavior; for example, if an ap-
plication starts to download malicious code, it will be
detected immediately by the anti-virus responsible for
scanning the disk drive.
Android does not allow for an application to mon-
itor the file system: any application can only access
its own disk space. Resource sharing is allowed only
if expressly provided by the developer of the applica-
tion.
27
Canfora G., Mercaldo F. and Aaron Visaggio C..
Mobile Malware Detection using Op-code Frequency Histograms.
DOI: 10.5220/0005537800270038
In Proceedings of the 12th International Conference on Security and Cryptography (SECRYPT-2015), pages 27-38
ISBN: 978-989-758-117-5
Copyright
c
2015 SCITEPRESS (Science and Technology Publications, Lda.)

Therefore antivirus software on Android cannot
monitor the file system: this allows applications to
download updates and run new code without any con-
trol by the operating system. This behavior will not be
detected by antivirus software in any way; as a matter
of fact, a series of attacks are based on this principle
(this kind of malware is also known as ‘downloader’).
This paper proposes a technique for malware de-
tection, which uses a features vector, in place of the
code signature. The assumption (that will be demon-
strated with the evaluation) is that malicious applica-
tions show values for this features vector which are
different from the values shown by trusted applica-
tions.
The vector includes eight features obtained by
counting some Dalvik op-codes of the instructions
which form the smali code (smali, 2014) of the appli-
cation. Specifically, we analyze some op-codes which
are usually used to change the application’s control
flow, as these op-codes can be indicators of the ap-
plication’s complexity. The underlying assumption is
that the business logic of a trusted application tend to
be more complex than the malware logic, because the
trusted application code must implement a certain set
of functions. On the contrary, the malware applica-
tion is required to implement just the functions that
activate the payload.
An approach commonly used for generating com-
puter malware, consists of decomposing the control
flow in smaller procedures to be called in a certain
order, instead of following the original flow (Attaluri
et al., 2008; Baysa et al., 2013). This technique is
called ‘fragmentation’, and is intended to circumvent
signature based antivirus or those kinds of antivirus
which attempt to analyze the control flow for detect-
ing malware.
The first six features aim at characterizing the
fragmentation of the control flow, and compute, re-
spectively, the number of the ‘move’, the ‘jump’, the
‘packed-switch’, the ‘sparse- switch’, the ‘invoke’
and the ‘if’ op-codes, singly taken, divided by the
overall sum of the occurrences of all these six Dalvik
op-codes.
The last two features are based on another as-
sumption. The classes of a trusted application tend
to exhibit an intrinsic variability, because each class
is designed to implement a specific part of the busi-
ness logic of the overall application. Such a variabil-
ity should be reflected in the distribution of the op-
codes, so the same op-code should occur with differ-
ent frequencies in different classes. Conversely, as the
malware has not an articulated business logic except
for the malicious payload, this difference among its
classes tend to be less evident than in trusted appli-
cations. For evaluating such a difference in op-codes
distribution among the different classes forming the
final application we use two features, which are two
variants of the Minkowski distance (Rad and Masrom,
2010): the first one is represented by the Manhattan
distance, the second one by the Euclidean distance.
All the features are used to build a classifier which is
then used to discriminate an Android malware from
a trusted Android application. An advantage of using
a classifier, removes the need to continuously collect
malware signatures. However, this requires a sample
of malware and a sample of trusted applications for
training the classifier. Of course, the training can be
run with new samples after a certain period of usage,
in order to improve the accuracy and make the classi-
fier robust with respect to the new families of malware
that arise over time.
The paper poses two research questions:
• RQ1: are the features extracted able to distinguish
a malware from a trusted application for Android
platform?
• RQ2: is a combination of the features more effec-
tive than a single feature to distinguish an Android
malware from a trusted application?
The main contribution of this paper can be re-
sumed in the following points:
• we provide a set of features that have been never
applied to the detection of Android malware;
• the set of features consists of occurrence fre-
quency of some specific op-codes, so the extrac-
tion of such features is easy to reproduce and does
not require a great use of resources;
• we discuss extensive experimentation that shows
how our detection technique is very effective in
terms of precision and recall, especially if com-
pared with the antagonist methods presented in
the literature.
The rest of the paper is organized as follows: the
next section provides an overview of related work; the
following section illustrates the proposed features and
the detection technique; the fourth section discusses
the experimentation, and, finally, conclusion and fu-
ture works are given in the last section.
2 RELATED WORK
Several works address the problem of features extrac-
tion using dynamic and static analysis.
Counting op-codes is a technique used in previ-
ous works for the detection of virus: it revealed to
SECRYPT2015-InternationalConferenceonSecurityandCryptography
28

be successful with several variants of the W32.Evol
metamorphic virus (Choucane and Lakhotia, 2006).
Bilar (Bilar, 2007) proposes a detection mech-
anism for malicious code through statistical analy-
sis of op-codes distributions. This work compares
the statistical op-codes frequency between malware
and trusted samples, concluding that malware opcode
frequency distribution seems to deviate significantly
from trusted applications. We accomplish a simi-
lar analysis, but for Android malware. In reference
(Rad and Masrom, 2010; Rad et al., 2012) the his-
tograms of op-codes are used as a feature to find
whether a file is a morphed version of another. Us-
ing a threshold of 0.067 authors in reference (Rad and
Masrom, 2010) correctly classify different obfuscated
versions of metamorphic viruses; while in reference
(Rad et al., 2012) the authors obtain a 100% detec-
tion rate using a dataset of 40 malware instances of
NGCVK family, 40 benign files and 20 samples clas-
sified by authors as other virus files.
In the literature there are a number of solutions
for the detection of malicious behaviors which do not
exploit op-codes occurrences.
A number of papers deals with privacy leakage,
such as Pios (Chandra and Franz, 2007), Androi-
dLeaks (Gibler et al., 2012) and TaintDroid (Enck
et al., 2010).
The purpose of TaintDroid (Enck et al., 2010) is to
track the flow of privacy sensitive data, and monitor
how the applications access and manipulate users per-
sonal data, in order to detect when sensitive data leave
the system through untrusted applications. Authors
monitor 30 third-party Android applications, found-
ing 68 potential misuses of private information on 20
applications.
PiOS (Chandra and Franz, 2007) and Androi-
dLeaks (Gibler et al., 2012) perform static analysis
for detecting privacy leaks in smartphones. The aim
is to detect when sensitive information is collected by
applications with malicious intents.
Canfora et al. (Canfora et al., 2013) propose a
method for detecting mobile malware based on three
metrics, which evaluate: the occurrences of a specific
subset of system calls, a weighted sum of a subset
of permissions that the application requires, and a set
of combinations of permissions. They obtain a pre-
cision of 0.74 using a balanced dataset composed by
200 trusted and 200 real malware applications.
Sahs et al. (Sahs and Khan, 2012) use a control
flow graph to detect Android Malware; their work
is based on AndroGuard (Androguard, 2014), a tool
useful to extract a series of features from mobile ap-
plications in order to train a One-Class Support Vec-
tor Machine. They validate the proposed method on
2,081 benign and 91 malicious application, conclud-
ing that the trusted sample size combined with a fixed
malicious sample size causes precision to decrease as
the benign sample increases.
Desnos (Desnos, 2012) presents an algorithm to
detect an infected Android application using similar-
ity distance between two applications. The similar-
ity distance seems to be an useful index to determine
whether a version of an application has potentially
been pirated.
Mobile Application Security Triage (MAST)
(Chakradeo et al., 2013) ranks the maliciousness of
apks by using a set of attributes, like intent filters
and native code. MAST uses Multiple Correspon-
dence Analysis to measure the correlation between
declared indicators of functionality required to be
present in the packages of the analyzed applications.
Conversely, in this paper we focus on a set of op-
codes.
CopperDroid (Reina et al., 2013) recognizes An-
droid malware through a system call analysis: the so-
lution is based on the observation that such behaviors
are however achieved through the system calls invo-
cation, using a customized version of the Android em-
ulator to enable system call tracking and support sys-
tem call analyses.
Wu et al. (Wu et al., 2012) propose a static
feature-based mechanism that considers the permis-
sion, the deployment of components, the intent mes-
sages passing and API calls for characterizing the
Android applications behavior. Zheng et al.(Zheng
et al., 2013) propose a signature based analytic sys-
tem to automatically collect, manage, analyze and ex-
tract Android malware. Arp et al. (Arp et al.,
2014) propose a method to perform a static analysis
of Android applications based on features extracted
from the manifest file and from the disassembled code
(suspicious API calls, network addresses and other).
Their approach uses Support Vector Machines to pro-
duce a detection model, and extracts a set of features
which is different from the one presented in this paper.
Their dataset is composed by 5,560 malware applica-
tions and 123,453 trusted one obtaining a detection
rate equal to 93.9%.
As emerges from this discussion and at the best
knowledge of the authors, the set of features consid-
ered in this paper was never used in any of the works
on Android malware in literature.
3 THE PROPOSED FEATURES
We classify malware using a set of features which
count the occurrences of a specific group of op-codes
MobileMalwareDetectionusingOp-codeFrequencyHistograms
29
extracted from the smali Dalvik code of the applica-
tion under analysis (AUA in the remaining of the pa-
per). Smali is a language that represents disassembled
code for the Dalvik Virtual Machine (dalvik, 2014), a
virtual machine optimized for the hardware of mobile
devices.
We produce the histograms of a set of op-codes
occurring in the AUA: each histogram dimension rep-
resents the number of times the op-code correspond-
ing to that dimension appears in the code. The col-
lected op-codes have been chosen because they are
representative of the alteration of the control flow.
The underlying assumption is that a trusted applica-
tion tend to have a greater complexity than a mali-
cious one. We consider 6 op-codes:
• Move: which moves the content of one register
into another one.
• Jump: which deviates the control flow to a new
instruction based on the value in a specific regis-
ter.
• Packed-Switch: which represents a switch state-
ment. The instruction uses an index table.
• Sparse-Switch: which implements a switch state-
ment with sparse case table, the difference with
the previous switch is that it uses a lookup table.
• Invoke: which is used to invoke a method, it may
accept one or more parameters.
• If: which is a Jump conditioned by the verification
of a truth predicate.
In order to compute the set of features, we fol-
low two steps. The first step consists of preprocess-
ing the AUA: we prepare the input data in form of
histograms. It is worth observing that the histogram
dissimilarity has been already applied with success in
malware detection in (Rad and Masrom, 2010; Rad
et al., 2012).
At the end of this step, we have a series of his-
tograms, a histogram for each class of the AUA; each
histogram has six dimensions, each dimension corre-
sponds to one among the six op-codes included in the
model. In the second step, we compute two forms of
the Minkowski distances.
In the preprocessing step, we disassemble the ex-
ecutable files using APKTool (apktool, 2014), a tool
for reverse engineering Android apps, and generating
Dalvik source code files. After this, we create a set
of histograms that represent the frequencies of the six
op-codes within each class.
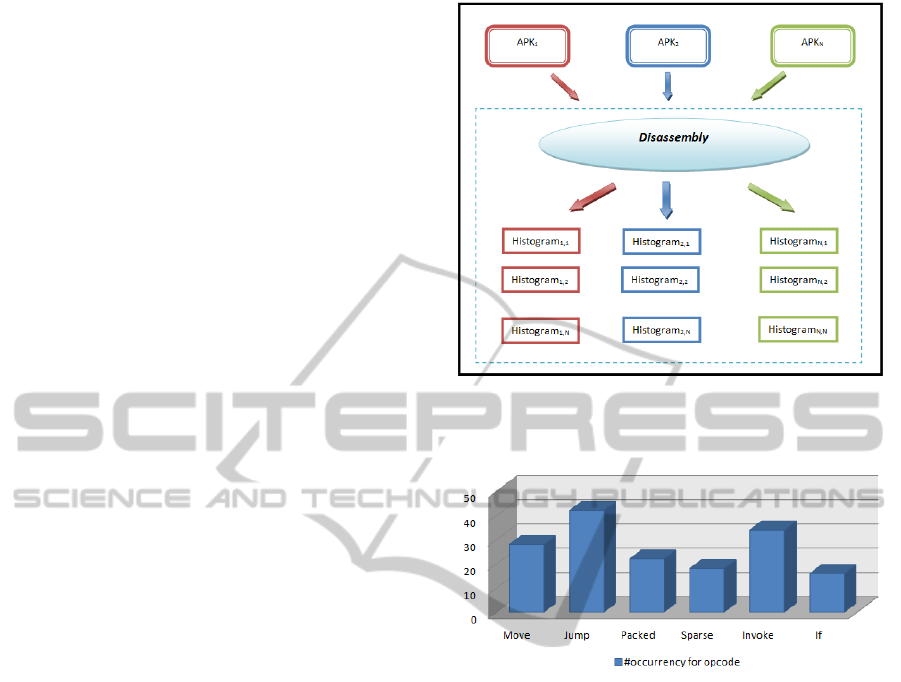
Fig. 1 shows the process of program disassembly
and the corresponding breakdown into histograms.
Fig 2 represents an example of a class histogram.
Figure 1: A graphical representation of AUA analysis’ step
1, which consists of the AUA disassembly and histograms
generation.
Figure 2: An example of a histogram generated from the
n-th class of the j-th AUA obtained with the processing of
the step 1.
The second step comprises the computation of the
distances between the various histograms obtained
with the step 1.
The first six features are computed as follows; let
X be one of the following values:
• M
i
: the number of occurrences of the ‘move’ op-
code in the i-th class of the application;
• J
i
: the number of occurrences of the ‘jump’ op-
code in the i-th class of the application;
• P
i
: the number of occurrences of the ‘packed-
switch’ op-code in the i-th class of the application;
• S
i
: the number of occurrences of the ‘sparse-
switch’ op-code in the i-th class of the application;
• K
i
: the number of occurrences of the ‘invoke’ op-
code in the i-th class of the application;
• I
i
: the number of occurrences of the ‘if’ op-code
in the i-th class of the application.
Then:
SECRYPT2015-InternationalConferenceonSecurityandCryptography
30

#X =
∑
N
k=1
X
i
∑
N
k=1
(M
i
+J
i
+P
i
+S
i
+K
i
+I
i
)
where X is the occurrence of one of the six op-
codes extracted and N is the total number of the
classes forming the AUA.
Before explaining the last two features, it will be
useful to recall the Minkowski distance.
Let’s consider two vectors of size n,
X = (x
i
, x
2
, ..., x
n
) and Y = (y
i
, y
2
, ..., y
n
), then
the Minkowski distance between two vectors X and
Y is:
d
r
X,Y
=
∑
N
k=1
|x
i
− y
i
|
r
One of the most popular histogram distance
measurements is the Euclidean distance. It is a
Minkowski distance with r = 2:
d
E
X,Y
=
q
∑
N
k=1
(x
i
− y
i
)
2
Another popular histogram distance measurement
is Manhattan distance. Even the Manhattan distance
is a form of the Minkowski distance, in this case r = 1:
d
M
X,Y
=
∑
N
k=1
|x
i
− y
i
|
The last two features are Manhattan and Euclidean
distance, computed with a process of three steps.
Given an AUA containing N classes, the AUA will
have N histograms, one for each class, where each
histograms H
i
will be a vector of six values, each one
corresponding to an op-code of the model (‘move’,
‘jump’, ‘packed-switch’, ‘sparse-switch’, ‘invoke’,
‘if’).
As an example, we will show an application of the
model to a simplified case, in which the model has
only three classes and two op-codes. Let’s assume
that the AUA’s histograms are H
1
= {4,2}, H
2
={2,1},
H
3
={5,9}.
• Step1: the Minkowski distance is computed
among each pair H
i
, H
j
with i6=j and 1≤i,j≤N.
In the example we will have d
1,2
=3; d
1,3
=2;
d
2,3
=11.We do not compute d
2,1
, d
3,1
and d
3,2
be-
cause Minkowski distance is symmetric, i.e. d
i, j
=
d
j,i
for 1≤i,j≤N. For simplicity we consider only
the Manhattan distance in the example;
• Step 2: the vector with all the distances is com-
puted for each AUA, D= {d
i, j
— i6=j and 1≤i≤
N, 2≤j≤ N}. Each dimension of the vector cor-
responds to a class of the AUA. In the example D
={3, 2, 11}.
• Step 3: the max element in the vector is extracted,
which is M
AUA
= MAX (D[i]). In the example
M
AUA
is 11.
Finally the last two features are the values M
AUA
com-
puted, respectively, with Manhattan and Euclidean
distance. Thus, M
AUA
is a measure of dissimilarity
among the classes of the AUA.
4 EVALUATION: STUDY DESIGN
We designed an experiment in order to evaluate the
effectiveness of the proposed technique, expressed
through the research questions RQ1 and RQ2, stated
in the introduction.
More specifically, the experiment is aimed at ver-
ifying whether the eight features are able to classify a
mobile application as trusted or malicious. The clas-
sification is carried out by using a classifier built with
the eight features discussed in the previous section.
The evaluation consists of three stages: (i) a compari-
son of descriptive statistics of the populations of pro-
grams; (ii) hypotheses testing, to verify if the eight
features have different distributions for the popula-
tions of malware and trusted applications; and (iii)
a classification analysis aimed at assessing whether
the features are able to correctly classify malware and
trusted applications. The classification analysis was
accomplished with Weka, a suite of machine learn-
ing software (weka 3, 2014), largely employed in data
mining for scientific research.
The dataset was made by 5,560 Android trusted
applications and 5,560 Android malware applica-
tions: trusted applications of different categories (call
& contacts, education, entertainment, GPS & travel,
internet, lifestyle, news & weather, productivity, util-
ities, business, communication, email & SMS, fun &
games, health & fitness, live wallpapers, personaliza-
tion) were downloaded from Google Play (Google-
Play, 2014), while the malware applications belong to
the collection of the Drebin project (Arp et al., 2014;
Spreitzenbarth et al., 2013). The Drebin project is a
dataset that gathers the majority of existing Android
malware families. The dataset includes different types
of malware categorized by installation methods and
activation mechanisms, as well as the nature of carried
malicious payloads, in particular the dataset includes
179 Android malware families.
With regards to the hypotheses testing, the null hy-
pothesis to be tested is:
H
0
: ‘malware and trusted applications have simi-
lar values of the features’.
The null hypothesis was tested with Mann-
Whitney (with the p-level fixed to 0.05) and with
Kolmogorov-Smirnov Test (with the p-level fixed to
MobileMalwareDetectionusingOp-codeFrequencyHistograms
31

0.05). We chose to run two different tests in order to
enforce the conclusion validity.
The purpose of these tests is to determine the level
of significance, i.e. the risk (the probability) that er-
roneous conclusions be drawn: in our case, we set the
significance level equal to .05, which means that we
accept to make mistakes 5 times out of 100.
The classification analysis was aimed at assessing
whether the features where able to correctly classify
malware and trusted applications.
Six algorithms of classification were used: J48,
LadTree, NBTree, RandomForest, RandomTree and
RepTree. These algorithms were applied separately
to the eight features and to three groups of features.
The first group includes the move and the jump
features, the second group includes the two distances,
and the third group includes all the four features
(move, jump, Manhattan and Euclidean features).
The features grouping is driven by the goal to obtain
the best results in classification, as discussed later in
the paper.
5 EVALUATION: ANALYSIS OF
DATA
For the sake of clarity, the results of our evaluation
will be discussed reflecting the data analysis’ division
in three phases: descriptive statistics, hypotheses test-
ing and classification.
5.1 Descriptive Statistics
The analysis of box plots (shown in figure 3) related
to the eight features helps to identify the features
more effective to discriminate malware from trusted
applications. The differences between the box plots
of malware and trusted applications for the ‘move’
and ‘jump’ features suggest that the two populations
could belong to different distributions. A huge part
of the trusted sample (between the second and the
third quartile) has values greater than the 75% of the
malware sample for this couple of features. The rea-
son may reside, as conjectured in the introduction, in
the fact that in trusted applications these op-codes are
used for implementing a certain business logic (whose
complexity may vary a lot), while in the malware they
can be only employed basically for code fragmenta-
tion.
This hypothesis will be confirmed by the hypoth-
esis testing, as discussed later.
The distributions of ‘sparse-switch’ and ‘packed-
switch’ op-codes seem to show a difference in the two
samples, too, which is more relevant for the ‘sparse-
switch’ box plots. This evidence strengthens the start-
ing assumption of the paper, that will be confirmed
by the results of the hypotheses testing. Switch con-
structs are frequently used for implementing the busi-
ness logic of remote control (command and control
malware are very widespread) of a victim device, or
the selection cretira for activating the payload.
Instead, the box plots related to the features ‘in-
voke’ and ‘if’ do not produce significant differences
between malware and trusted samples.
Finally, the differences between the box plots of
trusted applications and malware for the Manhat-
tan and the Euclidean distance are much more pro-
nounced than the previous cases, suggesting that the
two populations could belong to different distribu-
tions. It is interesting to observe how in both the cases
the third percentile of the malware sample is lower
than the first percentile of the trusted sample.
The very tight box plots of the distances for mal-
ware, especially the one associated to the Manhattan
distance, confirm the assumption that malware code
has a lower variability (in terms of business logic)
than trusted applications.
Remark 1: From descriptive statistics we find out
that trusted applications boxplots (for ‘move’ and
‘jump’ opcodes, and for the two distances) range in
a wider interval than the malware ones. This may
reveal the fact that malware applications implement
little business logic with respect to the trusted ones,
and identifies these four features as good candidates
for the classification phase. This result will be con-
firmed by the hypotheses testing and by the classifi-
cation analysis.
5.2 Hypothesis Testing
The hypothesis testing aims at evaluating if the fea-
tures present different distributions for the popula-
tions of malware and trusted applications with statis-
tical evidence.
We assume valid the results when the null hypoth-
esis is rejected by both the tests performed.
Table 1 shows the results of hypothesis testing: the
null hypothesis H
0
can be rejected for all the eight fea-
tures. This means that there is statistical evidence that
the vector of features is a potential candidate for cor-
rectly classifying malware and trusted applications.
This result will provide an evaluation of the risk to
generalize the fact that the selected features produce
values which belong to two different distributions (i.e.
the one of malware and the trusted one): those fea-
tures can distinguish those observations. With the
classification analysis we will be able to establish the
SECRYPT2015-InternationalConferenceonSecurityandCryptography
32
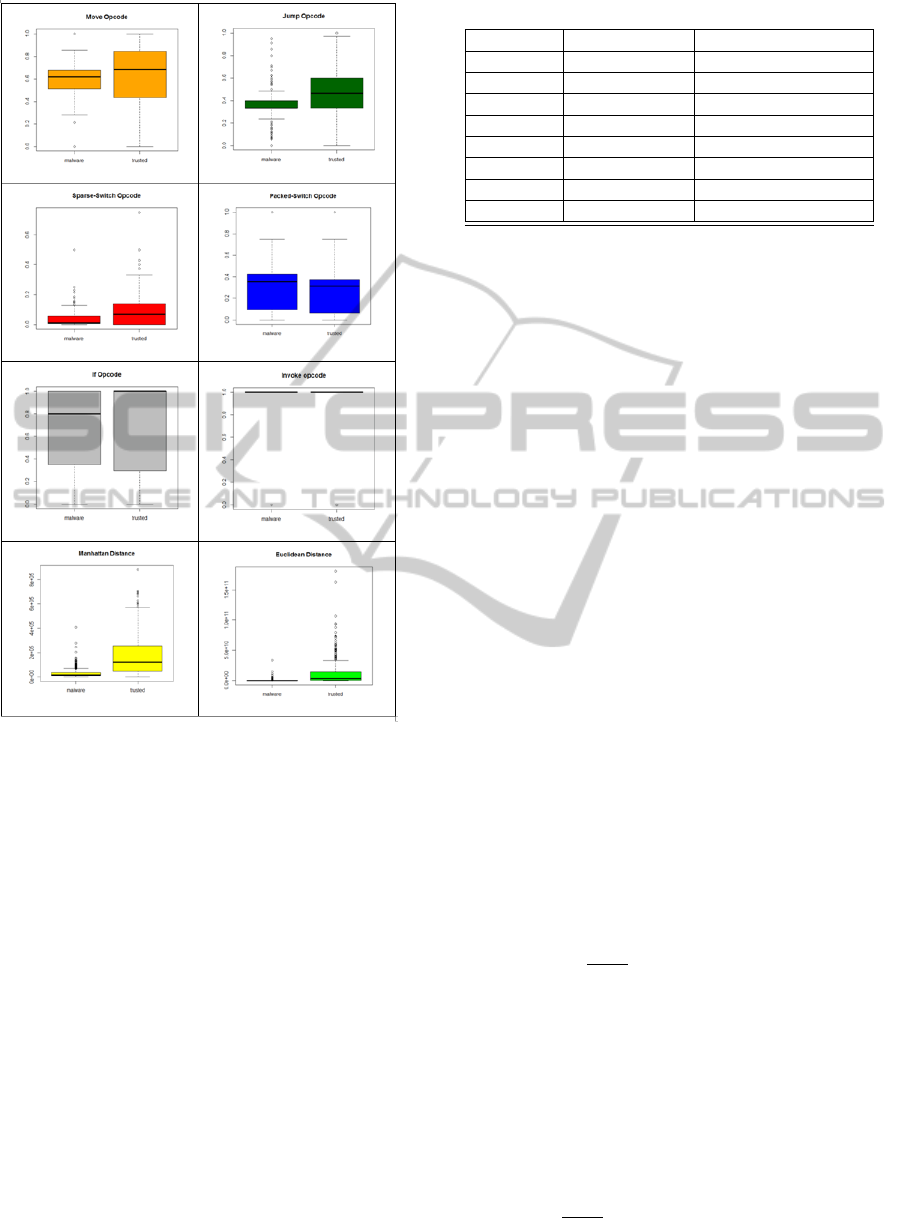
Figure 3: Box plots for the features extracted.
accuracy of the features in associating any applica-
tions to a sample, malware or trusted.
Remark 2: the malware and trusted samples (pro-
duced with all the eight features) show a statistically
significant difference by running both the tests.
5.3 Classification Analysis
The classification analysis consisted of building a
classifier, and evaluating its accuracy. For training the
classifier, we defined T as a set of labelled mobile ap-
plications (AUA, l), where each AUA is associated to
a label l ∈ {trusted, malicious}. For each AUA we
built a feature vector F ∈ R
y
, where y is the num-
ber of the features used in training phase (1≤y≤8).
To answer RQ1, we performed eight different classi-
fications, each one with a single feature (y=1), while
for answering RQ2 we performed three classifications
with y>1 (classifications with a set of features).
For the learning phase, we use a k-fold cross-
Table 1: Results of the test of the null hypothesis H
0
.
Variable Mann-Whitney Kolmogorov-Smirnov
Move 0,000000 p < .001
Jump 0,000000 p < .001
Packed 0,000240 p < .001
Sparse 0,000000 p < .001
If 0,000000 p < .001
Invoke 0,000000 p < .001
Manhattan 0,000000 p < .001
Euclidean 0,000000 p < .001
validation: the dataset is randomly partitioned into k
subsets. A single subset is retained as the validation
dataset for testing the model, while the remaining k-
1 subsets of the original dataset are used as training
data. We repeated the process for k times; each one
of the k subsets has been used once as the validation
dataset. To obtain a single estimate, we computed the
average of the k results from the folds.
We evaluated the effectiveness of the classification
method with the following procedure:
1. build a training set T⊂D;
2. build a testing set T’ = D÷T;
3. run the training phase on T;
4. apply the learned classifier to each element of T’.
We performed a 10-fold cross validation: we re-
peated the four steps 10 times varying the composi-
tion of T (and hence of T’).
The results that we obtained with this procedure
are shown in table 2. Three metrics were used to eval-
uate the classification results: recall, precision and roc
area.
The precision has been computed as the propor-
tion of the examples that truly belong to class X
among all those which were assigned to the class. It
is the ratio of the number of relevant records retrieved
to the total number of irrelevant and relevant records
retrieved:
Precision =
t p
t p+ f p
where tp indicates the number of true positives
and fp indicates the number of false positives.
The recall has been computed as the proportion
of examples that were assigned to class X, among all
the examples that truly belong to the class, i.e. how
much part of the class was captured. It is the ratio of
the number of relevant records retrieved to the total
number of relevant records:
Recall =
t p
t p+ f n
MobileMalwareDetectionusingOp-codeFrequencyHistograms
33
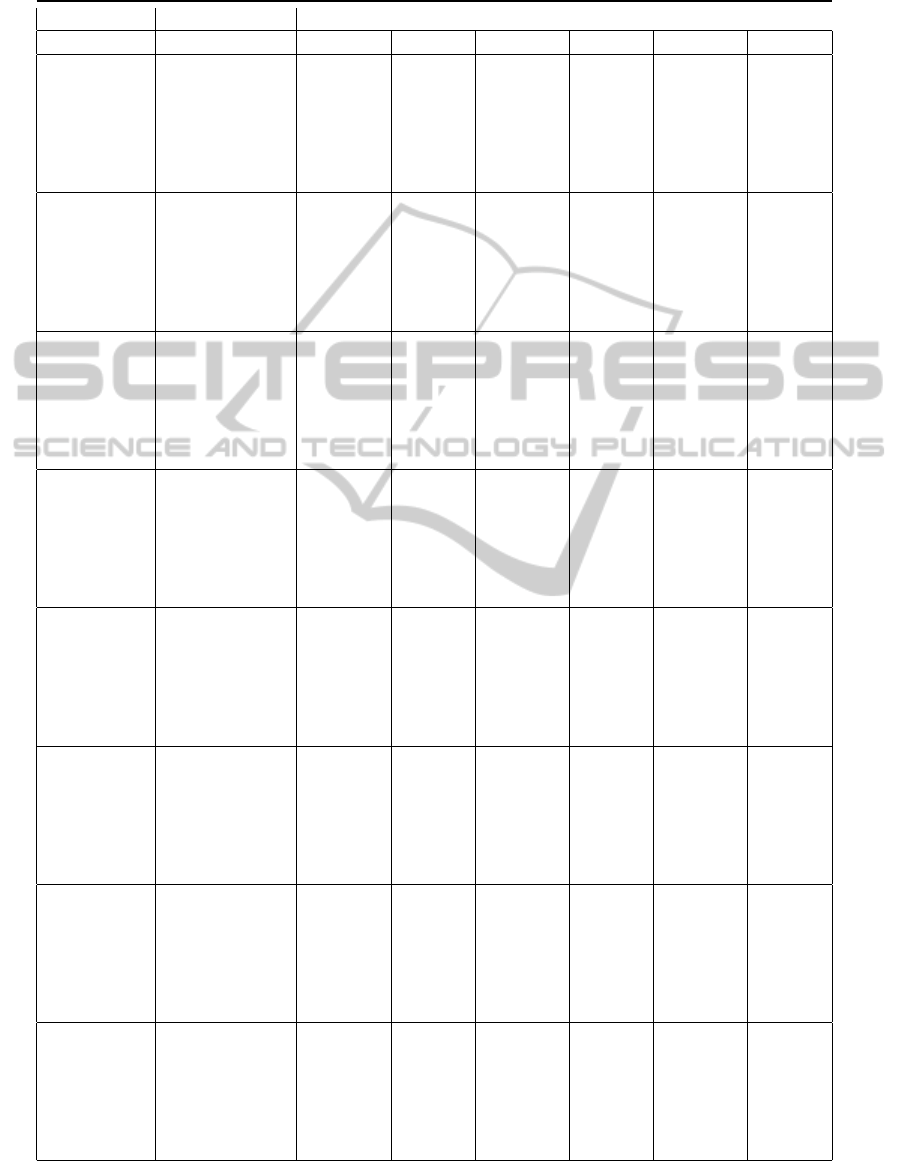
Table 2: Classification Results: Precision, Recall and RocArea for classifying Malware and Trusted applications, computed
with the single features, with the algorithms J48, LadTree, NBTree, RandomForest, RandomTree and RepTree.
Features Algorithm Precision Recall RocArea
Malware Trusted Malware Trusted Malware Trusted
J48 0.905 0.714 0.885 0.757 0.856 0.856
LADTree 0.81 0.714 0.887 0.742 0.858 0.858
move NBTree 0.81 0.713 0.887 0.742 0.859 0.859
RandomForest 0.926 0.69 0.867 0.821 0.802 0.802
RandomTree 0.924 0.695 0.866 0.817 0.88 0.88
RepTree 0.904 0.715 0.886 0.755 0.886 0.886
J48 0.872 0.706 0.896 0.651 0.858 0.858
LADTree 0.866 0.732 0.91 0.626 0.875 0.875
jump NBTree 0.853 0.753 0.925 0.575 0.861 0.861
RandomForest 0.887 0.735 0.903 0.697 0.876 0.876
RandomTree 0.886 0.736 0.904 0.695 0.868 0.868
RepTree 0.885 0.713 0.893 0.695 0.871 0.871
J48 0.765 0.598 0.935 0.227 0.569 0.569
LADTree 0.765 0.598 0.935 0.227 0.569 0.569
invoke NBTree 0.765 0.598 0.935 0.227 0.569 0.569
RandomForest 0.765 0.598 0.935 0.227 0.578 0.578
RandomTree 0.765 0.598 0.935 0.227 0.569 0.569
RepTree 0.765 0.598 0.935 0.227 0.569 0.569
J48 0.67 0.576 0.937 0.201 0.619 0.619
LADTree 0.751 0.512 0.938 0.161 0.715 0.715
packed NBTree 0.732 0.373 0.95 0.059 0.635 0.635
RandomForest 0.768 0.557 0.918 0.254 0.64 0.64
RandomTree 0.759 0.569 0.935 0.201 0.725 0.725
RepTree 0.752 0.531 0.936 0.107 0.697 0.697
J48 0.846 0.731 0.919 0.555 0.747 0.747
LADTree 0.834 0.718 0.92 0.501 0.826 0.826
sparse NBTree 0.828 0.702 0.921 0.489 0.801 0.801
RandomForest 0.831 0.747 0.932 0.493 0.855 0.855
RandomTree 0.824 0.767 0.941 0.462 0.849 0.849
RepTree 0.837 0.723 0.921 0.52 0.836 0.836
J48 0.766 0.6 0.935 0.229 0.621 0.621
LADTree 0.766 0.596 0.934 0.232 0.71 0.71
if NBTree 0.765 0.595 0.926 0.227 0.71 0.71
RandomForest 0.771 0.596 0.928 0.216 0.726 0.726
RandomTree 0.771 0.596 0.928 0.216 0.72 0.72
RepTree 0.768 0.598 0.932 0.241 0.708 0.708
J48 0.856 0.844 0.934 0.575 0.843 0.843
LADTree 0.854 0.848 0.956 0.556 0.868 0.868
Manhattan NBTree 0.838 0.888 0.969 0.5 0.854 0.854
RandomForest 0.885 0.783 0.921 0.686 0.852 0.852
RandomTree 0.889 0.789 0.918 0.7 0.809 0.809
RepTree 0.861 0.842 0.953 0.591 0.849 0.849
J48 0.833 0.934 0.98 0.478 0.71 0.71
LADTree 0.836 0.908 0.974 0.489 0.869 0.869
Euclidean NBTree 0.833 0.934 0.98 0.478 0.854 0.854
RandomForest 0.88 0.771 0.918 0.702 0.854 0.854
RandomTree 0.891 0.765 0.915 0.706 0.811 0.811
RepTree 0.851 0.829 0.951 0.558 0.852 0.852
SECRYPT2015-InternationalConferenceonSecurityandCryptography
34

where fn is the number of false negatives. Preci-
sion and recall are inversely related. The Roc Area is
defined as the probability that a positive instance ran-
domly chosen is classified above a negative randomly
chosen.
The classification analysis suggests several con-
siderations. With regards to the precision:
• All the algorithms are able to effectively clas-
sify both trusted applications and malicious ap-
plications (with the exception of the ‘packed-
switch’ feature that exhibits a value of precision
in the trusted classification lower than 0.5 with the
NBTree classification algorithm).
• The features ‘move’ and ‘jump’ return the best
results for the classification of malware applica-
tions (in particular, the precision of the ‘move’ is
equal to 0.926 with RandomForest classification
algorithm), the features Manhattan distance and
Euclidean distance appear to be the best to clas-
sify trusted applications (in particular precision of
the Euclidean distance for the trusted applications
amounted to 0.934 with J48 and NBTree classifi-
cation algorithms).
• The ‘Invoke’, ‘Packed’, ‘Switch’ and ‘If’ features
are characterized by precision values smaller than
the other features analyzed, but exhibit much bet-
ter results with regard to the classification of mal-
ware, if compared to trusted applications. How-
ever, in any case, these values are lower than the
features ‘move’ and ‘jump’ for detecting malware
and Manhattan and Euclidean distance, for classi-
fying the trusted applications.
With regards to the recall:
• All the algorithms are able to classify effec-
tively malware (with the exception of the ‘packed-
switch’, ‘invoke’ and ‘if’ features that exhibit a
value of recall lower than 0.5 in the trusted classi-
fication).
• The recall presents high values for malware de-
tection (the Euclidean distance allows for a re-
call equal to 0.98 with J48 and NBTree classifi-
cation algorithms), while the trusted applications
detection appears to be weaker if compared to the
malware detection, in fact the maximum recall
value for trusted applications distribution is equal
to 0.821 (corresponding to the ‘move’ feature with
RandomForest algorithm).
• The other features have lower values of recall for
both the distributions.
With regards to the roc area:
• The performances of all the algorithms are pretty
the same for malware and trusted applications.
• The ‘move’ feature presents the maximum rocarea
value equal to 0.892 with RandomForest algo-
rithm.
• The ‘invoke’ feature presents the lowest values of
roc-area.
Relying on this first classification, we selected
those features which had the best performance, in or-
der to investigate if grouping them could increase the
accuracy of the classification obtained with single fea-
tures.
The following three groups of features were iden-
tified: (i) ‘move-jump’, in order to obtain the max-
imum precision value for detecting malware; (ii)
‘Manhattan-Euclidean’, in order to obtain the maxi-
mum precision value in the detection of trusted appli-
cations, and (iii) ‘move-jump-Manhattan-Euclidean’,
in order to combine the characteristics of the two sets
of features previously considered.
The classification accomplished by using these
groups of features confirms our expectations: we
obtained results significantly better than in the case
of the classification with single features, as table 3
shows.
The group of features ‘move-jump’ allows for a
precision equal to 0.939 by performing the classifi-
cation of malware with the J48 algorithm, while the
precision of the classification of trusted applications
is equal to 0.782 using the J48, the RandomForest and
the RandomTree algorithm.
Combining the two features produces an improve-
ment on the detection of malware (0.939), in fact by
using only the ‘move’ the precision is equal to 0.926,
by using the algorithm RandomForest; while the sin-
gle ‘jump’ feature reaches a precision equal to 0.886,
by using the algorithm RandomTree.
The recall is 0.911 in the classification of mal-
ware, when using the algorithm RandomForest and
RandomTree, while for the classification of trusted
applications is 0.853 by using the J48 algorithm.
The maximum value of rocarea is equal to 0.928
by using the algorithm RandomForest.
The group of the features ‘Manhattan-Euclidean’
presents a precision in the detection of malware equal
to 0.912, by using the algorithm RandomForest, while
with regard to the trusted applications a value equal
to 0.935 is obtained by using the algorithms J48 and
NBTree. Combining these two features produces an
improvement for the detection of the trusted applica-
tions: in fact, the precision of the feature ‘Manhattan’
for trusted applications is equal to 0.888 with the al-
gorithm NBTree, for the feature ‘Euclidean’ is equal
to 0.934 with the algorithm J48 and NBTree .
The recall is 0.961 in the classification of malware
using the algorithm J48, while in the trusted applica-
MobileMalwareDetectionusingOp-codeFrequencyHistograms
35
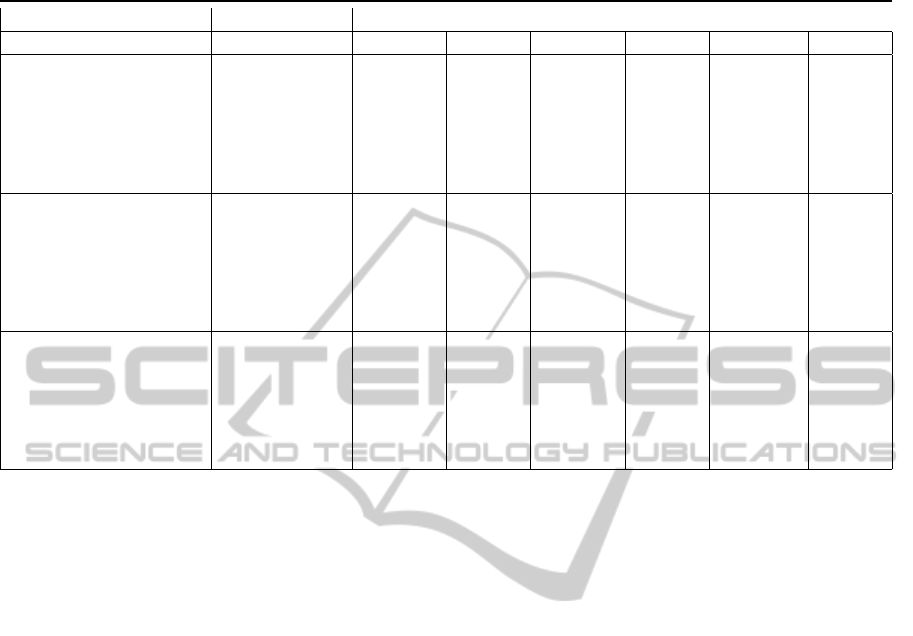
Table 3: Classification Results: Precision, Recall and RocArea for classifying Malware and Trusted applications, computed
with the three groups of features, with the algorithms J48, LadTree, NBTree, RandomForest, RandomTree and RepTree.
Features Algorithm Precision Recall RocArea
Malware Trusted Malware Trusted Malware. Trusted
J48 0.939 0.782 0.909 0.853 0.917 0.917
LADTree 0.8 0.723 0.896 0.708 0.877 0.877
move-jump NBTree 0.912 0.748 0.9 0.775 0.909 0.909
RandomForest 0.931 0.782 0.911 0.828 0.928 0.928
RandomTree 0.929 0.782 0.911 0.824 0.892 0.892
RepTree 0.93 0.748 0.894 0.83 0.916 0.916
J48 0.855 0.935 0.961 0.569 0.841 0.841
LADTree 0.85 0.853 0.958 0.551 0.868 0.868
Manhattan-Euclidean NBTree 0.84 0.935 0.956 0.515 0.855 0.855
RandomForest 0.906 0.83 0.938 0.746 0.897 0.897
RandomTree 0.912 0.807 0.927 0.77 0.849 0.849
RepTree 0.871 0.854 0.954 0.626 0.854 0.854
J48 0.916 0.852 0.945 0.777 0.897 0.897
LADTree 0.885 0.803 0.933 0.682 0.911 0.911
Move-Jump NBTree 0.922 0.738 0.891 0.806 0.925 0.925
Manhattan-Euclidean RandomForest 0.931 0.902 0.971 0.821 0.946 0.946
RandomTree 0.931 0.894 0.958 0.812 0.8 0.8
RepTree 0.997 0.876 0.955 0.746 0.904 0.904
tions detection is equal to 0.77 using the algorithm
RandomTree. The maximum value of rocarea is equal
to 0.897 using the algorithm RandomForest.
The classification of the combination of the four
features leads to optimal results for the detection of
both malware and trusted applications: in fact, the
value of precision for the detection of malware is
equal to 0.931 by using the algorithm RandomFor-
est and 0.902 for the trusted applications, by using
the algorithm RandomForest. The recall is 0.961 us-
ing the algorithm RandomForest in the case of mal-
ware, and 0.821 using the algorithms RandomForest
and RandomTree. The rocArea is maintained equal
for the detection of both trusted applications and mal-
ware, using the algorithm RandomForest. This result
is particularly valuable: tests producing values of RO-
CArea greater than 0.9 are usually considered optimal
in terms of accuracy.
Remark 3: The classification analysis suggets that
the features are effective to detect mobile malware.
The multi-features classification improves the detec-
tion capability, with a very high level of accuracy.
6 CONCLUSIONS AND FUTURE
WORKS
The aim of this work is to understand whether a fea-
tures vector obtained by the counting of some op-
codes occurrences can be used to classify a mobile
application as malware or trusted.
The experiment allowed us to provide the follow-
ing answers to the research questions we posed:
• RQ1: the features extracted are able to discrim-
inate malware from trusted applications. In par-
ticular, the features ‘move’ and ‘jump’ produced
values of precision equal to 0.9 in the identifica-
tion of malware, while the ‘Manhattan’ and ‘Eu-
clidean’ distance revealed to be the best ones for
detecting the trusted applications.
• RQ2: grouping the features may increase preci-
sion and accuracy of classification. In fact the
classification with all the features allows for bene-
fits for both malware and trusted applications clas-
sification, achieving a precision of 0.931 in the
detection of malware and 0.902 in detection of
trusted applications. Additionally, the accuracy
of the tests is equal to 0.95, which is considered
optimal.
Unfortunately code morphing techniques could be
employed in order to alterate op-codes histograms.
This is usually accomplished by adding junk code
which does not alter the behaviour of malware, but
just the distribution of op-codes.
This evasion technique can be contrasted by two
ways: first, by applying methods for finding junk code
within malware, which is part of future work. Second,
by identifying precise patterns and sequences of op-
SECRYPT2015-InternationalConferenceonSecurityandCryptography
36

codes that could be recurrent in malicious malware’s
code. This latter technique could also help to under-
stand which is the family each malware instance be-
longs to, which is a further improvement of interest in
the area of malware detection.
An undeniable advantage of this technique is the
easiness of implementation and the correspondent
lightness in terms of requested resources: basically
the proposed method needs to extract the occurrence
frequency of a set of op-codes. The method can be
straightforward reproduced and this fosters the repli-
cations of our study for confirming the outcomes or
finding possible weakness points.
We can compare our work with (Arp et al., 2014)
and (Peng et al., 2012), as these are the closest works
to ours for technique among the considered related
works. Arp et al. (Arp et al., 2014) obtained a pre-
cision (94%) which is almost identical than the one
obtained with our approach (93.9%), while Peng et
al. (Peng et al., 2012) reported a ROC AREA of 95%,
which coincides with our best ROC AREA (95.6%.)
The best deployment of the proposed classifier is a
client-server architecture, where the classifier resides
in a server and a client app is installed on the user de-
vice and requires the analysis of a certain app to the
server.
The main limitation of the evaluation stands in
the external validity, as we have considered a sam-
ple of applications collected in 2012. Running our
method on newest samples could produce different re-
sults. However, some mitigation factors must be taken
into account for this experimental threat. First, we
have considered a large set of samples, amounting to
11,200 units. This could assure a wide coverage of
many kinds of malware and trusted applications, so
the sample could be considered well representative of
the original population. Additionally, in order to en-
force the validity of the used dataset, we should con-
sider that malware traditionally evolves by improving
existing malware with (a few) new functions, or merg-
ing fragments of existing malware applications.
REFERENCES
Androguard (2014). https://code.google.com/p/androguard/
apktool (2014). https://code.google.com/p/android-apktool/
Arp, D., Spreitzenbarth, M., Hubner, M., Gascon, H., and
Rieck, K. (2014). Drebin: Effective and explain-
able detection of android malware in your pocket. In
NDSS’14, Network and Distributed System Security
Symposium. IEEE.
Attaluri, S., McGhee, S., and Stamp, M. (2008). Profile
hidden markov models and metamorphic virus detec-
tion. Journal of Computer Virology and Hacking Tech-
niques, 5(2):179–192.
Baysa, D., Low, R. M., and Stamp, M. (2013). Structural
entropy and metamorphic malware. Journal of Com-
puter Virology and Hacking Techniques, 9(4):179–
192.
Bilar, D. (2007). Opcodes as predictor for malware. In-
ternational Journal of Electronic Security and Digital
Forensics, Vol. 1, No. 2, pp. 156-168.
Canfora, G., Mercaldo, F., and Visaggio, C. (2013).
A classifier of malicious android applications. In
IWSMA’13, 2nd International Workshop on Security
of Mobile Applications, in conjunction with the In-
ternational Conference on Availability, Reliability and
Security, pp. 607-614. IEEE.
Chakradeo, S., Reaves, B., Traynor, P., and Enck, W.
(2013). Mast: Triage for market-scale mobile mal-
ware analysis. In WISEC’13, 6th ACM Conference on
Security in Wireless and Mobile Networks, pp 13-24.
ACM.
Chandra, D. and Franz, M. (2007). Fine-grained informa-
tion flow analysis and enforcement in a java virtual
machine. In ACSAC’07, 23th Annual Computer Secu-
rity Applications Conference, pp 463-475. IEEE.
Choucane, M. and Lakhotia, A. (2006). Using engine sig-
nature to detect metamorphic malware. In WORM’06,
4th ACM workshop on Recurring malcode, pp.73-78.
ACM.
dalvik (2014). http://pallergabor.uw.hu/androidblog/dalvik
opcodes.html
Desnos, A. (2012). Android: Static analysis using similar-
ity distance. In HICSS’12, 45th Hawaii International
Conference on System Sciences, pp.5394-5403. IEEE.
Enck, W., Gilbert, P., Chun, B., Con, L., Jung, J., McDaniel,
P., and Sheth, A. (2010). Taintdroid: An information-
flow tracking system for realtime privacy monitoring
on smartphones. In OSDI’10, 9th USENIX Symposium
on Operating Systems Design and Implementation.
Fedler, R., Sch
¨
utte, J., and Kulicke, M. (2014). On
the effectiveness of malware protection on an-
droid: An evaluation of android antivirus apps,
http://www.aisec.fraunhofer.de/
Gartner (2014). http://www.gartner.com/newsroom/id/2944819
Gibler, C., Crussell, J., Erickson, J., and Chen, H. (2012).
AndroidLeaks: Automatically Detecting Potential Pri-
vacy Leaks in Android Applications on a Large Scale.
Trust and Trustworthy Computing Lecture Notes in
Computer Science.
GoogleMobile (2014). http://googlemobile.blogspot.it/2012/
02/android-and-security.html
GooglePlay (2014). https://play.google.com/
Marforio, C., Aurelien, F., and Srdjan, C. (2011).
Application collusion attack on the permission-
based security model and its implications for mod-
ern smartphone systems, ftp://ftp.inf.ethz.ch/doc/tech-
reports/7xx/724.pdf
Oberheide, J. and Miller, C. (2012). Dissect-
ing the android bouncer. In SummerCon,
https://jon.oberheide.org/files/summercon12-
bouncer.pdf
MobileMalwareDetectionusingOp-codeFrequencyHistograms
37

Peng, H., Gates, C., Sarma, B., Li, N., Qi, Y., Potharaju, R.,
Nita-Rotaru, C., and Molloy, I. (2012). Using proba-
bilistic generative models for ranking risks of android
apps. In CCS’12, 19th ACM Conference on Computer
and Communications Security, pp. 241-252.
Rad, B., Masrom, M., and Ibrahim, S. (2012). Opcodes his-
togram for classifying metamorphic portable executa-
bles malware. In ICEEE’12, International Conference
on e-Learning and e-Technologies in Education, pp.
209-213.
Rad, B. B. and Masrom, M. (2010). Metamorphic Virus
Variants Classification Using Opcode Frequency His-
togram. Latest Trends on Computers (Volume I).
Reina, A., Fattori, A., and Cavallaro, L. (2013). A sys-
tem call-centric analysis and stimulation technique to
automatically reconstruct android malware behaviors.
In EUROSEC’13, 6th European Workshop on Systems
Security.
Sahs, J. and Khan, L. (2012). A machine learning approach
to android malware detection. In EISIC’12, European
Intelligence and Security Informatics Conference, pp.
141-147.
smali (2014). https://code.google.com/p/smali/
Spreitzenbarth, M., Ectler, F., Schreck, T., Freling, F.,
and Hoffmann, J. (2013). Mobilesandbox: Looking
deeper into android applications. In SAC’13, 28th In-
ternational ACM Symposium on Applied Computing.
weka 3 (2014). In http://www.cs.waikato.ac.nz/ml/weka/
Wu, D., Mao, C., Wei, T., Lee, H., and Wu, K. (2012).
Droidmat: Android malware detection through man-
ifest and api calls tracing. In Asia JCIS’12, 7th Asia
Joint Conference on Information Security, pp. 62-69.
Zheng, M., Sun, M., and Lui, J. (2013). Droid analyt-
ics: A signature based analytic system to collect, ex-
tract, analyze and associate android malware. In Trust-
Com’13, International Conference on Trust, Security
and Privacy in Computing and Communications, pp.
163-171.
Zhou, Y. and Jiang, X. (2012). Dissecting android malware:
Characterization and evolution. In SP’12, IEEE Sym-
posium on Security and Privacy, pp. 95-109.
SECRYPT2015-InternationalConferenceonSecurityandCryptography
38
