
Measurement Framework for Business Process Outsourcing to the Cloud
Mouna Rekik
1,3
, Khouloud Boukadi
1,3
and Hanene Ben-Abdallah
2,3
1
University of Sfax, Sfax, Tunisia
2
King Abdulaziz University, Jeddah, K.S.A.
3
Mir@cl Laboratory, Sfax, Tunisia
Keywords:
Business Process Performance, BPEL, Monitoring, GQM, IT.
Abstract:
Face to the increasingly stringent business competition, small and medium sized enterprises strive to excel
in the marketplace by adopting different strategies and solutions. Outsourcing their business processes to the
Cloud has been among the most widely adopted strategies. Among others, enterprises outsource their related
business process to improve their performance. However, this strategy is not without inconvenience especially
when the decision is taken without being aware about the business process functional and non functional re-
quirements. We focus in this paper on identifying the business process performance enhancement needs so
to be able to identify requirements when outsourcing business process to the Cloud. This papers major con-
tribution is the presentation of a measurement framework for SOA-based business process performance. The
proposed framework allows firstly to identify essential metrics to monitor starting from an abstract business
level. Then, identified metrics are monitored using our Business/Qos (BisQos) listener. The gathered data are
then stored in a database for analysis purpose. The output of the framework specifies whether business process
instances reveal a degradation of their performance caused by business metrics or by Qos metrics, in addition
to the infrastructure properties supporting each web service execution.
1 INTRODUCTION
The number of Small and Medium sized Enterprises
(SMEs) emerging in the competitive markets is in-
creasing considerably. This situation urges enter-
prises to strive for sustaining a good place in such
economic context. Basically, many SMEs are rely-
ing on their business process (BP) to deliver their
goods and services to their clients and to gain added-
value. This reveals the need to define a well de-
signed environment for the execution of the BP giv-
ing them the ability to perform properly and to attain
their predefined goals. Outsourcing business process
to the Cloud is considered as an emergent solution
thanks to the opportunities it offers. Indeed, accord-
ing to the National Institute of standards and technol-
ogy (NIST) (Mell and Grance, 2011), Cloud comput-
ing is a model for enabling convenient, on-demand
network access to a shared pool of configurable com-
puting resources that can be rapidly provisioned and
released with minimal management effort or service
provider interaction. Generally, the outsourcing busi-
ness process decision is taken thanks to opportunities
it may offer such as improve business process perfor-
mance (Yang et al., 2007). Assessing whether Cloud
computing may be an opportune environment for out-
sourcing should be preceded by observing and iden-
tifying functional and non functional requirements in
addition to the improvement needs. This paper focus
is to identify the business process performance en-
hancement needs and more specifically those that can
be fulfilled when adopting Cloud computing as an ex-
ecution environment. Usually, business experts define
their business models. These models are then refined
into executable ones by IT experts and deployed into
process engines. The execution of the business pro-
cess can be made by web service composition follow-
ing the service oriented architecture (SOA) principles
(Josuttis, 2007). To monitor the business process per-
formance, SMEs should be able to depict and monitor
relevant IT/business metrics. In this context, enter-
prises experts should be able to proceed for IT/busi-
ness alignment serving to link between the business
process performance and related influencing IT/busi-
ness metrics. This in turn will help for enhancing the
business facet of business processes and even the IT
systems supporting them. Generally, assessing the
business process performance is based on Key Per-
49
Rekik M., Boukadi K. and Ben-Abdallah ..
Measurement Framework for Business Process Outsourcing to the Cloud.
DOI: 10.5220/0005537900490055
In Proceedings of the 12th International Conference on e-Business (ICE-B-2015), pages 49-55
ISBN: 978-989-758-113-7
Copyright
c
2015 SCITEPRESS (Science and Technology Publications, Lda.)

formance Indicator (KPI) by using Business Activ-
ity Monitoring (BAM) tools providing near-real time
monitoring of business processes (zur Muehlen and
Shapiro, 2010). However, these tools are character-
ized by some shortcomings: they aren’t able to pro-
vide customized data corresponding to specific need
of business processes, reasons behind business pro-
cess performance degradation are not displayed and
finally they can not identify the infrastructure prop-
erties (CPU, Memory, etc) supporting business pro-
cess so to be able to depict requirements of business
process performance enhancement (Wetzstein et al.,
2011). Our main contribution in this paper is the
presentation of the measurement framework assisting
IT/business experts to:
• Depict relevant KPI, Qos and Business metrics
to monitor for sustaining a satisfactory level of
business process performance by using the GQM
paradigm.
• Monitor the depicted business/Qos metrics and
the business process performance by observing
their KPI value.
• Analyze gathered data and distinguish between
Qos and business metrics that influence the busi-
ness process performance degradation. This step
will be helpful in the context of our research, to
help enterprises to identify business process re-
quirements when outsourcing to the cloud. More-
over, the framework allows for the business/IT
alignment as its process starts from a high-level
namely the business process goals, to the low level
referring the properties of infrastructure support-
ing it.
The remainder of this paper is structured as follows.
Section 2 describes the related work. Section 3
presents in detail our proposed measurement frame-
work. In section 4 we illustrate an application case
to present the usefulness of our framework. Section 5
summarizes the work status and highlights its exten-
sions.
2 RELATED WORK
Monitoring the business process performance and
their execution as web service composition is know-
ing an exponential interest. Basically, several works
try to generate and analyze two categories of data re-
lated to business processes such as business and Qos
metrics. Qos are non functional requirements con-
sidered important for the satisfaction of costumers
and their objective function such as response time,
throughput, and availability (Zhang et al., 2009). In
the other side, business metrics are defined by busi-
ness people based on business goals (e.g., comput-
ing process rentability, service reliability) (Wetzstein
et al., 2009) and are the basis for monitoring, con-
trolling, analyzing and improvement of the business
processes execution(Ruijie and Hong, 2010). In this
context, (Grati et al., 2012) and (Comes et al., 2009)
present techniques and solutions to monitor differ-
ent Qos dimensions of web services composing busi-
ness processes. Besides, assessing the continuous im-
provement of business process performance is tackled
by (Delgado et al., 2014) based on executionmeasure-
ment model containing a set of execution measures.
Observing and assessing whether business processes
are attaining their goals is done essentially by moni-
toring their KPI (Pan and Wei, 2012). KPIs are de-
fined by experts over each business process to mea-
sure their performance. They are associated with a
target value as an objective to be attained in an anal-
ysis period. KPIs may be influenced by business
factors named process performance metrics (PPMs)
or/and Qos metrics. Different research works focus
on finding out how to model and monitor PPMs and
KPIs. In this context, (del Ro-Ortega et al., 2010)
presents an ontology to define process performance
metrics and explicitly depict relations between them
and elements of BPMN. Authors in (del Ro-Ortega
et al., 2012) propose templates and ontology based
linguistic pattern to facilitate the task of defining PPM
over business processes. Generally, monitoring busi-
ness processes performance through KPIs is done by
business activity monitoring (BAM) tools. The BAM
allows for the supervision of business processes by
providing near real time information about their sta-
tus. It resorts essentially on dashboards where to
display needed information to accomplish enterprises
objectives. In this context, authors in (Friedenstab
et al., 2012) extends the BPMN with fundamental
concepts of BAM and the way to analyze and dis-
play its value. Although enterprises rely basically
on BAM tools to detect possible degradation of busi-
ness process performance, depicting possible influen-
tial factors on KPI isn’t provided. Overall, the re-
ported researches present solutions to model, mon-
itor and analyze either business or Qos metrics re-
lated to the execution of business processes. In the
best of our knowledge, there is no strategy neither a
complete tool proposed as a measurement framework
allowing: to depict appropriate Qos/business metrics
that may influence the business process performance,
monitor and analyze these metrics to differentiate be-
tween most influencing metrics (business/Qos) and fi-
nally identify the infrastructure properties supporting
the business process execution. These three aspects
ICE-B2015-InternationalConferenceone-Business
50
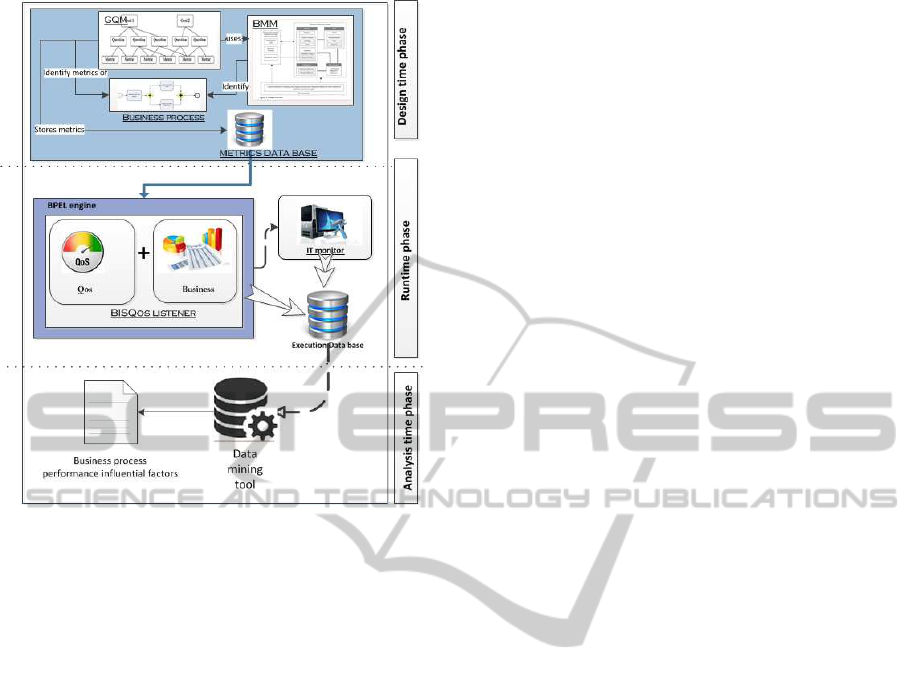
Figure 1: The proposed measurement framework.
allow for defining business process requirements for
performance enhancement when migration to another
executing environment is decided.
3 PROPOSED MEASUREMENT
FRAMEWORK
We proposed a framework based on standards for a
fine and logic IT/business alignment contributing to
a pertinent collaboration between IT and business ex-
perts within enterprises. Next sections present in de-
tail each phase in this framework illustrated in figure
1.
3.1 The Design Time Phase
The first step consists on the depiction of essential
metrics to monitor the business process performance,
namely the KPI in addition to metrics that may in-
fluence its value (business and Qos metrics) which is
accomplished using the GQM approach. The GQM
(Aversano et al., 2004) is an analytic goal-orientedap-
proach starting with a goal, refined then into questions
from which users can identify relevant metrics.
The elaboration of the GQM approach in our
framework passes through three essential steps pre-
sented in table 1. This metric identification step is
elaborated by business experts. The second step de-
fines goal using the depicted KPI. This in turn will
help IT/business experts to identify influential metrics
that may lead to business process performance degra-
dation namely business/Qos metrics. The final step
helps IT experts to define implied IT properties that
may influence KPI values such as CPU, RAM, mem-
ory. We focus in the context of this paper on response
time Qod metric and IT properties that may influence
it.
3.2 The Runtime Phase
We develop a Business/Qos (Bis/Qos) listener for as-
sessing business process performance. It uses as in-
put metrics identified when applying GQM approach.
Our proposed listener accesses to the database where
metrics and formula used to calculate each one of
them are stored. Details about techniques used to
access the database and how to manipulate data are
non mentioned in this paper for space limitation. The
BisQos subscribes to the process engine allowing to
generate different data related to the business process
instances, such as the KPI value and its relative influ-
ential metrics (PPM/Qos). Moreover, more detailed
data may be provided such as the IT properties sup-
porting the business process. The calculator compo-
nent uses the filtered event data on which it applies
formula described on metrics database to calculate
PPM and Qos values. Furthermore, the BisQos lis-
tener calls the IT monitor responsible for gathering
IT properties and characteristic supporting BPEL in-
stances when execution begins, which is in our case
the Nagios monitor tool. The Nagios is an open
source tool commonly used by different projects and
researches (Barth, 2006). Finally, the output of the
execution data is stored in a specified database.
3.3 The Analysis Time Phase
The analysis step of the business/Qos data is based
on data mining methods offered by the WEKA data
mining software (Hall et al., 2009). Principally, the
goal of the data mining is to extract information
from a considerable number of data and transform it
into an understandable structure for further use. We
choose data mining as it enables studying and depict-
ing knowledge from historical business process ex-
ecution. This helps then to identify, based on this
new knowledge, reasons behind business process per-
formance degradation. Different methods are pro-
posed in the data mining. However, we used the de-
cision tree method as it can respond to our needs in
the analysis step (Quinlan, 1986). A decision tree is
a flowchart-like structure in which each node corre-
MeasurementFrameworkforBusinessProcessOutsourcingtotheCloud
51

Table 1: Identifying metrics using GQM.
First step
Team Goal Question Metric
Business enterprise objectives Questions raised to de-
pict metrics to achieve
the objective
Metrics and KPI are de-
picted
Second step
Business enterprise objectives Questions raised to de-
pict metrics to achieve
the objective
Metrics and KPI are de-
picted
Business and
IT
KPI to fulfill the objec-
tive
Questions raised to de-
pict IT and business in-
fluential metrics
Influential metrics of
KPI
Third step
IT IT components affecting
Qos influential metrics
Questions raised to de-
pict implied IT compo-
nents
Implied IT components
sponds to an attribute and each branch corresponds to
a test on this attribute. Finally leaf node corresponds
to the class which is in our case yes/no. Classifica-
tion rules are identified starting from the root to leaf.
Our focus is to identify whether Qos or business met-
rics influence most the KPI violation (business pro-
cess performance degradation). We proceed for the
analysis as follows: We firstly identify classification
rules corresponding to the class yes (KPI violated).
Next, we calculate the number of occurrence of each
type of metric (business/Qos). Whenever Qos met-
rics influence most the KPI violation (number of Qos
metric occurrence is greater), we proceed for the anal-
ysis of IT properties of machines supporting the web
services executions using similarly, the decision tree
method. Solutions to enhance the business facet of
business process performance are not the focus of this
paper as we aim to depict the non functional require-
ments of business process to outsource it to the cloud
computing.
4 APPLICATION CASE
In this section we will present an example to illus-
trate in more details the utilization of our measure-
ment framework.
4.1 Identifying the Enterprise Vision
and Goals
We take as an example a Tunisian enterprise which
sells its products over the Internet. The enterprise
vision is to be the leader in Tunisia for online prod-
uct selling, depicted goals should insure the achieve-
ment of this vision. These long-term (strategic) goals
are SG1 ”Have a good relationship with costumers”,
and SG2 ”Be known in all Tunisia cities”. Objec-
tives quantifies goals by presenting measures and tar-
get values to attain. In the studied business strategies
of the Tunisian enterprise, objectives are OB1 ”In the
end of December 2015, the number of adherents in
the enterprise web site increase to 2000” and the sec-
ond objective is OB2” In the end of 2016, number
of purchase order achieved in time and in full attains
60% against the number corresponding to 2015”. The
second cited objective quantifies the strategic goal
SG1. Experts collaborate to decide about business
processes that follows each strategic goal. This step
allows to restrain the number of business processes to
be monitored in ulterior steps.
We will only focus in this paper, on the business
process ”Purchase Order” (PO) for space limitation.
The PO process follows basically the SG1. Next step
aims to depict essential metrics to monitor based on
the GQM approach.
4.2 Applying the GQM Paradigm
This phase encompasses three essential steps allow-
ing to identify firstly KPI to assess performance of
business processes, then potential influential metrics
and finally implied IT components.
4.2.1 Identifying KPI and Related Metrics
In this phase we aim to extricate for each business
process, the KPI to monitor its performance and its
behavior towards the achievement of its related strate-
gic goal. Table 2 presents the process used to this
purpose. It should be noted that we focus in this pa-
ICE-B2015-InternationalConferenceone-Business
52

per on KPI that can be calculated and derived from
runtime data of executable business processes. Busi-
ness experts are concerned in this phase. In this sec-
tion we will present an excerpt of metrics monitored
by the BisQos tool. In this step, several metrics are
depicted, only essential ones are designed to be the
KPI. In the presented example, the ”order confirma-
tion lead time” is designed by business experts to be
the KPI reflecting the performance of the PO business
process.
4.2.2 Identifying Influential Metrics of the KPI
This step is intended to identify Qos and business
metrics that can deviate the KPI from its target value.
Table 3 presents in detail the process used to identify
influential metrics of the studied KPI. Next step fo-
cus on the IT properties and characteristics influenc-
ing the depicted Qos metrics.
4.2.3 Identifying Implied IT Properties
This phase helps to identify IT properties require-
ments for the enhancement of the business process
performance. The goal is identified from the Qos re-
quirements elicited previously. The excerpt of metrics
extracted when applying the GQM approach should
serve as input for our monitoring tool. Further details
are given in table 4. Next section presents the result
generated by our monitoring tool for the PO business
process.
4.3 Applying the Monitoring Tool for
the ”Purchase order” Business
Process
After identifying the KPI, influencing business and
Qos metrics, in addition to the related IT properties,
our tool monitor this metrics and display results for
experts for ulterior analysis steps. To do so, we con-
sider the simplified business process modeled with
BPMN ((OMG), 2011) presented in figure 2. In the
execution phase, BPMN is mapped to an executable
business process (BPEL process), and then an Apache
ODE is used as BPEL engine. The implemented
BisQos listener access to the repository where pre-
defined metrics are stored. Essentially, the tool gath-
ers the monitoring data from specified repository that
encompasses different relevant data related to: the
target value of KPI and formula necessary to calcu-
late its value, and influential metrics identified using
the GQM. To properly monitor and calculate influ-
ential metrics, we store in addition to their ID, the
allowed range of value and the attachments relating
Table 2: Extraction of KPI relative to PO process.
First step (Business team): Identifying
KPI to monitor and its related metrics
Goal: (OB2) In the end of 2016, number
of purchase order achieved in time and in
full attains 60%.
Question Metric Formula
Q1: What is
the number
of POs of the
current year?
M1: number
of PO
∑
PO
Q2: What
is the per-
centage of
approved
and accorded
orders?
M2.1: num-
ber of Ac-
corded
Orders in
Time (AOT)
M2.2:number
of Total
Orders re-
quests(TO)
∑
PO
TO
Q3: What
is the Order
Confirmation
lead Time
(OCT)?
M3.1: time
stamp (TR)
correspond-
ing to the
reception of
PO request
M3.2 time
stamp (TA)
correspond-
ing of the PO
confirmation
OCT=TA-TR
each BPEL element with its needed events Our devel-
oped listener filters unnecessary metrics from repos-
itory and tackles only metrics identified by GQM as
input for the monitoring tool.
4.4 Analyzing Generated Data
Different decision tree methods are used to generate
pertinent results, namely, J48,CART, ADTree, and
REPTree. Following, we will give an example of
classification rule generated when applying the J48
method on the business/Qos data.
Rule1 : i f ( check shipment
a v a i l a b i l i t y RT > 97)
and
( or der in stock = t ru e )
and
( check warehouse a v a i l a b i l i t y
RT > 101)
and ( check with s u pp l ier
RT >10)
MeasurementFrameworkforBusinessProcessOutsourcingtotheCloud
53
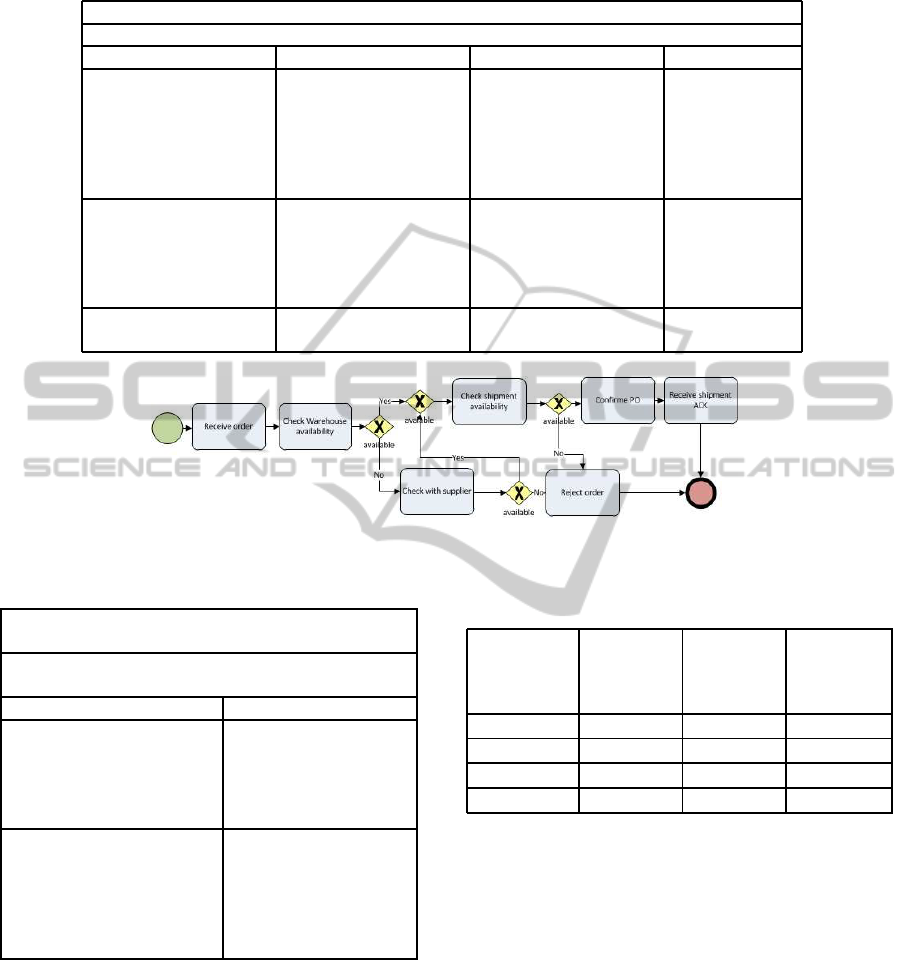
Table 3: Identifying influential metrics.
Second step (Business & IT team): Identifying influential factors of the KPI
Goal: The Duration of the PO process is lower than 3 days.
Question Metric Formula Type
Q1: What is the du-
ration of a web ser-
vice i corresponding
to REC process ?
M1.1: time stamp
TEi relative to the end
of web service i M1.2
time stamp relative to
the start of web ser-
vice TSi
duration=TEi-TSi Qos
Q2: What is the iden-
tity of costumers that
almost all their PO re-
quests lead to a re-
jected response?
M2: identity of cos-
tumers
PPM
Q3: Is the product al-
ways available?
M3: availability of
the product
PPM
Figure 2: The simplified purchase order process.
Table 4: Identifying implied IT components.
Third step (IT team): Identifying implied IT
components
Goal:Ameliorate duration of web services
composing the business process
Question Metric
Q1: What is CPU prop-
erties of server on which
web service i is running
corresponding to a BPEL
process j?
M1: CPU rate of us-
age related to server
supporting web ser-
vice i corresponding
to a BPEL process j
Q2: What is the System
disk properties of server
on which web service i is
running corresponding to
a BPEL process j?
M2: System disk
rate of usage related
to server supporting
web service i corre-
sponding to a BPEL
process j
then v i ola t ed = tru e ;
Table 5 presents the results corresponding to each
applied decision tree method, more specifically, the
decision tree method name, the percentage of cor-
rectly classified instances and the number of occur-
rence of the business/Qos metrics.
When calculating the occurrence of each attribute
(business and Qos), we observe that the number of
Qos metrics is greater then business metric. More
specifically, we can precise which web services Qos
Table 5: Experimental results: the application of decision
tree methods on business/Qos data.
Decision
tree methods
Percentage
of correctly
classified
instances
Number
of Qos
metrics
Number
of PPM
metrics
J48 85,48% 3 1
CART 87,36% 2 0
ADTree 86,26% 4 1
REPTree 86,26% 4 1
influence the most the KPI violation which are in our
case ”check warehouse availability RT” and ”check
shipment availability RT”. To enhance the Qos met-
rics, we go further in the analysis phase by depicting
the IT properties of the violated business instances
generated using the Nagios monitor. Monitored IT
properties in our case are CPU usage, memory usage,
system disk, virtual memory, page file, and total pro-
cesses. We choose to monitor these IT properties as
they are components that influence most the response
time Qos the focus of our paper. Herein an example
of classification rule generated when we apply the J48
method on the IT properties data:
i f ( MemoryUsage1 > 82.5 and
MemoryUsage6> 90)
then v i ola t ed = tr u e ;
ICE-B2015-InternationalConferenceone-Business
54

MemoryUsage1 and MemoryUsage6 refers re-
spectively to the MemoryUsage of the machines sup-
porting respectively the web service ”check ware-
house availability” and ”check shipment availability”.
Regarding the huge number and the variety of com-
pute instances offered by Cloud provider, the gener-
ated classification rule presents a means to limit the
range of choices. Referring to our example, enter-
prises should focus only on finding computing in-
stances providing better memory usage for the exe-
cution of the identified web services
5 CONCLUSION
Monitoring SOA based business processes presents
an interesting means for SMEs to analyze, interpret
and ameliorate the business process performance. De-
spite the evolving number of researches focusing on
that issue, realizing a method for identifying essen-
tial processes to monitor, identifying and monitoring
business and Qos metrics is not tackled in the best of
our knowledge. Thus, the framework presents a perti-
nent solution to assist business/IT experts for achiev-
ing enterprise goals. The tool we presented in this
paper is characterized by its top down aspect. In fact,
it links between business and IT levels helping ex-
perts to depict the relation between eventual KPI vi-
olation and the concerned IT properties. Moreover,
the framework identify the outsourcing to the Cloud
requirements. The presented framework is beneficial
for both IT and business levels for displaying, analyz-
ing and enhancing different business processes data.
We are working on defining an outsourcing algo-
rithm allowing to depict most relevant business pro-
cess parts to outsource and the evaluation the perfor-
mance of business processes executed in the Cloud.
REFERENCES
Barth, W. (2006). Nagios. System and Network Monitoring.
No Starch Press, u.s. ed edition.
Comes, D., Bleul, S., Weise, T., and Geihs, K. (2009). A
flexible approach for business processes monitoring.
In Senivongse, T. and Oliveira, R., editors, Distributed
Applications and Interoperable Systems, volume 5523
of Lecture Notes in Computer Science, pages 116–
128. Springer Berlin Heidelberg.
del Ro-Ortega, A., Resinas, M., and Ruiz-Corts, A. (2010).
Defining process performance indicators: An ontolog-
ical approach. In Meersman, R., Dillon, T., and Her-
rero, P., editors, On the Move to Meaningful Internet
Systems: OTM 2010, volume 6426 of Lecture Notes
in Computer Science, pages 555–572. Springer Berlin
Heidelberg.
del Ro-Ortega, A., Resinas Arias de Reyna, M., Durn Toro,
A., and Ruiz-Corts, A. (2012). Defining process per-
formance indicators by using templates and patterns.
In Barros, A., Gal, A., and Kindler, E., editors, Busi-
ness Process Management, volume 7481 of Lecture
Notes in Computer Science, pages 223–228. Springer
Berlin Heidelberg.
Delgado, A., Weber, B., Ruiz, F., de Guzmn, I. G.-R., and
Piattini, M. (2014). An integrated approach based on
execution measures for the continuous improvement
of business processes realized by services. Informa-
tion and Software Technology, 56(2):134 – 162.
Friedenstab, J., Janiesch, C., Matzner, M., and Muller, O.
(2012). Extending bpmn for business activity moni-
toring. In 2012 45th Hawaii International Conference
on System Science (HICSS), pages 4158–4167.
Grati, R., Boukadi, K., and Ben-Abdallah, H. (2012). A qos
monitoring framework for composite web services in
the cloud. In In The Sixth International Conference on
Advanced Engineering Computing and Applications
in Sciences (Advcomp12).
Hall, M., Frank, E., Holmes, G., Pfahringer, B., Reutemann,
P., and Witten, I. H. (2009). The weka data min-
ing software: An update. SIGKDD Explor. Newsl.,
11(1):10–18.
Josuttis, N. (2007). Soa in Practice: The Art of Distributed
System Design. O’Reilly Media, Inc.
Mell, P. M. and Grance, T. (2011). Sp 800-145. the nist defi-
nition of cloud computing. Technical report, Gaithers-
burg, MD, United States.
(OMG), O. M. G. (2011). Business process model and no-
tation (bpmn) version 2.0. Technical report.
Pan, W. and Wei, H. (2012). Research on key performance
indicator (kpi) of business process. In 2012 Second
International Conference on Business Computing and
Global Informatization (BCGIN), pages 151–154.
Quinlan, J. R. (1986). Induction of decision trees. Mach.
Learn., 1(1):81–106.
Ruijie, L. and Hong, H. (2010). Business process metrics
modeling based on model-driven. In 2010 IEEE In-
ternational Conference on Software Engineering and
Service Sciences (ICSESS), pages 327–330.
Wetzstein, B., Leitner, P., Rosenberg, F., Dustdar, S., and
Leymann, F. (2011). Identifying influential factors of
business process performance using dependency anal-
ysis. Enterprise IS, 5(1):79–98.
Wetzstein, B., Strauch, S., and Leymann, F. (2009). Mea-
suring performance metrics of ws-bpel service com-
positions. International conference on Networking
and Services (ICNS’06), 0:49–56.
Yang, D.-H., Kim, S., Nam, C., and Min, J.-W. (2007).
Developing a decision model for business process
outsourcing. Computers and Operations Research,
34(12):3769 – 3778. Operations Research and Out-
sourcing.
Zhang, J., Nie, W., Panahi, M., Chang, Y., and Lin, K.-J.
(2009). Business process composition with qos op-
timization. In Commerce and Enterprise Computing,
2009. CEC ’09. IEEE Conference on, pages 499–502.
zur Muehlen, M. and Shapiro, R. (2010). Business process
analytics. In Handbook on Business P rocess Manage-
ment 2, pages 137–157. Springer Berlin Heidelberg.
MeasurementFrameworkforBusinessProcessOutsourcingtotheCloud
55
