
Exploring the Role of a Smartphone as a Motion Sensing and Control
Device in the Wireless Networked Control of a Motor Test-bed
Jared A. Frank, Anthony Brill, Jonghyun Bae and Vikram Kapila
Mechanical and Aerospace Engineering, NYU Polytechnic School of Engineering, Brooklyn, NY, 11201, U.S.A.
Keywords:
Attitude Sensing, Motor Control, Networked Control System, Smartphone Sensors, Wireless.
Abstract:
The sensing, computing, and control potential of smartphones remains to be fully explored in automatic control
applications. In this paper, we control the angular position of a motor test-bed using feedback from the
embedded motion sensors of a smartphone while it is mounted to the test-bed. The smartphone hosts an
interactive user interface which students and researchers can use to quickly and easily perform experiments
with the test-bed and collect measurements using their own personal devices. Proportional-plus-derivative
(PD) controllers designed using a sampled-data model of the system are compared for different sampling rates
used on the smartphone. Results from simulations and experiments confirm the feasibility of utilizing mounted
smartphones in the wireless networked control of systems with rotational degrees of freedom.
1 INTRODUCTION
Smartphones are more powerful than ever; embed-
ded sensors, open and programmable architecture,
and support for several communication protocols en-
dow them with the potential to serve as lightwight,
portable, inexpensive platforms for sensing in a wide
array of applications (Lane, 2010). Several mobile
applications have been developed that utilize the em-
bedded sensors of smartphones for real-time monitor-
ing. Some of the most popular of these sensors are the
motion sensors, including accelerometer, gyroscope,
and magnetometer. Algorithms for processing and
integrating data from these sensors yield device atti-
tude measurements accurate enough for clinical use in
measuring the Cobb angle in both kyphoses (Jacquot,
2012) and scoliosis (Shaw, 2012). The motion sen-
sors in smartphones have also been used for position-
ing applications in indoor environments where GPS
signal is weak (Schindhelm et al., 2011) and to en-
courage autonomous navigation for visually impaired
people (Moder et al., 2014). By analyzing accelerom-
eter data, mobile applications can be used for activity
recognition, e.g., to detect when users are walking,
jogging, and ascending or descending stairs (Khan,
2010). The medical applications include use of smart-
phone accelerometer data to analyze gait characteris-
tics (LeMoyne, 2010a), characterize Parkinson’s dis-
ease tremor (LeMoyne, 2010b), and notify emergency
services if a user has fallen (He et al., 2012).
Exploiting the sensing power of smartphones has
led to improvements in feasibility and reductions in
complexity in diverse applications. An artificial pan-
creas system has been developed that uses a smart-
phone to process wireless data from a continuous glu-
cose monitoring (CGM) system worn by patients with
type 1 diabetes (Kovatchev, 2013). Previous imple-
mentations consisted of the CGM and insulin pump
wired to computers, which limited free movement
and outdoor usage. A smartphone implementation
may also yield cost reductions vis-a-vis conventional
hardware. For instance, a system that processes ac-
celerometer data from a smartphone to detect potholes
has been proposed as a substitute for high-cost equip-
ment (Mednis, 2011).
Although the incorporation of smartphones to
monitor and interact with physical systems is now be-
ing investigated (Frank and Kapila, 2014), the poten-
tial role of these devices in the automatic, closed-loop
networked control of systems remains largely unex-
plored. Notable exceptions include the construction
of smartphone-controlled robots and unmanned ve-
hicles. Although traditionally microprocessors on-
board the vehicle are used to execute the robot’s con-
trol algorithms, smartphones contain processors with
multiple cores, real-time operating systems, and suf-
ficient speed and memory to handle large computa-
tional loads (Aroca, 2012). Thus, smartphones have
recently been used as navigation and guidance units
for marine and aerial vehicles (El-Gaaly, 2013; Desai,
328
Frank J., Brill A., Bae J. and Kapila V..
Exploring the Role of a Smartphone as a Motion Sensing and Control Device in the Wireless Networked Control of a Motor Test-bed.
DOI: 10.5220/0005544403280335
In Proceedings of the 12th International Conference on Informatics in Control, Automation and Robotics (ICINCO-2015), pages 328-335
ISBN: 978-989-758-123-6
Copyright
c
2015 SCITEPRESS (Science and Technology Publications, Lda.)
2013). In this role, the smartphone can use embedded
sensors to detect obstacles in the environment, sense
collisions, and estimate the pose of the robot as the
processor computes vehicle velocities.
In this paper, we investigate the use of a smart-
phone as a wireless mountable motion sensing and
control device in the automatic control of a motor test-
bed. This implementation reduces the wiring, cost,
and complexity involved in installing industrial-grade
sensors and enables users to leverage the sensing,
computation, and communication power of their mo-
bile devices to quickly and easily drive simple single
degree-of-freedom systems. Students and researchers
in engineering laboratories can attach their own per-
sonal devices to the test-bed to automatically control
it and collect data. An interactive user interface to
the test-bed on the smartphone screen allows users to
set parameters, such as control gains and set points
for the system, and to save and email themselves the
collected data for post-processing. An overview of
the system is provided, including the motion sens-
ing capability of the smartphone and the design of a
3D-printed mount for attaching the smartphone to the
test-bed. PD controllers, which are to be implemented
on the smartphone, are designed for several different
sampling rates using a sampled-data model of the sys-
tem. The motor’s response to these controllers are ex-
plored in simulations and experiments. Since the ac-
curacy, drift, and calibration of sensor data, as well as
time delays associated with computation and wireless
communication, can significantly impact the stability
and performance of the system, the effects of these
factors are measured and discussed in the context of
the proposed system.
2 SYSTEM DESCRIPTION
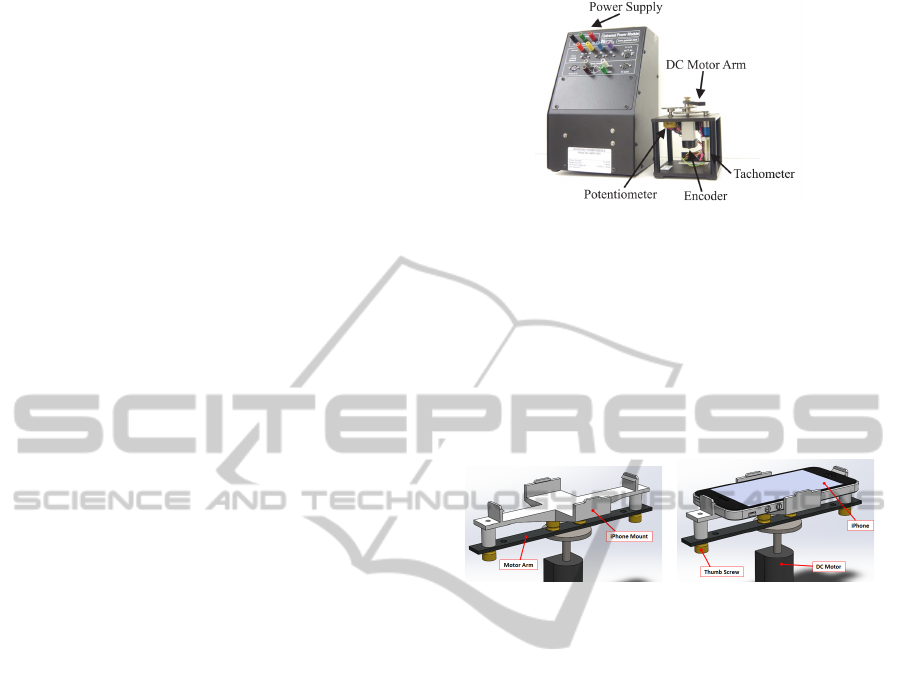
The test-bed used in this study consists of a geared
DC-motor attached to a power amplifier (see Fig-
ure 1). An incremental optical encoder and a multi-
turn potentiometer are available to monitor the motor
orientation and a tachometer is available to measure
its angular rate. A desktop computer equipped with a
PC-based data acquisition and control (DAC) board is
used to transmit control signals to the power amplifier
that drives the motor.
2.1 Mount Design
To secure the smartphone to the test-bed so that ac-
curate orientation data is obtained from the motion
sensors of the smartphone, a mount is designed and
3D-printed using polylactide (PLA) material (see Fig-
Figure 1: The motor test-bed used in this study.
ure 2(a)). Using guidelines and dimensions provided
by the smartphone manufacturer, the mount is de-
signed with four tabs to clip the phone in place and
prevent it from rotating with respect to the motor arm
(see Figure 2(b)). The mount is designed to align the
axis of rotation through the geometric center of the
smartphone. Consideration is taken to not block the
buttons or the screen of the smartphone so that a user
interface may be used to interact with the test-bed.
(a) (b)
Figure 2: Phone mount design (a) without and (b) with an
iPhone 5 secured in between its tabs.
2.2 Embedded Sensing and Calibration
The smartphone used in this study is an Apple iPhone
5, which contains a three-axis accelerometer and gy-
roscope from STMicroelectronics and a magnetome-
ter from AKM Semiconductor. Data from the first
two sensors is used to estimate the attitude of the de-
vice. A single class is used for central access to raw
data from each axis of the motion sensors. Estimates
of device attitude and rotation rate are generated af-
ter processing raw data with sensor fusion algorithms.
Device attitude is expressed in Euler angle form and
defined as the rotation between the device’s current
reference frame and the initial reference frame that is
established when the mobile application (“app”) first
begins collecting motion updates. In this study, the
iPhone is rigidly mounted to the motor arm, which
lies in the horizontal plane. Therefore, only data as-
sociated with the axis normal to the device screen is
needed to estimate the orientation of the motor arm.
To obtain motion data, the app periodically sam-
ples the most recently available measurement at a
specified rate known as the update interval. Choos-
ing an update interval is an important part of the de-
sign of the system since it has a significant impact on
ExploringtheRoleofaSmartphoneasaMotionSensingandControlDeviceintheWirelessNetworkedControlofaMotor
Test-bed
329

the performance of the closed-loop. This interval is
referred to as the sampling rate in the sampled-data
model that characterizes the closed-loop behavior of
the wireless networked control system. With a larger
update interval, the embedded sensors are polled less
often by the app, improving battery consumption.
While 10-20 Hz sampling frequency may be suitable
for many teleoperation tasks, Apple’s event handling
guidelines recommend a range of 30-60 Hz for col-
lecting device orientation data for real-time applica-
tions. Mobile applications developed for iOS support
update frequencies up to 100 Hz for detecting high-
frequency motions, such as impacts and quick shakes.
After performing an experiment involving the collec-
tion of 350 samples, the mean motion data computa-
tion time on the smartphone is determined to be 244.4
microseconds with a standard deviation of 91.168 mi-
croseconds. This gives a 95% confidence interval of
[239.13,258.36] microseconds for the mean, which is
fast enough to support a 100Hz sampling rate.
Calibration of the embedded sensors is performed
using the potentiometer sensor on the test-bed. Ex-
periments are initiated at the orientation in which the
potentiometer outputs zero volts. Therefore, the angu-
lar position readings from the smartphone and the po-
tentiometer are aligned. However, experiments show
that the readings of device attitude drift over time with
respect to readings from the potentiometer (see Sec-
tion 5.1). In future work, the use of the embedded
magnetometers of smartphones will be investigated to
both calibrate the system and improve the accuracy of
readings by correcting against drift.
2.3 Communication
Wireless communication of data between the smart-
phone and the desktop computer is performed using
a traditional client-server architecture, with a server
running on the desktop computer and the client run-
ning on the smartphone app. Data is sent and received
using the TCP/IP protocol over a wireless local area
network, which is maintained by a Wi-Fi router. The
Nagle algorithm, a standard method of improving the
efficiency of the network, is built into the TCP/IP
protocol. This algorithm combines small outgoing
messages that cause a sufficiently large overhead and
sends them all at once in a burst (Nagle, 1995). This
process introduces latency, so the Nagle algorithm is
disabled on both sides of the communication to allow
data to be sent and received in real-time.
To test communication on the wireless network, a
command is issued on the desktop computer to ping
the smartphone and another computer. After send-
ing 100 echo requests with 32 byte packets, the av-
erage round trip times for the smartphone and the
other computer are determined to be 78.11 ms and
30.79 ms, respectively. A paired t-test is conducted
to test whether the two sets come from distributions
with equal means. With a 95% confidence level,
the null hypothesis could be rejected (with t(99) =
2.324, p = 0.022 < 0.05, 95%CI = [6.927,87.713]).
Thus, the communication with the smartphone expe-
riences larger latency than a typical desktop computer
on the same network.
Network latency results in time delays between
data collected by the sensors on the test-bed and the
embedded sensors of the smartphone. These time de-
lays in the closed-loop system can vary significantly,
which can cause degradation in system stability and
performance and complicate analysis and control de-
sign. Several control methodologies have been used
over the last several decades to compensate for such
effects, spanning the use of Smith predictors, opti-
mal stochastic methods, fuzzy logic, and queuing and
buffering. However, with a mean one-way communi-
cation delay of 39.055 ms, average delays in the sys-
tem are only between 0 and 4 sampling periods, de-
pending on the sampling rate used. As will be shown
in Section 5.2, this amount of delay is negligible when
controlling the motor test-bed, whose bandwidth is
sufficiently low.
3 USER INTERFACE DESIGN
Mounting the smartphone to the test-bed can add
portable sensing, computing, and control capability to
the system, as well as provide an interactive user inter-
face attached to the motor arm. Figure 3shows screen-
shots of a mobile app implemented on an iPhone 5
device, allowing users to start and stop experiments
as well as issue reference commands from the smart-
phone touch screen. A connect button on the interface
establishes wireless communication with the compu-
Figure 3: Screenshots of the mobile application’s user in-
terface on an iPhone 5.
ICINCO2015-12thInternationalConferenceonInformaticsinControl,AutomationandRobotics
330

ter, and a text field is used to issue a reference angle
for position control. Sensor data is displayed in real-
time on the screen using text labels. A button to start
and stop the experiment is located in the center of the
screen so that the position of the button is not affected
by the rotation of the device, making it easy for users
to stop the motor in case of an emergency while the
experiment is running.
4 MODELING AND CONTROL
DESIGN
To control the orientation of the motor arm using a
mounted smartphone, the mobile app on the smart-
phone computes the control action u(t) at time t = kT ,
where T is the sampling rate and k = 0,1, 2, . .., af-
ter the angle θ(kT ) and angular rate ω(kT ) have been
sampled. This control computation is done according
to the PD control structure
u[kT ] = K
p
θ[kT ] + K
d
ω[kT ].
To design the proportional and derivative control
gains K
p
and K
d
, respectively, the standard pole-
placement technique is used in discrete-time. First,
the continuous-time model of the plant is obtained.
Next, the model of the plant is discretized to model
the fixed-rate sampling of motion data and control
computation by the smartphone. PD controllers are
designed and compared for several sampling rates.
4.1 Plant Model
The plant, composed of an armature-controlled DC-
motor, gearbox, and load (i.e., the motor arm, mount,
and the smartphone), has a dynamic behavior that
can be captured by a first-order transfer function from
voltage input to the motor V
a
(s) to the angular veloc-
ity of the motor Ω(s)
Ω(s)
V
a
(s)
=
K
τs + 1
,
where K is the steady-state gain and τ is the time-
constant. A unit-step voltage is applied to the plant
to experimentally identify the values of K and τ as
1.5981 Volts and 0.029 seconds, respectively.
4.2 Discretization
The effect of the smartphone in the loop, notably the
discrete-time sampling of data, must be considered
in the control design. A sampled-data model is used
to describe the proposed system in which the smart-
phone performs the sensing and the control computa-
tion for the test-bed. Samplers and zero-order holds
are introduced in the feedback paths and in the feed-
forward path of the closed-loop (see Figure 4). These
samplers represent the sampled attitude and angular
velocity data handled by the smartphone, as well as
the control action computed using the PD control al-
gorithm running on the backend of the mobile app.
Since the control data is transmitted to the host ma-
chine in the same TCP/IP packet as the sensor read-
ings, which are used by the host machine only for data
logging, the three samplers are assumed to share the
same uniform sampling rate T .
In choosing the sampling rate on the smartphone
such that the closed-loop system is stable, it is re-
quired that the sampling rate be sufficiently fast rel-
ative to the dynamics of the plant. A commonly used
rule of thumb in digital control design is to keep the
sampling rate faster than 30 times the closed-loop
bandwidth frequency, ω
b
, which is calculated directly
from values of damping ratio ζ and natural frequency
ω
n
(Kuo, 1980)
ω
b
= ω
n
[(1 − 2ζ
2
) +
q
4ζ
4
− 4ζ
2
+ 2]
1/2
.
To design PD controllers such that the step response
of the closed-loop system exhibits no overshoot and
a settling time T
s
of less than one second, the desired
natural frequency ω
n
and damping ratio ζ are obtained
(Dorf and Bishop, 2007)
ζ = 0.9959, ω
n
= −log(0.02)/(ζ × T
s
) = 3.9282.
Therefore the value of the bandwidth is calculated
to be 2.5429 rad/sec (0.4047 Hz), which means that
the sampling rate used with the smartphone should
be larger than ≈ 12.2 Hz. To compare the system
performance at various sampling rates supported by
the smartphone processor, PD-controllers will be de-
signed using a discretized state-space representation
of the closed-loop system with sampling rates set to
1,5,10,30,60, and 100 Hz. The open-loop trans-
fer function for the plant can be transformed into
a state-space representation in which the state is a
vector of the angular orientation and rate, x(t) ,
θ(t) ω(t)
T
, yielding
˙x = Ax + Bu, y = Cx,
A ,
0 1
0 −
1
τ
, B ,
0
K
τ
, C ,
1 0
.
This state-space representation can be discretized, at
each sampling instant kT , k = 0, 1, 2, . .., as follows
(Kuo, 1980)
x[(k + 1)T ] = φ(T )x[kT ] + γ(T )u[kT ],
y[kT ] = Cx[kT ],
ExploringtheRoleofaSmartphoneasaMotionSensingandControlDeviceintheWirelessNetworkedControlofaMotor
Test-bed
331
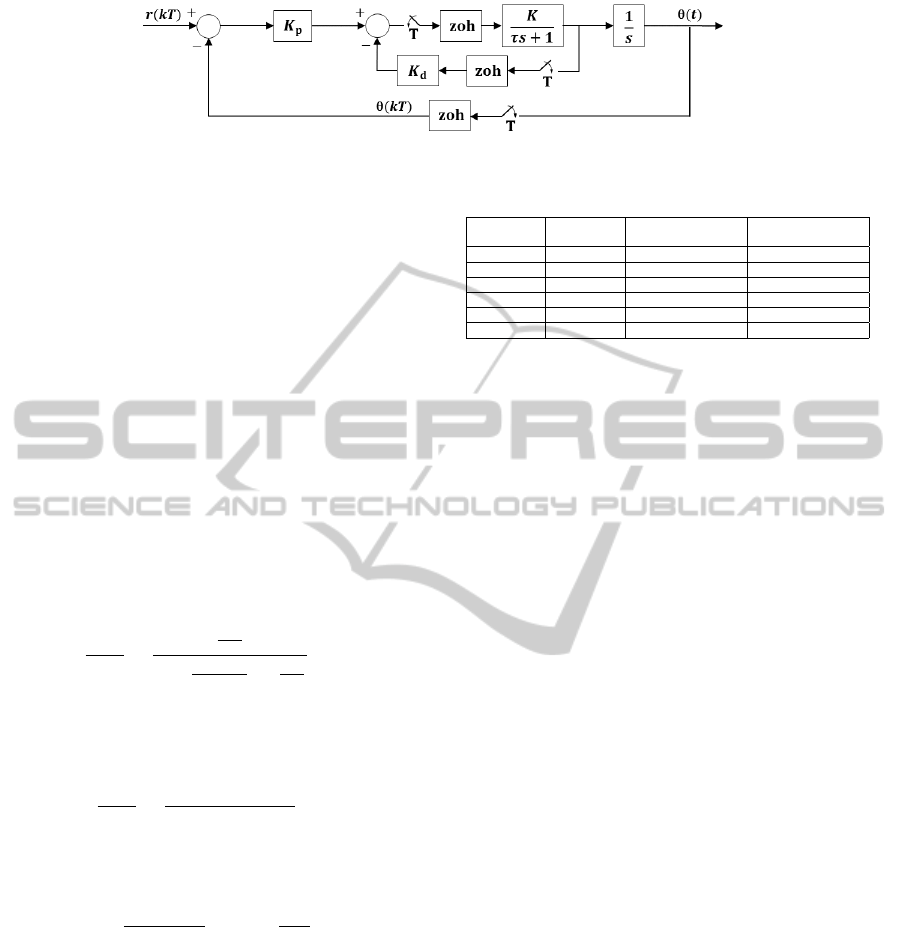
Figure 4: Sampled-data block diagram of the closed-loop system.
where φ(T ) , e
AT
is the state transition matrix of the
state matrix A of the continuous-time state equation
and γ(T ) ,
R
T
0
φ(T − τ)Bdτ. Before designing con-
trollers, the controllability of this second-order sys-
tem is verified by confirming that the 2 × 2 controlla-
bility matrix M
c
=
φ(T ) φ(T )γ(T )
of the sys-
tem has full rank. Indeed, the sampled-data mod-
els are found controllable and since the state vec-
tor contains the angular orientation and rate, the PD
controllers can be designed with the digital full-state
feedback control law u[kT ] = −K
c
x[kT ], where K
c
=
K
p
K
d
T
is the PD-control gain matrix.
4.3 Controller Design
The continuous-time transfer function of the DC-
motor controlled by a continuous-time PD controller
u(t) = k
p
θ(t)+ k
d
ω(t) is
Θ(s)
R(s)
=
Kk
p
τ
s
2
+
(1+Kk
d
)
τ
s +
Kk
p
τ
,
where R(s) and Θ(s) denote the reference command
and angular position output, respectively. The proto-
type second-order transfer function is
Y (s)
U(s)
=
ω
2
n
s
2
+ 2ζω
n
s + ω
2
n
.
Matching coefficients, the nominal expressions for
the control gains are found
k
p
=
2ζω
n
τ − 1
K
, k
d
=
ω
2
n
τ
K
.
Plugging numerical values of K, τ, ζ, and ω
n
gives
k
p
= 0.2800 and k
d
= −0.4838. To design con-
trollers based on discretized models of the plant using
the pole-placement technique, the prototype second-
order system is discretized. Then, the desired charac-
teristic equation is determined in the z-domain from
the discretized state-space matrix A
d
λ(z,A
d
) =
|
zI − A
d
|
.
Using Ackermann’s formula, the controller gain ma-
trix K
c
(T ) for the system discretized at a sampling
rate T can be computed from the controllability ma-
trices M
c
(T ) and the matrix returned by plugging the
Table 1: PD Control Design Parameters.
Sampling
Rate
Open-Loop
Poles
Desired Poles Controller [K
p
,K
d
]
1 Hz 1, 0.0000 0.0187 ± 0.0070ı [0.6025, 0.0172]
5 Hz 1, 0.0010 0.4561 ± 0.0325ı [0.9296, -0.1036]
10 Hz 1, 0.0318 0.6758 ± 0.0241ı [0.6830, -0.2574]
30 Hz 1, 0.3168 0.8777 ± 0.0104ı [0.4141, -0.4099]
60 Hz 1, 0.5629 0.9369 ± 0.0056ı [0.3450, -0.4481]
100 Hz 1, 0.7083 0.9616 ± 0.0034ı [0.3184, -0.4628]
discretized state matrix φ(T ) into the desired charac-
teristic equation (Dorf and Bishop, 2007)
K
c
(T ) = [0 1]M
−1
c
(T )λ(z, φ(T )).
Table 1 shows the open-loop and closed-loop poles, as
well as the controller designed, for each of the sam-
pling rates explored in the study.
5 EXPERIMENTAL RESULTS
5.1 Sensor Noise and Accuracy
Drift errors associated with gyroscope-based orienta-
tion estimates have been observed and documented
over the past decades (Oravetz and Sandberg, 1970).
Commercially available devices have been found to
provide reliable estimates of orientation when used
for periods of up to one minute (Luinge and Veltink,
2005). Fortunately, the proposed system is expected
to be stabilized within a few seconds. To investigate
the noise and drift characteristics of the smartphone
sensor data, two 20 second tests are conducted with
the smartphone sensors (sampled at 60 Hz) and the
potentiometer and tachometer sensors on the test-bed.
The first test involved collecting sensor data while the
motor is held at the zero orientation without being
driven. The angular position data from the smart-
phone sensors and potentiometer sensor are shown
in Figure 5(a) for this static test. Smartphone atti-
tude data has an average drift rate of 1.0297x10
−4
rad/sec (0.0059
◦
/sec). Angular rotation rate data from
the gyroscope and the tachometer are shown in Fig-
ure 5(b). Data from the tachometer has a slight bias;
the mean of the gyroscope data is −1.4439x10
−4
rad/sec (−0.0083
◦
/sec) while the tachometer mean
is 0.0038 rad/sec (0.2177
◦
/sec). However, the data
from the smartphone is much noisier and causes drift
ICINCO2015-12thInternationalConferenceonInformaticsinControl,AutomationandRobotics
332
(a)
(b)
Figure 5: Comparisons between (a) the smartphone attitude
sensing and potentiometer readings and (b) the smartphone
gyroscope readings and tachometer readings while the mo-
tor is not being driven.
in smartphone attitude. The standard deviation of
the gyroscope is 0.0044 rad/sec (0.2521
◦
/sec) com-
pared to 7.0937x10
−4
rad/sec (0.0406
◦
/sec) for the
tachometer.
The second test involved collecting sensor data
while the motor is driven from its zero orientation
with a constant 0.5 Volt signal. The angular po-
sition measurements from the smartphone and from
the potentiometer of the test-bed are shown together
in Figure 6(a). At the beginning of the run, the
difference between the angular position readings is
0.0030rad (0.1719
◦
) and at the end of the run, the dif-
ference is −0.0174 rad (−0.9969
◦
). Over the course
of the run, the mean difference between the two sen-
sors is −0.0247 rad (−1.4152
◦
). This represents a
sufficiently small amount of error for the case when
the motor is continuously driven over a long time in-
terval. The measurements from the gyroscope of the
smartphone and from the tachometer of the test-bed
are shown together in Figure 6(b). The mean read-
ing for the angular speed reported by the gyroscope
is 0.7070 rad/sec (40.5081
◦
/sec) compared to the
tachometer’s 0.7163rad/sec (41.0410
◦
/sec), indicat-
ing a difference of just 0.0093rad/sec (0.5329
◦
/sec).
The standard deviation of the smartphone’s gyroscope
for this test is 0.0113rad/sec (0.6474
◦
/sec) and for
the tachometer 0.0107 rad/sec (0.6131
◦
/sec), show-
ing that the two sensors have noise of a similar mag-
nitude during this dynamic test.
To stabilize the motor test-bed, attitude estimates
are only needed for a few seconds. Therefore, read-
ings from embedded gyroscopes and accelerometers
are sufficient to provide such estimates. For long-
term use, additional sensors such as onboard three-
axis magnetometers can provide additional sensory
(a)
(b)
Figure 6: Comparisons between (a) the smartphone attitude
sensing and potentiometer readings and (b) the smartphone
gyroscope readings and tachometer readings while the mo-
tor is being driven by a 0.5 Volt signal.
information necessary to eliminate drift. Traditional
approaches of fusing the data between the three sen-
sors make use of unscented Kalman filters (Harada,
2003), extended Kalman filters (Marins, 2001), and
other filtering techniques. The implementation of
such techniques using the embedded magnetometer
on the smartphone will be explored in future work.
5.2 Controlling the Test-bed
To explore the feasibility of controlling the motor test-
bed using the attitude and speed measurements col-
lected by the smartphone and running the PD-control
algorithm directly on the smartphone, trials are con-
ducted in which the motor is given a step input com-
mand of 90
◦
(1.5708 rad). Figures 7(a)–7(f) show the
motor’s closed-loop response at each sampling rate.
By plotting the angular position data reported by the
smartphone next to the readings of the potentiometer
as it is sampled by the desktop computer at 1,000 Hz,
one can visualize the communication delay between
the smartphone and computer as well as the drift in
the smartphone sensor data. Note that the results of
simulation are also plotted alongside the experimental
results. For comparison purposes, Figure 7(g) shows
the response when the nominal PD controller is im-
plemented on the desktop computer using feedback
from the potentiometer and tachometer sensors of the
test-bed.
Table 2 shows the values of the percent overshoot
and settling time for each of the responses depicted
in Figure 7. These results show that the percent over-
shoot and settling time increase as the sampling rate
of the smartphone is decreased, indicating an im-
provement in the responsiveness of the closed-loop
ExploringtheRoleofaSmartphoneasaMotionSensingandControlDeviceintheWirelessNetworkedControlofaMotor
Test-bed
333
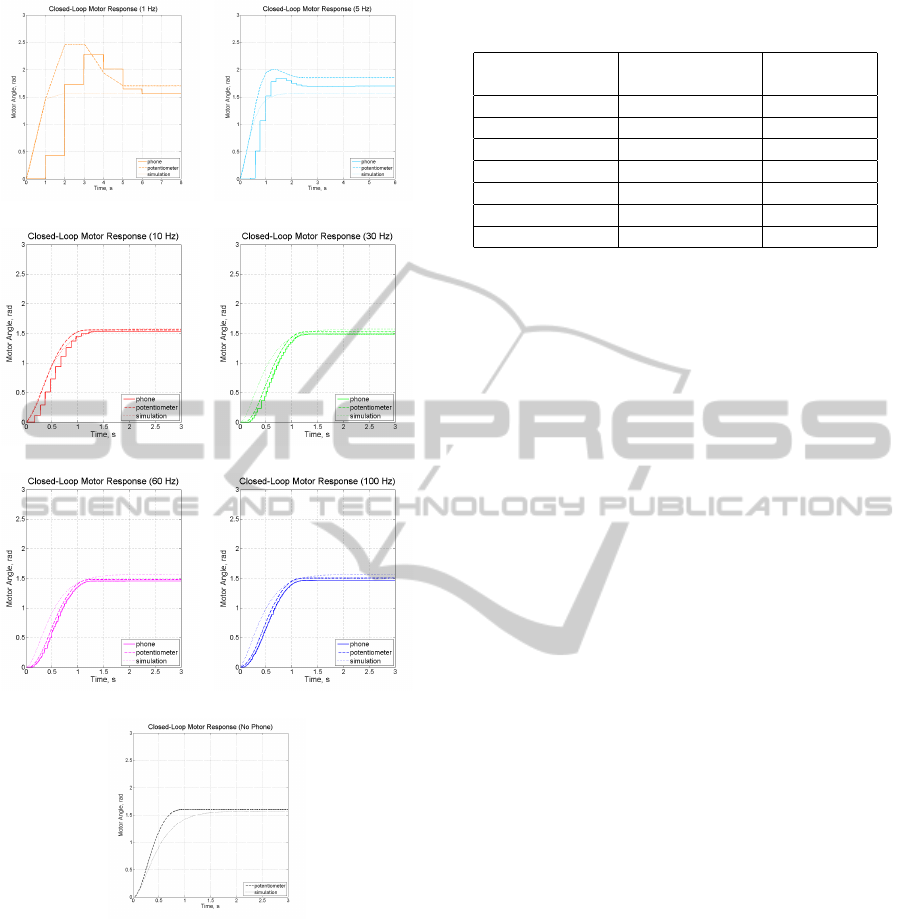
(a) (b)
(c) (d)
(e) (f)
(g)
Figure 7: Closed-loop responses with the redesigned con-
troller implemented using the smartphone (a–f) and the
nominal controller implemented using the computer (g).
system as the sampling rate becomes faster. Note that
a large deterioration in the quality of the performance
is observed from the motor when the smartphone-
based controller is run slower than 10 Hz. Since 5
Hz and 1 Hz are significantly less than 30 times the
closed-loop bandwidth frequency, sampling the motor
system at these rates leaves a large amount of inter-
sample behavior uncaptured by the smartphone, caus-
ing a significant loss in performance. Finally, each
response exhibits varying degrees of steady-state er-
Table 2: Motor response performance using the digitally
redesigned PD-control implementation.
Sampling Rate Maximum
Overshoot (%)
Settling
Time (s)
no phone 0.00 0.798
100 Hz 0.00 1.096
60 Hz 0.00 1.128
30 Hz 0.00 1.140
10 Hz 0.00 1.216
5 Hz 8.12 2.188
1 Hz 46.23 5.986
ror, which can be attributed to mechanical properties
of the motor and gearbox, such as friction, that result
in a deadzone in the motor’s sensitivity around 0 Volt.
This steady-state error can be overcome with the in-
troduction of an integral term to the controller. Note
that by designing the controllers using the sampled-
data model, the response of the motor at each sam-
pling rate is more or less consistent and varies little
from one sampling rate to another.
To confirm that time delays introduced by the
wireless network latency may be neglected in the
design of the proposed system, a simulation of
the sampled-data model was built in the MAT-
LAB/Simulink environment with a constant delay of
39.055 ms introduced (the mean one-way communi-
cation time measured in Section 2.3). As can be seen
in Figure 7, the experimental results match the sim-
ulated responses quite well, indicating that delays of
0-4 sampling periods are not significant when control-
ling a system with such a low bandwidth. In future
work, the use of the proposed system with more time-
sensitive, high-bandwidth plants will be explored.
With a low closed-loop bandwidth, a large range
of sampling rates may be used to stabilize the pro-
posed system. However, it is observed that the battery
is consumed quicker at faster sampling rates, since the
sensors as well as the communication module con-
sume a substantial amount of a smartphone’s power.
Therefore, a sampled-data model can be used to de-
sign a controller to be implemented on the smart-
phone at a sampling rate just about 30 times the
closed-loop bandwidth frequency.
6 CONCLUSIONS
This paper explored an approach to wirelessly con-
trol the orientation of a motor test-bed using feed-
back from the embedded motion sensors of a smart-
phone mounted to the test-bed. The study explored
the case of performing the control algorithm on the
smartphone itself. A PD control algorithm was used,
with controllers running at several different sampling
ICINCO2015-12thInternationalConferenceonInformaticsinControl,AutomationandRobotics
334

rates being compared. Results from simulations and
experiments validate the feasibility of using a smart-
phone to serve as the sensing and control platform in
the automatic control of systems with a single rota-
tional degree of freedom. Future work will consider
extensions to more complex systems with both rota-
tional and translational degrees of freedom, such as an
inverted pendulum on cart system. Studies with stu-
dents will be conducted to investigate whether the use
of mobile devices in the proposed manner is engag-
ing and provides access to more effective, interaction-
based educational, training, and research experiences
in the fields of automatic and digital control.
ACKNOWLEDGEMENTS
This work is supported in part by the National Science
Foundation awards RET Site EEC-1132482, GK-12
Fellows DGE: 0741714, and DRK-12 DRL: 1417769,
and NY Space Grant Consortium grant 48240-7887.
The authors would like to thank Matthew Moor-
head for the design and fabrication of the smartphone
mount.
REFERENCES
Aroca, R.V., et al. (2012). Towards smarter robots with
smartphones. In 5th Workshop in Applied Robotics
and Automation, pages 1–6.
Desai, A., et al. (2013). Stabilization and control of
quad-rotor helicopter using a smartphone device. In
IS&T/SPIE Electronic Imaging, page 866208.
Dorf, R. and Bishop, R. (2007). Modern Control Systems
(11th ed.). New Jersey: Prentice Hall.
El-Gaaly, T. et al. (2013). Visual obstacle avoidance for
autonomous watercraft using smartphones. In Au-
tonomous Robots and Multirobot Systems Workshop.
Frank, J. and Kapila, V. (2014). Development of mobile
interfaces to interact with automatic control experi-
ments [focus on education]. IEEE Control Systems,
34(5):78–98.
Harada, T., et al. (2003). Portable orientation estimation
device based on accelerometers, magnetometers and
gyroscope sensors for sensor network. In IEEE Int.
Conf. Multisensor Fusion and Integration for Intelli-
gent Systems, pages 191–196.
He, Y., Li, Y., and Yin, C. (2012). Falling-incident detec-
tion and alarm by smartphone with multimedia mes-
saging service (MMS). E-Health Telecommunication
Systems and Networks, 1(1):1–5.
Jacquot, F., et al. (2012). Measuring the Cobb angle with
the iPhone in kyphoses: A reliability study. Interna-
tional Orthopaedics, 36(8):1655–1660.
Khan, A.M., et al. (2010). Human activity recognition
via an accelerometer-enabled smartphone using ker-
nel discriminant analysis. In Int. Conf. Future Infor-
mation Technology, pages 1–6.
Kovatchev, B.P., et al. (2013). Feasibility of outpatient fully
integrated closed-loop control first studies of wearable
artificial pancreas. Diabetes Care, 36(7):1851–1858.
Kuo, B. (1980). Digital Control Systems (2nd ed.). Oxford
University Press.
Lane, N.D., et al. (2010). A survey of mobile phone sens-
ing. IEEE Communications Magazine, 48(9):140–
150.
LeMoyne, R., et al. (2010a). Implementation of an
iPhone as a wireless accelerometer for quantifying
gait characteristics. In IEEE Int. Conf. Engineering
in Medicine and Biology Society, pages 3847–3851.
LeMoyne, R., et al. (2010b). Implementation of an iPhone
for characterizing Parkinson’s disease tremor through
a wireless accelerometer application. In IEEE Int.
Conf. Engineering in Medicine and Biology Society.
Luinge, H. and Veltink, P. (2005). Measuring orientation
of human body segments using miniature gyroscopes
and accelerometers. Medical and Biological Engi-
neering and Computing, 43(2):273–282.
Marins, J.L., et al. (2001). An extended kalman filter for
quaternion-based orientation estimation using MARG
sensors. In IEEE/RSJ Int. Conf. Intelligent Robots and
Systems, volume 4, pages 2003–2011.
Mednis, A., et al. (2011). Real time pothole detection us-
ing Android smartphones with accelerometers. In Int.
Conf. Distributed Computing in Sensor Systems and
Workshops, pages 1–6.
Moder, T., Hafner, P., and Wieser, M. (2014). Indoor posi-
tioning for visually impaired people based on smart-
phones. In Computers Helping People with Special
Needs, pages 441–444.
Nagle, J. (1995). Congestion control in IP/TCP internet-
works. ACM SIGCOMM Computer Communication
Review, 25(1):61–65.
Oravetz, A. and Sandberg, H. (1970). Stationary and non-
stationary characteristics of gyro drift rate. AIAA Jour-
nal, 8(10):1766–1772.
Schindhelm, C., Gschwandtner, F., and Banholzer, M.
(2011). Usability of Apple iPhones for inertial naviga-
tion systems. In IEEE Int. Symp. Personal Indoor and
Mobile Radio Communications, pages 1254–1258.
Shaw, M., et al. (2012). Use of the iPhone for Cobb angle
measurement in scoliosis. European Spine Journal,
21(6):1062–1068.
ExploringtheRoleofaSmartphoneasaMotionSensingandControlDeviceintheWirelessNetworkedControlofaMotor
Test-bed
335
