
Foveated Model based on the Action Potential of Ganglion Cells to
Improve Objective Image Quality Metrics
Sergio A. C. Bezerra
1,2
and Alexandre de A. P. Pohl
2
1
Department of Higher Education (DES),
Federal Institute of Education, Science and Technology of the Amazonas (IFAM), 69020-120, Manaus, AM, Brazil
2
Graduate School of Electrical Engineering and Computer Science,
Federal University of Technology - Paran´a (UTFPR), 80230-901, Curitiba, PR, Brazil
Keywords:
Human Visual System, Objective Image Quality Metrics, Foveated Image, Ganglion Cells.
Abstract:
In this work, a foveated model (FM) based on the action potential of ganglion cells in the human retina is
employed to improve the results obtained by traditional and perceptual image quality metrics. LIVE and
VAIQ image databases are used in the experiments to test and validate this model. Statistical techniques,
such as the Pearson Linear Correlation Coefficient (PLCC), the Spearman Rank-Order Correlation Coefficient
(SROCC) and the Root Mean Square Error (RMSE), are used to evaluate the performance of Peak Signal-to-
Noise Ratio (PSNR) and Structural SIMilarity (SSIM) metrics, as well as their versions improved by the FM.
The results are encouraging because the model proposed improve the performance of the metrics investigated.
1 INTRODUCTION
Processing techniques, storage and transmission of
images and videos have been receiving plenty of at-
tention on the part of researchers in academia and
industry. In this context, processing algorithms are
widely used in multimedia applications, such as tele-
conferencing, video distribution on the Internet, CD,
DVD and digital TV (Sun et al., 2005), (Yu and
Wu, 2000). These algorithms allow great perfor-
mance benefits concerning encoding and decoding of
videos and images, particularly because they provide
a convenient size reduction for storage and transmis-
sion purposes. However, the adoption of compression
techniques with losses causes several types of visual
distortions in the content. For this reason, the devel-
opment of methods to assess the quality of images and
videos has become indispensable. In general, quality
assessment is classified into subjective and objective
methods (Engelke and Zepernick, 2007).
The subjective method uses a minimum num-
ber of subjects in its procedure to assess the im-
age and video quality (Corriveau, 2006). The eval-
uation groups the opinions of subjects into a Mean
Opinion Score (MOS) or a Difference Mean Opinion
Score (DMOS), which provides a statistic based-score
for assessment of the subjective quality (Engelke and
Zepernick, 2007). In (ITU-R BT.500-11, 2002) and
(ITU-T P.910, 2008), recommendations on the appli-
cation of subjective tests are detailed. It is important
to note that results obtained with the subjective eval-
uation are used to validate objective quality methods
(VQEG, 2003), (VQEG, 2008). Although valuable,
its use in real-time applications is not practical due
to the high cost associated with maintaining an ac-
tive group of human observers to perform the tests
(Wang and Bovik, 2006), (Sheikh and Bovik, 2006).
Instead, objective methods were created with the pur-
pose of automatically evaluating the perceived visual
quality (Wang et al., 2004a). In the context of images,
such methods are referenced as objective image qual-
ity metrics (IQM), which can be further divided into
two classes: traditional and perceptual metrics (Wang
and Bovik, 2002), (Pappas et al., 2005).
Traditional IQMs are interesting because they are
mathematically easy to deal with for evaluation and
optimization purposes (Wang et al., 2004b). The sim-
plest and most widely used traditional IQMs are the
Mean Squared Error (MSE), Peak Signal-to-Noise
Ratio (PSNR), Root Mean Squared Error (RMSE),
Mean Absolute Error (MAE) and Signal-to-Noise Ra-
tio (SNR) (Pappas et al., 2005). Nevertheless, they
also have been widely criticized for not correlat-
ing well with perceived quality measurements (Wang
et al., 2004b).
On the other hand, perceptual IQMs consider
84
Bezerra S. and Pohl A..
Foveated Model based on the Action Potential of Ganglion Cells to Improve Objective Image Quality Metrics.
DOI: 10.5220/0005547200840091
In Proceedings of the 12th International Conference on Signal Processing and Multimedia Applications (SIGMAP-2015), pages 84-91
ISBN: 978-989-758-118-2
Copyright
c
2015 SCITEPRESS (Science and Technology Publications, Lda.)

characteristics of the Human Visual System (HVS) in
an attempt to incorporate perceptual aspects into the
quality measures. For instance, the Structural SIMi-
larity (SSIM) metric proposed by (Wang and Bovik,
2002) is, perhaps, the most widely used perceptual
IQM. The SSIM assumes that the HVS is highly
adapted for extracting structural information (such as
contrast, luminance, chrominance and borders) from
a scene and has been proved to outperform traditional
IQMs. Extensions of the SSIM metric have also been
proposed for image (Wang et al., 2003),(Wang et al.,
2004a) and (Zhang et al., 2011) and video (Wang
et al., 2004b), (Seshadrinathan and Bovik, 2007), (Ye
et al., 2008), (Yang et al., 2008) quality metrics.
Given the above, this work raises the hypothesis
that the metrics will be most effective if they consider
the action potential of ganglion cells for a given point
of the image over the regions of interest (ROI), as well
as the viewing distance between the image and the ob-
server.
Thus, a foveated model, denominated FM, based
on the Action Potential of Ganglion Cells is pro-
posed to improve the results obtained by PSNR and
SSIM objective image quality metrics. The LIVE
(Sheikh et al., 2005) and VAIQ (Engelke et al.,
2009) image databases are used in the experiments
to test and validate the FM. Statistical techniques,
such as the Pearson Linear Correlation Coefficient
(PLCC), the Spearman Rank-Order Correlation Co-
efficient (SROCC) and the Root Mean Square Er-
ror (RMSE), recently suggested by VQEG (VQEG,
2008), are used to evaluate the PSNR and SSIM per-
formance, as well as their versions improved by the
FM, denominated FM
PSNR
and FM
SSIM
, respectively.
The results are encouraging because the FM could im-
prove the performance of the investigated metrics.
The remainder of this paper is organized as fol-
lows. Section 2 describes the proposed foveated
model and how it is implemented. Section 3 describes
details of the experiments. Statistical results on the
metric performance are discussed in Section 4, fol-
lowed by the conclusions in Section 5.
2 PROPOSED MODEL
The foveated model (FM) proposed consists of three
steps as specified in Figure 1. Each of the steps is
detailed in the following subsections. The overall
objective of the model is to provide a foveated image
related to an input image. For this, the first model
also needs to know the visual attention point (vap)
of the ROI. Automatic discovery of the vap was
not included in this study because of its complexity.
Thus, in this work the vap corresponds to the ROI
center point of the visual attention map in (Engelke
et al., 2009).
Given an image formed by NxM pixels, the first
step consists of calculating the eccentricity of a pixel
away from the vap, which has as input the viewing
distance and the height of the image in pixels. The
second step estimates the visual acuity of the HVS
to a certain point of the image. Based on the visual
acuity information available in (Engelke et al., 2009),
a closed expression is employed to obtain the eccen-
tricity values. The third step calculates the action
potential provided by the ganglion cells, which then
results in the effective perception of the image by the
primary visual cortex. Finally, the model generates
a new image, called the foveated image (I
F
). This
foveated image is represented mathematically by:
I
F
= FM(I,vap). (1)
Use and Importance of the Foveated Model
In the process, the metric reads the reference and test
images and provides an image quality index (iQI),
described as:
iQI = IQM(I
r
,I
t
), (2)
where I
r
and I
t
represent the reference and the test
image, respectively. It is important to note that the
traditional PSNR and SSIM metrics ignore the visual
attention modeling and action potential, assuming
that the distribution of the ganglion cells is uniform
in the different areas of the retina. To correct this,
it is assumed that the metric must read and compute
foveated images, as follows:
iQI
P
= IQM(I
F
r
,I
F
t
), (3)
where iQI
P
is the image perceptual quality index,
where I
F
r
and I
F
t
represent the reference and test
foveated images. This way, the metric corrects the
values initially given by (2). In the following subsec-
tions, the procedure is described in details.
2.1 Eccentricity Measure
Figure 2 illustrates the eye of a human observer
positioned away from the screen where an image is
projected. d
v
is the viewing distance and d
cmROI
is the
distance between a certain pixel of the image and the
vap, both given in cm. The eccentricity, denoted as e,
is calculated according to the visual angle θ formed
between the lines, one representing the imaginary
axis between the fovea and the vap and the other
FoveatedModelbasedontheActionPotentialofGanglionCellstoImproveObjectiveImageQualityMetrics
85
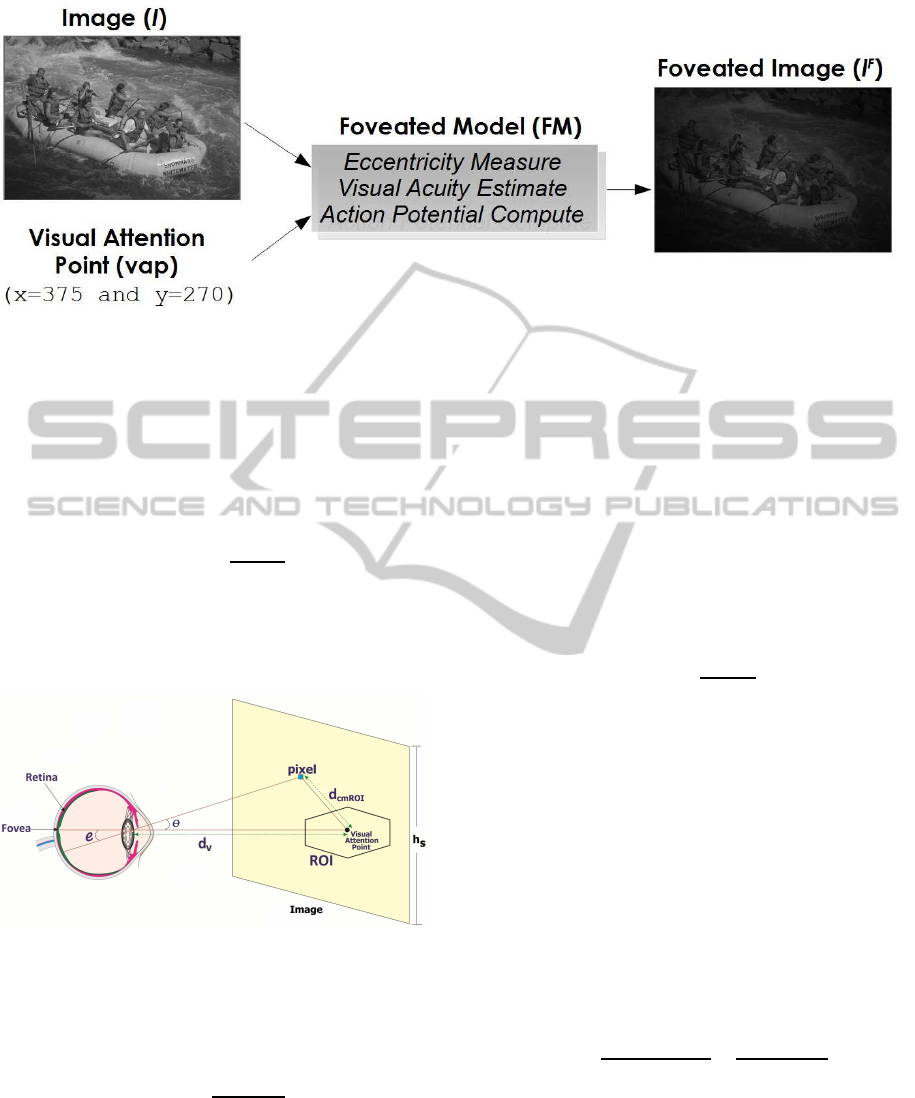
Figure 1: Steps for implementing the proposed Foveated Model (FM). I is the input image exemplified by rapids, vap is the
visual attention point and I
F
is the foveated image produced by the model. x and y are the coordinates of the vap selected for
rapids.
representing the axis formed by the pixel of the image
away from the vap and its projection in the retina.
The vap is represented by the point in the center
of the hexagon that limits the ROI. Eccentricity is
calculated in degrees by the following equation:
e = f
d
(arctn(
d
cmROI
d
v
)), (4)
where f
d
is the function that converts a value in
radians to degrees. Equation (4) is applied to any
spatial dimension of the image.
Figure 2: Diagram representing the human eye and the
screen, where the image is projected.
The relationship between the length in cm and the
pixels can be obtained by:
d
cmROI
=
d
pROI
· h
s
h
p
, (5)
where h
s
is the height of the spatial sampling of
the image, in cm, h
p
is the image height in pixels,
and d
pROI
is the Euclidean distance in pixels, be-
tween the vap and the pixel under attention, where
d
pROI
= [(x
vap
− x
pixel
)
2
− (y
vap
− y
pixel
)
2
]
1/2
. The
parameter d
v
corresponds to the result of the mul-
tiplication of the perceptual weight, denoted as ω
P
,
by h
s
. Perceptual weight is a constant that serves to
adjust the value of d
v
. Viewing distance in general
depends on the applications (ITU-T P.910, 2008).
The parameter d
v
is then obtained, in cm, by:
d
v
= ω
P
· h
s
. (6)
Substituting (5) and (6) in (4) gives:
e = f
d
(arctn(
d
pROI
ω
P
· h
p
)), (7)
where (7) is used to calculate the eccentricity in this
work.
2.2 Visual Acuity Estimate
The expression derived to estimate the density
distribution of ganglion cells in the retina is based
on experimental data published in (Curcio and Allen,
1990). Curcio and Allen made anatomical measure-
ments of the density distribution of ganglion cells
in human eyes in different areas of the retina (nasal,
temporal, superior and inferior). The average density
distribution can be described by an equation given by:
f
va
= f
va
0
· (
0.85
1+ (e/0.45)
2
+
0.15
1+ (e/e
g
)
2
), (8)
where f
va
is the ganglion cell density and represents
the HVS perception response for a pixel projected in
the retina. The f
va
0
is the ganglion cell density in the
center of the retina (fovea), e is the eccentricity in de-
grees and e
g
is a constant that differs from subject to
subject. In this work, a value of 36,000 cells/deg is
used for f
va
0
and 3.3
◦
is used for e
g
(Barten, 1999).
SIGMAP2015-InternationalConferenceonSignalProcessingandMultimediaApplications
86

For further calculations, Equation (8) is normalized in
the interval [0, 1].
2.3 Action Potential Estimation
The action potential provided by the ganglion cells in
the observation of each pixel is then used to correct
the viewed image as follows:
I
F
(x,y) = I(x,y) · f
va
, (9)
where I(x,y) is the pixel of an image without correc-
tion, f
va
is the visual acuity of this pixel and I
F
(x,y)
is the foveated pixel at the same coordinate. The FM
gives the foveated result when (9) is applied to all pix-
els of the image.
3 MATERIAL AND METHOD
3.1 Image Databases
In order to apply the proposed metric, two image
databases (IQAD) are used in the experiments, LIVE
(Sheikh et al., 2005) and VAIQ (Engelke et al., 2009).
LIVE contains reference and degraded images. The
Visual Attention for Image Quality (VAIQ) contains
visual attention maps of LIVE reference images. The
following subsections and Table I provide more infor-
mation on these IQADs.
3.1.1 LIVE Database
LIVE is provided by the Laboratory for Image and
Video Engineering in collaboration with the Center
for Perceptual Systems at the University of Texas at
Austin. The database include pictures of faces, peo-
ple, animals, close-up shots, wide-angle shots, nature
scenes, man-made objects, images with distinct fore-
ground and background configurations, and images
without any specific object of interest. Some images
have high activity, while some are mostly smooth.
Most important, all images are 768 x 512 pixels in
size.
LIVE contains 29 reference images and 779 test
ones, the latter being the results of distortions ap-
plied to the 29 reference images. Types of existing
distortions are White Noise, Gaussian Blur and Sim-
ulated Fast Rayleigh (wireless) Channel, JPEG and
JPEG2000 compression. However, test images with
White Noise are not included in the experiments of
the current work, because such distortion is not gen-
erated in true digital applications. To assess the qual-
ity of the images available in LIVE, 20 to 29 subjects
were employed to subjectivelyevaluatethe images us-
ing the single-stimulus method. Subjects viewed the
monitors from an approximate viewing distance of 2
to 2.5 screen heights, i.e., from 106.68 to 133.35 cm.
Table 1: Overview of parameters for the LIVE and VAIQ
Databases.
Database LIVE VAIQ
Reference images 29 42
Test images 779 -
Image width 480 - 768 512
480 - 768,
480 - 768
Image height 438 - 720 512,
438 - 720,
488 - 720
Viewing distance 106.68 - 133.35 60
Subjects 20 - 29 15
3.1.2 VAIQ Database
The VAIQ database is the result of an eye tracking
experiment at the University of Western Sydney, Aus-
tralia. A total of 15 subjects participated in the exper-
iment. Their ages ranged from 20 to 60 years with an
average age of 42. The experiment was conducted in
a laboratory with low light conditions. A 19” Sam-
sung SyncMaster monitor was used for image presen-
tation. The screen resolution was 1280 x 1024 pixel.
The eye tracker (EyeTech TM3) was used to record
the gaze of the human observers. It was installed un-
der the screen and the participants were seated at a
distance of approximately 60 cm from the screen.
3.2 Experiments using LIVE and VAIQ
Experiments performed in this work using LIVE and
VAIQ databases were accomplished according to the
steps illustrated in Figure 1. The model initially has
I
r
, I
t
and vap as its input. I
r
and I
t
are the refer-
ence and test images originating from LIVE. The vap
is selected manually for each reference image.This
choice is made according to the most intense region
of the map of visual attention obtained from the VAIQ
database for each LIVE corresponding image used in
the test. Experiments were performed for the ω
p
cho-
sen as 2.25. This value is obtained by the arithmetic
average of the viewing distances (2 to 2.5) available
in (H. R. Sheikh, 2006). The code available in (Wang,
2014) is used to measure the SSIM index. FM pro-
grams were developed in MATLAB, the same can be
obtained directly from the authors, as well as other
files used in the experiments.
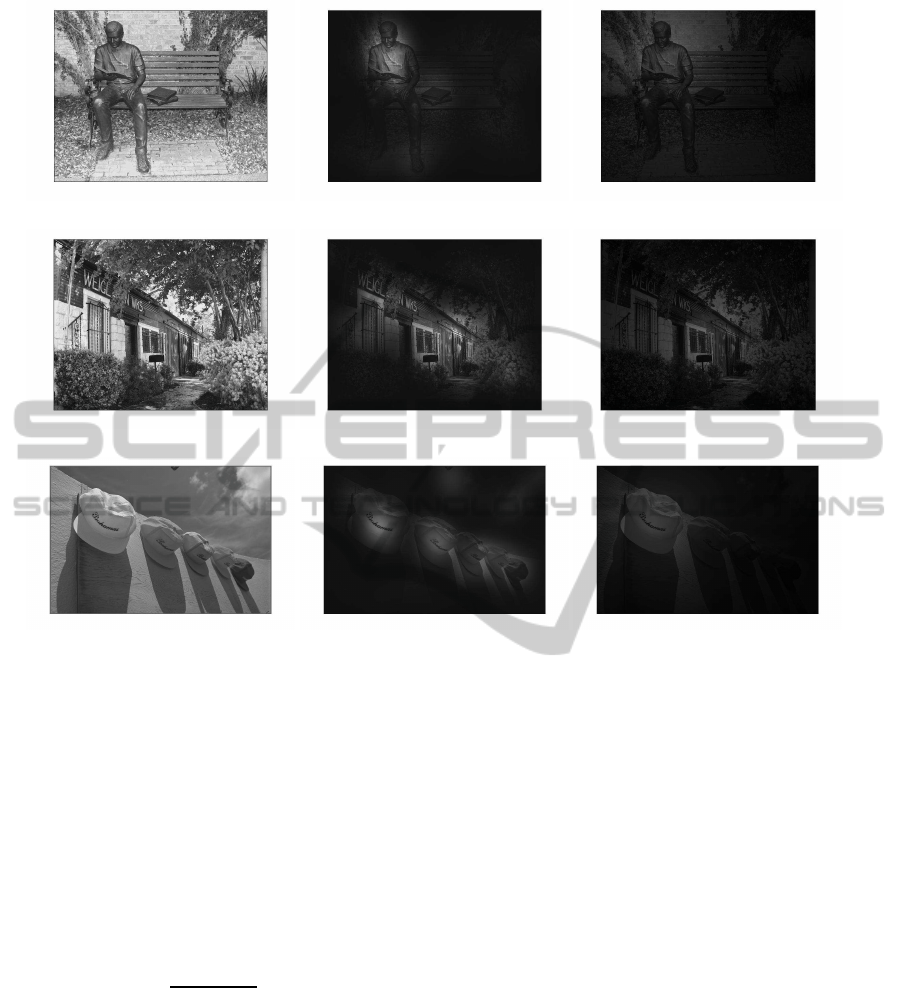
Figure 3 presents an illustration of the process.
FoveatedModelbasedontheActionPotentialofGanglionCellstoImproveObjectiveImageQualityMetrics
87

In the first column, Figure 3(a, d, g) are retrieved
from LIVE, respectively, studentculpture, building2
and caps. For each one of these images, there is a
corresponding ROI in the VAIQ database as shown in
column 2, Figure 3(b, e, h). In the third column, Fig-
ure 3(c, f, i) are foveated image to images (a), (d) and
(g), respectively, generated from a Visual Attention
Point (VAP) that was selected manually according the
ROI image (b), (e) and (h). Using (8) and (9) for one
chosen reference and test images, the corresponding
values of iQI in (2) and of iQI
P
in (3) can be calcu-
lated.
4 STATISTICAL ANALYSIS
The procedure recommended by VQEG in (VQEG,
2003) and (VQEG, 2008) was used to evaluate
the performance of the PSNR, SSIM, FM
SSIM
and
FM
PSNR
metrics. The last two metrics deliver the
iQI
P
SSIM
and iQI
P
PSNR
, respectively. The procedure
adopted to check the performance assessments takes
three steps. The first is the data mapping of the IQM
predictions for the subjective scale. The second step
uses statistical analysis to evaluate the performance of
each IQM. Finally, the statistical significance of the
results is analyzed.
In order for results not to be masked, the sub-
jective evaluations of the reference images are dis-
carded. According to (VQEG, 2008), the discard
should be made when assessing the performance of
full-reference (FR) and reduced-reference (RR) met-
rics, as is the case in this work.
4.1 DMOS Values and Mapping to the
Subjective Scale
The data mapping requires the use of a nonlinear
mapping step. Therefore, to remove any nonlinearity
due to the subjective rating process and to facilitate
the comparison of IQMs in a common domain, the
relationship between each IQM predictions and the
corresponding subjective ratings is estimated using a
nonlinear regression between the IQM set of image
quality ratings (IQRs) and the corresponding DMOS
(VQEG, 2003). The values used for DMOS are
available in (Sheikh et al., 2005). The details of such
a calculation can be obtained in (H. R. Sheikh, 2006).
A nonlinear mapping function found to perform well
empirically is the cubic polynomial [9]:
DMOS
p
= ax
3
+ bx
2
+ cx+ d, (10)
where DMOS
p
is the predicted DMOS. The weight-
ings a, b and c and the constant d are obtained by
fitting the function to the data [DMOS, IQR].
4.2 Performance Evaluation Metrics
The performance of IQMs is evaluated with respect to
their ability to estimate the subjective assessment of
the quality of an image, as follows: accuracy, mono-
tonicity and consistency (VQEG, 2003). Accuracy
is the ability to predict the subjective quality ratings
with low error and is determined by the Pearson
Linear Correlation Coefficient (PLCC). Monotonicity
is the degree to which IQM predictions agree with
the relative magnitudes of subjective quality ratings.
This is accounted for by the Spearman Rank-Order
Correlation Coefficient (SROCC). Consistency is the
degree to which the IQM maintains accuracy over the
range of image test sequences, an example of this is
whether its response is robust with respect to a vari-
ety of image impairments. The Root Mean Square
Error (RMSE) metric is used for the prediction of
consistency. A better IQM is expected to have higher
PLCC and SROCC while presenting lower RMSE
values.
RMSE is calculated by the following expression:
RMSE =
s
1
N − d
∑
N
(DMOS(i) − DMOS
p
(i))
2
,
(11)
where the index i denotes the image sample, N de-
notes the total number of images considered in the
analysis, and d is the number of degrees of freedom
of the mapping function. In this work, d = 4 because
the used mapping is a 3
rd
-order monotonic polyno-
mial function (VQEG, 2008).
The results of SROOC, PLCC and RMSE are rep-
resented in the three sections of Table II. Each sec-
tion contains 4 lines, where the line contains results
of SROOC, PLCC and RMSE for all the predictions
of the IQMs in this study. The comparisons are al-
ways made between PSNR and FM
PSNR
and between
SSIM and FM
SSIM
. The best results are presented in
bold.
One observes that, for all metrics, the performance
of FM
PSNR
and FM
SSIM
are better than the results
obtained by the traditional PSNR and SSIM, respec-
tively. PLCC, SROCC and RMSE presented less sig-
nificant results between FM
SSIM
and SSIM for the
Fast-fading distortion and all of the distortions to-
gether, but FM
SSIM
is still more efficient than the
SSIM.
SIGMAP2015-InternationalConferenceonSignalProcessingandMultimediaApplications
88
(a) (b) (c)
(d) (e) (f)
(g) (h) (i)
Figure 3: Choice examples of the VAP and Distribution Map of Ganglion Cells (DMGC). (a), (d) and (g) are images existing
in LIVE (Sheikh et al., 2005), respectively, studentculpture, building2 and caps; (b), (e) and (h) are visual attention regions
(ROI) of the images of (a), (d) and (g), respectively, existing in VAIQ (Engelke et al., 2009); (c), (f) and (i) are foveated image
to images (a), (d) and (g), respectively, generated from a Visual Attention Point (VAP) that was selected manually according
the RoI image (b), (e) and (h).
4.3 Statistical Significance of the Results
The statistical significance of the results is given by
the ratio between the RMSEs of the IQMs, and has a
F-distribution with n1 and n2 degrees of freedom and
is defined by:
ζ =
(RMSE
A
)
2
(RMSE
B
)
2
, (12)
where RMSE
A
and RMSE
B
are, respectively, the
RMSE of metrics A and B involved in the com-
parison. The ζ parameter is evaluated based on F-
distribution function, which has a F
critical
of 5% and
ensures a 95% significance level. If ζ is higher than
the F
critical
, then there is a significant difference be-
tween the values of RMSE (VQEG, 2008). Similarly,
F-distribution in percentage, F
%
= (ζ − 1) · 100, de-
livers the absolute significance level. This way, two
IQMs cannot be considered statistically different for
values of ζ smaller than 1.05. On the other hand, if
ζ > 1.05 (or F
%
> 5%), results provided by IQMs can
be compared.
The statistical significances of the IQMs are reg-
istered in Table III. In the first and second part of this
table, the significance data results from the compar-
ison of PSNR in relation to the SSIM and FM
SSIM
are presented. In the third part, the results of SSIM
in relation to FM
SSIM
are presented. The bold val-
ues present statistical significances because they are
above the value Fcritical of 5%.
FM
PSNR
metric is statistically different and per-
forms better than PSNR for all types of applied dis-
tortions. The foveated model is able to improve the
results of traditional PSNR by 26.28% for JPEG2000,
28.98% for JPEG, 15.93% for Gaussian Blur, 24.27%
for Fast-fading distortions and 14.30% for all distor-
tions types, respectively.
The SSIM and FM
SSIM
metrics are statistically
different and better than the PSNR. In the third part
FoveatedModelbasedontheActionPotentialofGanglionCellstoImproveObjectiveImageQualityMetrics
89

Table 2: Pearson Linear Correlation Coefficient (PLCC), Spearman Rank-Order Correlation Coefficient (SROCC),Root Mean
Square Error (RMSE) of the Absolute Prediction Error between Subjective Ratings using the LIVE Database.
Evaluation Metric Quality Metric All JPEG2000 JPEG Gaussian Blur Fast-fading
PLCC PSNR 0.8540 0.8984 0.8867 0.7841 0.8893
FM
PSNR
0.8736 0.9205 0.9124 0.8173 0.9119
SSIM 0.9475 0.9650 0.9785 0.9452 0.9446
FM
SSIM
0.9477 0.9681 0.9802 0.9557 0.9452
SROCC PSNR 0.8595 0.8934 0.8800 0.7823 0.8909
FM
PSNR
0.8803 0.9159 0.9063 0.8200 0.9120
SSIM 0.9545 0.9598 0.9754 0.9474 0.9536
FM
SSIM
0.9574 0.9624 0.9779 0.9601 0.9573
RMSE PSNR 13.9635 11.2158 14.8225 11.6254 13.1532
FM
PSNR
13.0611 9.9808 13.0515 10.7972 11.7992
SSIM 8.5791 6.7004 6.6193 6.1138 9.4416
FM
SSIM
8.5621 6.3955 6.3509 5.5157 9.3914
Table 3: ζ Statistic used for the significance of the difference between the Root Mean Square Error. The results are presented
in two ways, ζ Statistic and (F
%
).
Quality Metric All JPEG2000 JPEG Gaussian Blur Fast-fading
PSNR by FM
PSNR
1.1430 1.2628 1.2898 1.1593 1.2427
(14.30%) (26.28%) (28.98%) (15.93%) (24.27%)
PSNR by SSIM 2.6491 2.8019 5.0144 3.6157 1.9408
(164.91%) (180.19%) (401.44%) (261.57%) (94.08%)
PSNR by FM
SSIM
2.6597 3.0755 5.4472 4.4424 1.9616
(165.97%) (207.55%) (444.72%) (344.24%) (96.16%)
SSIM by FM
SSIM
1.0040 1.0976 1.0863 1.2286 1.0107
(0.40%) (9.76%) (8.63%) (22.86%) (1.07%)
of Table III, one observes that our FM is able to im-
prove the SSIM result with statistical significance for
JPEG2000, JPEG and Gaussian Blur Quality Experts
Group (VQEG), respectively, by 9.76%, 8.63% and
22.86%. The SSIM metric is improved in relation
to PSNR by 27.36%, 43.28% and 82.67%, respec-
tively, for these distortions. In this context, SSIM and
FM
SSIM
IQMs are statistically different. Despite the
good results, the foveated model is not able to im-
prove the SSIM metric for Fast-fading distortions, be-
cause SSIM and FM
SSIM
are not statistically different
for this distortion.
5 CONCLUSIONS
In this work, the proposed foveated model (FM) based
on the visual attention point and on the action po-
tential of ganglion cells is used to improve the met-
ric evaluation. The results are encouraging because
the model proposed improve the performance of the
PSNR and SSIM metrics.
Despite the progress made, the FM still needs im-
provement. Therefore, as future work, it is suggested
that the model take into account the ROI and that it
can be automatically detected. The FM could be ad-
justed to work as a glasses where each metric would
receive a specific lens to be able to improve your
vision. Moreover, other database images could be
included in experiments as those found in TID2008
(Ponomarenko et al., 2009), that contain distortions
in ROIs. It is important to note according to figure
3.i which were not considered in multiple regions ex-
periments, and therefore, more of a challenge for fu-
ture work. Finally, after these improvements, we hope
that the proposed model serves as the basis for the de-
velopment of digital image compression applications
more efficiently.
ACKNOWLEDGEMENTS
The authors would like to thank the Federal Insti-
tute of Education, Science and Technology of the
Amazonas (IFAM), the Foundation for research sup-
port of the Amazonas (FAPEAM) and the Coordina-
tion of Qualification of Personnel in Higher Educa-
tion (CAPES). The authors also thank the creators of
SIGMAP2015-InternationalConferenceonSignalProcessingandMultimediaApplications
90

LIVE and VAIQ databases, which provided the refer-
ence and test images used in this work.
REFERENCES
Barten, P. G. J. (1999). Contrast sensitivity of the human eye
and its effects on image quality. HV Press, Knegsel.
Corriveau, P. (2006). Video Quality Testing, In: H. R. Wu, K.
R. Rao, Digital Video Image Quality and Perceptual
Coding. CRC Press, USA.
Curcio, C. A. and Allen, K. A. (Oct. 1990). Topography of
ganglion cells in human retina. In Journal of Compar-
ative Neurology, volume 300, pages 5 – 25.
Engelke, U., Maeder, A., and Zepernick, H. (2009). Vi-
sual attention modelling for subjective image qual-
ity databases. In Multimedia Signal Processing
(MMSP’09), IEEE International Workshop on, pages
1 – 6.
Engelke, U. and Zepernick, H. (May 2007). Perceptual-
based quality metrics for image and video services:
A survey. In Next Generation Internet Networks, 3rd
Euro NGI Conference on, pages 190 – 197.
H. R. Sheikh, M. F. Sabir, A. C. B. (Nov 2006). A statis-
tical evaluation of recent full reference image quality
assessment algorithms. In Image Processing, IEEE
Transactions on, volume 15, pages 3441 – 3452.
ITU-R BT.500-11 (2002). Methodology for the subjective
assessment of the quality of television pictures. ITU.
ITU-T P.910 (2008). Subjective video quality assessment
methods for multimedia applications. ITU.
Pappas, T. N., Safranek, R. J., and Chen, J. (2005). Elsevier,
USA, 2 edition.
Ponomarenko, N., Lukin, V., Zelensky, A., Egiazarian, K.,
Astola, J., Carli, M., and Battisti, F. (2009). Tid2008 -
a database for evaluation of full-reference visual qual-
ity assessment metrics. In Advances of Modern Ra-
dioeletronics, volume 10, pages 30 – 45.
Seshadrinathan, K. and Bovik, A. C. (April 2007). A
structural similarity metric for video based on motion
models. In Acoustic, Speech and Signal Processing
(ICASSP 2007), IEEE International Conference on,
volume 1, pages I–869 – I–872.
Sheikh, H. R. and Bovik, A. C. (2006). Image information
and visual quality. In Image Processing, IEEE Trans-
actions on, volume 15, pages 430 – 444.
Sheikh, H. R., Wang, Z., Cormack, L., and Bovik, A. C.
(2005). Live image quality assessment database re-
lease 2. In http://live.ece.utexas.edu/research/quality.
Sun, H., Chen, X., and Chiang, T. (2005). Digital video
transcoding for transmission and storage. CRC Press,
USA.
VQEG (2003). Final Report from the Video Quality Experts
Group on the Validation of Objective Models of Video
Quality Assessment, Phase II. Video Quality Experts
Group (VQEG).
VQEG (2008). Final Report from the Video Quality Experts
Group on the Validation of Objective Models of Mul-
timedia Quality Assessment, Phase I. Video Quality
Experts Group (VQEG).
Wang, Z. (2014). The ssim index for image quality
assessment. In https://ece.uwaterloo.ca/∼z70wang/
research/ssim/.
Wang, Z. and Bovik, A. C. (2006). Modern Image Quality
Assessment. Morgan & Claypool, USA.
Wang, Z. and Bovik, A. C. (March 2002). A universal im-
age quality index. In IEEE Signal Processing Letters,
volume 9, pages 600 – 612.
Wang, Z., Bovik, A. C., and Sheikh, H. R. (April 2004a).
Image quality assessment: From error visibility to
structural similarity. In Image Processing, IEEE
Transactions on, volume 13, pages 600 – 612.
Wang, Z., Lu, L., and Bovik, A. C. (February 2004b). Video
quality assessment based on structural distortion mea-
surement. In Signal Processing: Image Communica-
tion, volume 19, pages 121 – 132.
Wang, Z., Simoncelli, E., and Bovik, A. C. (November
2003). Multi-scale structural similarity for image
quality assessment. In Signals, Systems and Comput-
ers, volume 2, pages 1398 – 1402.
Yang, K., Huang, A., Nguyen, T. Q., Guest, C. C., and Das,
P. K. (September 2008). A new objective quality met-
ric for frame interpolation used in video compression.
In Broadcasting, IEEE Transactions on, volume 54,
pages 680 – 690.
Ye, S., Su, K., and Xiao, C. (2008). Video quality as-
sessment based on edge structural similarity. In Im-
age and Signal Processing (CISP 2008), International
Congress on, pages 445 – 448.
Yu, Z. and Wu, H. R. (2000). Human visual system based
objective digital video quality metrics. In Signal Pro-
cessing (ICSP2000), IEEE Proceedings of Interna-
tional Conference on, volume 2, pages 1088 – 1095.
Zhang, L., Zhang, D., Mou, X., and Zhang, D. (Agosto
2011). Fsim: A feature similarity index for image
quality assessment. In Image Processing, IEEE Trans-
actions on, volume 20, pages 2378 – 2386.
FoveatedModelbasedontheActionPotentialofGanglionCellstoImproveObjectiveImageQualityMetrics
91
