
Solving the Grid Defender’s Dilemma: Tamper Protection for
Distributed Cyber-Physical Systems
Jason Reeves and Sean W. Smith
Department of Computer Science, Dartmouth College, Hanover, NH, U.S.A.
Keywords:
Tamper Detection, Critical Infrastructure, Cyber-Physical Systems.
Abstract:
Embedded devices installed as part of the smart grid rollout present a major dilemma for grid defenders,
because they are soft targets that could allow an attacker to access critical assets (generators, control centers,
etc.) deeper in the utility’s network. While both physical tampering and intrusion protection are large, well-
studied fields, state-of-the-art protection schemes suffer from several flaws: They are not powerful enough
to respond properly to different tamper events, their severe responses can lead to reduced grid availability,
and they often require more setup resources than a utility operator can provide. To protect these networks,
we present TEDDI (Tamper Event Detection on Distributed Infrastructure), a distributed, sensor-based tamper
protection architecture for embedded devices on utility networks. TEDDI uses data gathered from across
the network to make more-informed and more-accurate tamper decisions, and can customize its response
based on the event it sees. It can also be configured and installed quickly, without needing a large base of
knowledge beforehand. In this paper, we lay out the TEDDI architecture, and discuss how TEDDI solves the
grid defender’s dilemma better than current work.
1 INTRODUCTION
1
As part of the push towards a smarter electric grid,
utilities have installed a number of edge devices
(resource-constrained embedded devices that live on
the periphery of a network, e.g. at a consumer’s home
or on a telephone pole) on their SCADA
2
networks.
These devices present a major security challenge for
the power grid, since they are relatively easy to ac-
cess, they have little physical security, and they have
direct access to a utility’s SCADA network. There-
fore, edge devices provide a potential gateway to any
of the devices on a utility’s broader communication
and control network, which makes protecting edge
devices a high priority.
While a large corpus of work exists in the area of
tamper detection and physical security, the grid’s fo-
cus on availability and resilience presents a dilemma
for grid defenders. Choosing an incorrect or unnec-
1
Sections 1 through 4, as well as Section 7, are based on our pre-
vious paper from the International Cryptographic Module Confer-
ence (Reeves and Smith, 2014). ICMC, however, did not publish
its proceedings.
2
SCADA stands for “Supervisory Control and Data Acquisition,”
and is generally used to describe the command-and-control net-
works used by critical industries like the power grid.
essarily severe response to an event could unneces-
sarily reduce the grid’s availability, which is a worse
outcome than a malicious attack. Most current tam-
per protection solutions, however are unable to differ-
entiate between important tamper events and do not
have the power to tailor their responses accordingly,
which increases the chances of choosing the wrong
response.
To address this dilemma, we propose TEDDI
(Tamper Event Detection on Distributed Infrastruc-
ture), a distributed, sensor-based system that can use
information from the larger network to help inform
local tamper decisions. TEDDI collects information
about the physical environment of edge devices, and
uses this data to determine what events, whether ma-
licious or benign, might be affecting these devices.
Once our system makes this decision, we determine
and execute the optimal sequence of responses for
each affected device.
Our contributions are as follows:
• We have built a novel system that addresses the
security concerns surrounding edge devices in a
SCADA network. Our system handles a wider
range of events than existing protection solutions,
and also allows for multiple responses.
309
Reeves J. and Smith S..
Solving the Grid Defender’s Dilemma: Tamper Protection for Distributed Cyber-Physical Systems.
DOI: 10.5220/0005549503090316
In Proceedings of the 12th International Conference on Security and Cryptography (SECRYPT-2015), pages 309-316
ISBN: 978-989-758-117-5
Copyright
c
2015 SCITEPRESS (Science and Technology Publications, Lda.)

• Our system features a novel way to make tamper
decisions, using factor graphs (Frey, 2003) to fuse
together sensor data and quickly determine what
event is occurring.
• Our system will be more useable for power
engineers who have performance goals and
operational-related events in mind, but may not
have a large training data set at hand or have time
to fine-tune a complex protection system.
We structure the rest of this paper as follows: Sec-
tion 2 discusses important background information,
Section 3 introduces the relevant related work in this
space, Section 4 introduces TEDDI and explains its
individual components, Section 5 highlights TEDDI’s
advantages over prior work, Section 6 outlines the
next steps in our research, and Section 7 offers our
conclusions.
2 BACKGROUND
In this section, we discuss the dilemma faced by op-
erators trying to protect the grid, and the benefits of
choosing factor graphs as our data fusion algorithm.
2.1 The Grid Defender’s Dilemma
In defending the power grid, operators face a concern-
ing scenario:
• Grid SCADA networks are open to attacks that
could have severe, long-lasting consequences: A
2014 Wall Street Journal article (Smith, 2014) de-
clared that malicious attackers could cause a na-
tionwide blackout by taking down fewer than ten
critical substations during a period of high de-
mand on the grid, and that such a blackout “could
plunge the country into darkness for weeks, if not
months” (Smith, 2014).
• As stated earlier, edge devices pose a large secu-
rity risk to utilities for three reasons: They are
relatively easy to access, they have little physical
security, and they have direct access to a utility’s
SCADA network. An attacker could potentially
use an edge device as a launching point for further
attacks on high-value targets deeper in the net-
work. Such attacks have been shown to be plau-
sible and effective: For example, a single mal-
formed packet “can crash an entire SCADA trans-
mission system” (Peterson, 2013).
• However, availability reigns supreme for SCADA
networks, so operators have to be careful about
properly identifying and responding to the events
affecting the grid. Choosing an incorrect or un-
necessarily severe response to an event could re-
duce the grid’s availability by leading to increased
technician visits, frequent device replacements,
and unnecessary service losses.
• While operators have a clear idea of their security
goals and the attacks they want to guard against,
their resources are limited: They may not have the
time nor the training data to configure a complex
protection system for their network.
To solve this dilemma, grid defenders need an
easy-to-use tool that requires minimal prior knowl-
edge about important events, but also has the power
and flexibility to differentiate between these events
and choose an appropriate response for each one. This
is the gap we want to fill with TEDDI.
2.2 Factor Graphs
In TEDDI, we use factor graphs (Frey, 2003) as our
fusion algorithm for our sensor data. Formally, a fac-
tor graph is a bipartite graph that connects a set of
nodes V that represents system variables with a set of
nodes F that represents functions relating these vari-
ables. If a function is dependent on a variable, an edge
is added to the graph between the nodes that represent
this variable and function.
Data fusion within tamper protection systems is
usually done using a standard technique such as
Bayesian networks (Pearl, 1988) or a custom al-
gorithm such as SCADAHawk’s snapshots (Sousan
et al., 2013). These techniques, however, have lim-
ited detection power: For example, Bayesian analyses
are unable to capture complex dependencies between
events due to their inherent independence assump-
tions, and adapting them to cover these dependen-
cies can make these models infeasibly complex (Cao
et al., 2015). In contrast, factor graphs allow for
“arbitrary factorizations of joint distributions” (Frey,
2003), giving them the power to perform any task
that a Bayesian network could while using a simpler
model that can capture the defender’s intuition about
suspicious activity (Cao et al., 2015). This added
power means factor graphs can give us improved
event detection and protection capabilities over cur-
rent SCADA protection systems, while also giving
utilities more flexibility to balance security with their
larger availability goals.
3 RELATED WORK
In this section, we discuss some of the related work
in both hardware tamper protection and general intru-
SECRYPT2015-InternationalConferenceonSecurityandCryptography
310

sion protection.
3.1 Hardware Tamper Protection
The roots of hardware tamper protection run deep,
and include seminal works such as Tygar and Yee’s
Dyad platform (Tygar and Yee, 1994) and Smith,
Palmer, and Weingart’s work on the IBM 4758 (Smith
et al., 1998; Smith and Weingart, 1999). More recent
academic work has focused on placing conductive
patches randomly within potting material (Dragone,
2013) and obfuscating the system’s hardware (De-
sai, 2013). Other solutions include chip-level trusted
platform modules (for example, (Atmel Corporation,
2015)) and cryptographic coprocessors (IBM, 2011).
However, these solutions are geared towards single-
device protection, and do not have the response gran-
ularity needed for grid protection.
3.2 Intrusion Protection Systems
Many protection systems in this space use Bayesian
networks for data fusion. For example, Process Query
Systems (Roblee et al., 2005) use conditional prob-
abilities to relate events to one of its attack/failure
models, while the Bayesian trust assessment frame-
work (Wang and Hauser, 2011) tries to evaluate the
trust an operator can place in a device based on
the evidence they collect. The Probabilistic Event
Correlation system (Valdes and Skinner, 2001) uses
Bayesian-based data fusion as a way to reduce false
positives and determine which alerts should be shown
to the administrator.
Some systems forgo standard fusion methods in
favor of building a custom detection algorithm. Ex-
amples of this approach include SCADAHawk (Sou-
san et al., 2013), which organizes data into snap-
shots that it uses for anomaly detection, and Ami-
lyzer (Berthier and Sanders, 2013), which organizes
smart meter traffic into flows that are scrutinized for
policy violations or other unwanted behaviors.
SCPSE (Zonouz et al., 2012) combines intrusion
detection alerts with power system information to
more accurately estimate the security state of an elec-
trical network. The system builds an attack graph that
traces the possible paths an attacker could follow via
exploiting network nodes, and later uses the informa-
tion it gathers to estimate the attacker’s path and thus
reveal what nodes may be compromised. The Re-
sponse and Recovery Engine (Zonouzet al., 2014), on
the other hand, uses attack response trees (ARTs) to
define the security goals of the system and track how
far an attacker has progressed in violating these goals,
thus determining the potential responses to apply.
Finally, we should note that we are not the first
to propose factor graphs as a security mechanism:
Cao et al. (Cao et al., 2015) demonstrated how such
graphs can be used to detect compromised user ac-
counts, even before the accounts had compromised
the actual system. To the best of our knowledge, how-
ever, TEDDI is the first system to use factor graphs for
physical tamper protection.
4 TEDDI OVERVIEW
In this section, we offer a high-level example of how
TEDDI works, and cover each of its components in
detail.
4.1 Why Distributed?
We built TEDDI as a distributed system to better al-
low it to gather contextual information for its tamper
decisions. Our setup is inspired by XACML (Organi-
zation for the Advancement of Structured Information
Standards, 2013), which includes policy information,
decision, and enforcement points as distributed com-
ponents that work together to rule on policy decisions.
Since we also want to make and enforce policy deci-
sions on a distributed system, we adopt a similar ar-
chitecture.
TEDDI is made up of three components:
• Tamper Information Points (TIPs, Section 4.5):
Programs that collect sensor data and attempt to
make local tamper decisions.
• Tamper Decision Points (TDPs, Section 4.6): Pro-
grams that take the sensor data from TIPs, deter-
mine the overall state of the network they moni-
tor, and make tamper decisions when asked by the
TIP.
• Tamper Enforcement Points (TEPs, Section 4.7):
Programs that listen for tamper decisions and ex-
ecute responses based on those decisions.
4.2 Attacker Model
Before we begin, we first define the capabilities of the
attacker we are considering.
We assume that the attacker must go through an
edge device to access the SCADA network, and can-
not access the network just by tapping the wire. More
specifically, we assume that the attacker must pene-
trate some sort of physical boundary, which could be
as simple as the device’s own exterior, to access the
edge device’s hardware. Network attacks originat-
ing from outside the SCADA network are considered
SolvingtheGridDefender'sDilemma:TamperProtectionforDistributedCyber-PhysicalSystems
311

TDP
TIP A
TIP B
TIP C
2
4
Attacker?
Earthquake?
5
3
1
To substation
To remote devices
TEP
TEP
TEP
TEP
TEP
TEP
6
Response?
7
Figure 1: A diagram of the example given in Section 4.3.
First, a utility operator builds the tamper system using the
generation tool (Step 1), and then deploys the various com-
ponents to their proper locations in the network (Step 2).
When a TIP senses shaking (Step 3), it sends an alert to the
TDP (Step 4), which then uses it full information base to
decide exactly what is happening (Step 5). This decision is
then sent to the appropriate TEPs (Step 6), who then decide
the proper response to the event (Step 7).
out of scope, given the availability of techniques such
as encryption (Solomakhin, 2010) to handle these at-
tacks.
While TEDDI’s sensors monitor the device’s
physical boundary,
3
there are no limits to the tools an
attacker can use or the time they can take to penetrate
this boundary.
4.3 How TEDDI Works: An Example
To clarify how the pieces of TEDDI fit together, con-
sider the simple example illustrated in Figure 1:
1. A utility operator constructs a simple tamper sys-
tem consisting of a single TDP and three TIPs: A,
B, and C. The operator denotes that the TIPs are
equipped with an accelerometer as part of their
sensor set, and tells the system to watch out for
shaking as either part of an attack or an earth-
quake.
2. The TDP and TIPs programs are deployed, and
the TIPs begin monitoring their environment for
event indicators.
3. TIP A experiences intense shaking, causing its ac-
celerometer to exceed its threshold. A’s limited
factor graph (Section 4.4) knows that either an at-
tack or an earthquake is occurring, but it cannot
differentiate between the two possibilities without
knowing the state of other boxes in the system.
4. A sends an alert to the TDP about its situation, and
requests assistance on making a decision.
3
While we did not monitor any software alerts or device load in-
formation, many current intrusion detection systems already do
this, and we could easily adapt TEDDI to monitor both digital and
physical signals.
5. The TDP receives A’s alert and attempts to deter-
mine the overall state of the system. In doing so,
it finds that B and C have also experienced intense
shaking (and in turn, have also sent the TDP alerts
about potential tampering).
6. The widespread shaking causes the TDP’s factor
graph (Section 4.4) to decide that the shaking is
due to an earthquake. This decision is passed
along to the two TEPs associated with A.
7. A’s TEPs decide not to take any action for the time
being, since the utility wants to keep the system
running as long as possible.
4.4 TEDDI Factor Graphs
At the heart of our tamper decision engine is a fac-
tor graph (Frey, 2003) that looks for sequences within
its sensor data to determine what event is occurring
on the system. Our graph, as shown in Figure 2, is
constructed from two important datasets:
Events: The set E = {e
1
, . . . , e
j
} of events we want
to detect.
Indicators: The set I = {i
1
, . . . , i
k
} of phenomena
connected to the events in E. For example, if E
includes an earthquake in its set, I might include
shaking. The presence or absence of an indicator i
is calculated by looking at its corresponding sen-
sor s to see if the sensor reading has crossed an
operator-defined threshold.
We build our factor graph via an efficient three-
step process:
1. For each concerning event e
j
, the operator defines
the sequence of indicators that signals e
j
’s pres-
ence.
2. The operator then ranks the events by their impor-
tance, declaring which events are the most impor-
tant to detect.
3. Finally, the indicator sequences are arranged
within the factor graph in order of their impor-
tance.
Whenever we poll our sensors for data, we calcu-
late the presence of indicators based on this data, and
then run through our factor graph to see what events
are occurring, starting from the most-important event.
When we generate the final factor graph, we cre-
ate two versions: A full version for tamper decision
points, and a limited version for tamper information
points. We create the two versions to account for dif-
ferences in the information bases between decision
and information points:
SECRYPT2015-InternationalConferenceonSecurityandCryptography
312
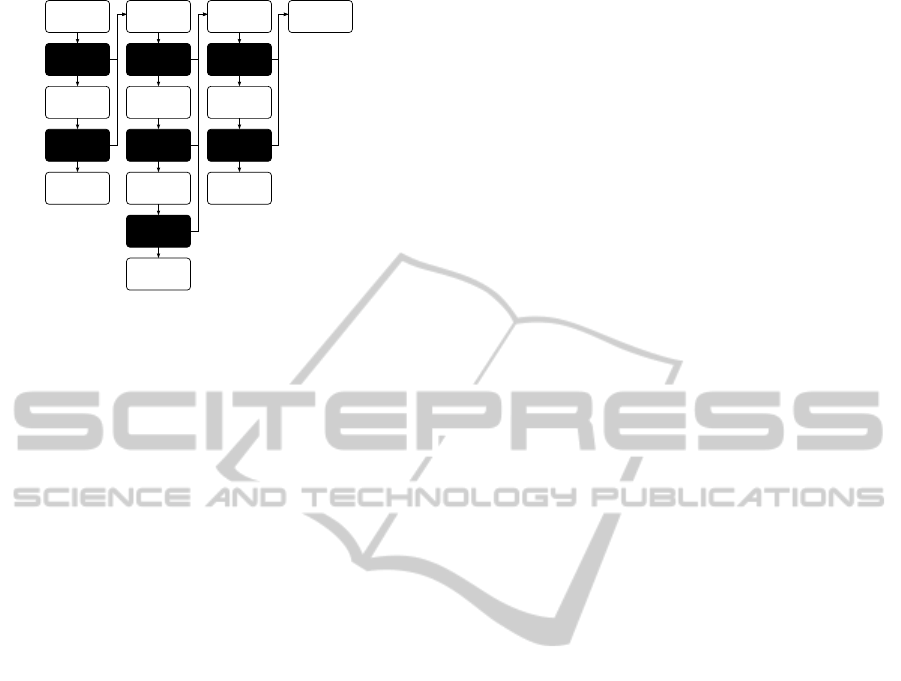
START
No Event
Event 1
Event 2
Event 3
Indicator 1?
Indicator 2?Indicator 3?
Indicator 1?
Indicator 4?
Indicator 1?
Indicator 5?
Y
N
YYY
YY
Y
N N
N
N
N
N
Figure 2: An example factor graph generated by our TEDDI
system. The blank nodes represent intermediate steps in
each event sequence.
• If an information source is only available to tam-
per decision points, sensors and indicators associ-
ated with that information source are not included
in the limited factor graph.
• If a tamper information point is unable to distin-
guish between two events due to a lack of infor-
mation, those events are combined in the limited
factor graph.
4.5 Tamper Information Points (TIPs)
Tamper information points are the eyes and ears of the
system, and are responsible for collecting the sensor
data needed for decision making. A TIP is assigned
to each edge device in the network, and lives in the
same location as that device (for example, in the same
cabinet) monitoring the surrounding environment.
Every few seconds, the TIP takes a snapshot of
its sensor values and analyzes this snapshot to see
what events, if any, are presently affecting the device.
When a sensor exceeds the threshold set by the opera-
tor, the corresponding indicator is considered present
for the purposes of our factor graph, and absent oth-
erwise. These values are used to construct the I set
for use in our factor graph, and also sent to a tamper
decision point to keep the decision point’s worldview
current and to alert the decision point that this TIP is
still active.
If the TIP is able to make an event decision by it-
self, it sends this decision to the appropriate tamper
enforcement points. However, the TIP only has a lim-
ited copy of the system’s factor graph, which means
the TIP is not always able to distinguish between cer-
tain events. In these cases, it sends a request to its
tamper decision point for assistance.
4.6 Tamper Decision Points (TDPs)
Tamper decision points live in higher-security areas
of a utility’s SCADA network, such as within a sub-
station, and they serve multiple TIPs within their ser-
vice area. TDPs are given a full copy of the system’s
factor graph, and they can access data from both from
the TIPs they serve and any external data sources they
query, which allows them to make a more-informed
tamper decision than a single TIP.
When a TDP receives an assistance request from
one of its TIPs, the TDP first tries to determine the
overall state of the area it monitors. It does this by
combining the data it receives from all of its TIPs to
see what sensor values are held by the majority of its
TIPs. If a TDP’s factor graph includes l indicators,
the TDP’s indicator state I
overall
is set as follows:
I
overall
= {maj(i
1
), maj(i
2
), . . . , maj(i
l
)} (1)
maj(i
p
) =
1 if the majority of TIPs
see i
p
as present
0 otherwise
(2)
Once the TDP calculates I
overall
, it combines the
data with the local indicators provided by the request-
ing TIP and runs the entire set through the full fac-
tor graph to calculate its own event probabilities and
make a final decision as to what event is occurring.
Two edge cases, however, may interfere with this pro-
cess:
• If a TIP stops reporting to the TDP, its data is
eventually declared stale, and the offending TIP
is removed from the summation. The TDP will
also run the factor graph with a “lost TIP” flag set
to see if further response if needed.
• If any of the ma j(i
p
) functions do not find a clear
majority (i.e. the TIPs are evenly split on sensor
p), the TDP can reach out to a second TDP for
assistance. The second TDP attempts to break the
tie by combining its information with that of the
first TDP, running the combined I
overall
through
its factor graph, and sending the result back to the
first TDP.
Once a decision is made, if an event is thought to
be present, the appropriate tamper enforcement points
are alerted to initiate a response.
4.7 Tamper Enforcement Points (TEPs)
Tamper enforcement points are positioned between
the TIP and its TDP on the SCADA network, and they
SolvingtheGridDefender'sDilemma:TamperProtectionforDistributedCyber-PhysicalSystems
313

are responsible for responding to decisions made by
these devices.
For each TIP, an edge TEP is installed at the TIP’s
location, and a central TEP is placed closer to the
TIP’s TDP. The two TEPs allow us to execute re-
sponses in the location that makes the most sense in
the current context. For example, erasing secret data
on the edge device is best handled by the edge TEP,
while filtering network traffic might be more appro-
priate for the central TEP.
The TEP is not limited to making a single re-
sponse to a decision, but instead can execute an or-
dered series of responses to mitigate any problems.
Exactly which responses to take, and what order to
take them in, is predetermined by the system admin-
istrator. In cases where responses need to be taken on
both the edge and central TEPs, the TEPs coordinate
their response to ensure that responses occur in the
proper order.
5 ADVANTAGES OF TEDDI
In this section, we compare TEDDI to selected prior
works within the context of an example usage sce-
nario, and highlight how TEDDI is able to solve the
grid defender’s dilemma outlined in Section 2.1.
5.1 An Expanded Example
Suppose a utility wants to monitor a set of edge de-
vices deployed in a section of their SCADA network.
The devices are all installed inside metal cabinets, and
are all equipped with a small set of sensors, includ-
ing an accelerometer, light sensor, temperature sen-
sor, and a switch that indicates whether or not the cab-
inet door is open.
The utility is particularly concerned about bypass
attacks, in which an attacker breaks the lock off of an
edge device cabinet, and then opens the cabinet and
replaces the edge device with a device of their choos-
ing, such as an exploit-equipped laptop. (This attack
scenario was initially presented to us by one of our
industry partners.) The attacker could also enter the
cabinet in other ways, such as by drilling through it
or cutting into it with a torch, but breaking the lock is
particularly worrisome because it accesses the cabinet
through it front door, just as a utility service techni-
cian would.
In addition to TEDDI, the utility is considering
three other protection systems for their scenario: The
IBM 4765 Cryptographic Coprocessor (IBM, 2011),
the SCADAHawk system (Sousan et al., 2013), and
the Response and Recovery Engine (RRE) (Zonouz
et al., 2014).
A summary of our comparison results is shown in
Table 1.
5.2 Setup Requirements
As stated in Section 2.1, grid operators do not have a
lot of time or data at their disposal when configuring
a SCADA protection system, and need to be able to
get things up and running quickly. This requirement
causes problems for the RRE, since it requires that the
operator construct a full attack response tree (ART),
complete with every potential step taken by an at-
tacker and the responses that correspond to each step,
for each security goal they want to maintain (Zonouz
et al., 2014). While SCADAHawk does not place as
heavy a burden on the operator, it suffers from the
need to capture the behavior snapshots it needs for
anomaly detection (Sousan et al., 2013). This step is
crucial to guard against false positives, but if the util-
ity does not have data on hand, SCADAHawk must
run for a prolonged period to collect the data it needs.
In contrast, TEDDI tries to minimize the prelimi-
nary work it requires, and begins monitoring the net-
work the minute it is installed. Our factor graphs only
require the event and indicator sets, as well as the re-
lationship between the two (e.g., what indicators are
generated by each event). In this case, the event rela-
tionships can be defined as follows:
• If the light sensor is triggered while the cover
switch is closed, this indicates that the box has
been breached in an inappropriate manner, a tell-
tale sign that an attack is going on. The pres-
ence of shaking indicates that a drill attack is in
progress, whereas a high temperature alert indi-
cates a torch is being used.
• A “normal” bypass attack can be defined as fol-
lows: It starts with shaking (from smashing the
cabinet lock), continues with the cover switch
opening, and concludes with light hitting the light
sensor. This simple sequence can quickly be en-
coded in our factor graph.
• The above bypass attack might look similar to a
technician visit, but there is a big difference: A
utility generally knows when its boxes are being
serviced, and has a record of this within its inci-
dent database. We introduce this information as
an indicator in our full factor graph (with a cor-
responding mechanism that queries the incident
database and serves as our sensor), and combine
the bypass and technician events in our limited
factor graph.
SECRYPT2015-InternationalConferenceonSecurityandCryptography
314

Table 1: A summary of our discussion in Section 5.
Security Easy Detects Physical Event Flexible Solves Grid
Solution Setup Tampering Range Response Defender’s Dilemma?
IBM 4765 No Yes Limited No No
SCADAHawk No No Wide N/A No
RRE No No Wide Yes No
TEDDI Yes Yes Wide Yes Yes
With these rules in place, TEDDI can start moni-
toring the SCADA network immediately.
The IBM 4765 is the simplest of the four pro-
tection systems to set up, as all of its physical pro-
tections are in place and armed from the start (IBM,
2011). While the device is initially equipped to per-
form “cryptographic functions common in the finance
industry and in Internet business applications” (IBM,
2011), it is also possible to create custom software
for the device if needed. However, it is a device-
centered protection system that provides no protec-
tion to a SCADA network if it gets bypassed.
5.3 Event Detection
There are two elements to consider when thinking
about event detection: How quickly a system can re-
spond to an event, and the range of events a system
can detect. SCADAHawk and the RRE are reac-
tive systems, and look for evidence that an attacker
has already breached the network, either through IDS
alerts (Zonouz et al., 2014) or anomalous system be-
havior (Sousan et al., 2013). Neither SCADAHawk
nor the RRE look for physical tamper events, so in
the case of the bypass attack, the attacker is on the
network and putting their attack plan into action by
the time these two systems notice a problem. By ob-
serving physical events, however, TEDDI can take a
proactive stance against attacks. In the above sce-
nario, for example, TEDDI’s sensors could detect the
shaking caused by the chiseling and the opening of
the cabinet’s door, deduce that an attack may be oc-
curring, and start taking protective measures.
The IBM 4765 responds to physical events as
well (IBM, 2011), but its lack of context informa-
tion can lead to costly false positives, since the de-
vice is unable to say exactly what event triggered its
sensors and thus must assume the worst. TEDDI, on
the other hand, takes advantage of its distributed na-
ture to obtain this context information and differenti-
ate between benign and malicious events. If we again
consider the bypass attack, the affected information
can send an alert to its decision point, which can then
query an external database to see if we expect a tech-
nician to be shaking the box.
5.4 Response Strategy
Differentiating between events is not useful unless
we can adjust our system’s response appropriately.
Most tamper protection systems, however, suffer from
one of two major flaws in this area: They either
only attempt to detect a problem, such as SCADA-
Hawk (Sousan et al., 2013), or they have a single “nu-
clear” response to any sort of tampering, such as the
IBM 4765 (IBM, 2011).
To protect the grid, however, we require a flexible
response strategy that can deal with events of varying
concern. The RRE supports this by connecting re-
sponses with specific nodes within its attack response
trees (Zonouz et al., 2014), while TEDDI equips its
TEPs with ordered response strategies that it can take
when certain events are seen. Exactly what the TEP
does depends on the event, and the response could
range from stopping the device completely to not in-
tervening at all.
5.5 Solving the Dilemma
A summary of our comparison results is shown in Ta-
ble 1. Overall, TEDDI is the system that is best suited
to solve the grid defender’s dilemma: It it easy to
configure, can differentiate between important tamper
events, and can tailor its responses to suit the event at
hand.
6 NEXT STEPS
Currently, we have built and tested a small TEDDI
prototype (1 TDP, 5 TIPs), and have demonstrated
how event decisions can change based on the status
of the edge devices. We plan to expand our proto-
type and deploy it on a realistic grid network, and
are working with the electrical network management
team here at Dartmouth to construct this network.
Because TEDDI requires that a customized pro-
gram be built for every TIP, TDP, and TEP in the sys-
tem, we are also building a generation tool that will
perform this task. This tool includes a decision point
layout tool that calculates the optimal locations to
SolvingtheGridDefender'sDilemma:TamperProtectionforDistributedCyber-PhysicalSystems
315

place TDPs, and will also suggest potential responses
for common or similar events.
7 CONCLUSIONS
In this paper, we highlighted the security threat posed
by edge devices in a SCADA network, and pro-
posed our TEDDI system as a means of addressing
this threat. SCADA networks must handle a wide
range of tamper events while supporting a specialized
combination of security goals, and we showed how
TEDDI’s distributed nature, use of factor graphs, and
flexible approach to tamper response give it a distinct
advantage in handling these event and goals.
ACKNOWLEDGEMENTS
This material is based upon work supported by the
Department of Energy under Award Number DE-
OE0000097. The views expressed in this paper are
those of the authors, and do not necessarily reflect the
views of the sponsors.
REFERENCES
Atmel Corporation (2015). Atmel Trusted Platform Mod-
ule. Available at: http://www.atmel.com/products/se
curity-ics/embedded/default.aspx (Accessed 2 March
2015).
Berthier, R. and Sanders, W. (2013). Monitoring advanced
metering infrastructures with Amilyzer. In Cyberse-
curity of SCADA and Industrial Control Systems.
Cao, P., Badger, E., Kalbarczyk, Z., Iyer, R., and Slagell, A.
(2015). Preemptive intrusion detection: Theoretical
framework and real-world measurements. In Sympo-
sium and Bootcamp on the Science of Security.
Desai, A. (2013). Anti-counterfeit and anti-tamper imple-
mentation using hardware obfuscation. Master’s the-
sis, Virginia Polytechnic Institute and State Univer-
sity.
Dragone, S. (2013). Physical security protection based on
non-deterministic configuration of integrated micro-
electronic security features. In The First International
Cryptographic Module Conference.
Frey, B. (2003). Extending factor graphs so as to unify di-
rected and undirected graphical models. In Proceed-
ings of the Nineteenth Conference on Uncertainty in
Artificial Intelligence.
IBM (2011). IBM 4765 PCIe Data Sheet. Available at: htt
p://www-03.ibm.com/security/cryptocards/pciecc/pdf
/PCIe
Spec Sheet.pdf (Accessed 2 March 2015).
Organization for the Advancement of Structured Informa-
tion Standards (2013). eXtensible Access Control
Markup Language (XACML) Version 3.0. Available
at: http://docs.oasis-open.org/xacml/3.0/xacml-3.0-co
re-spec-os-en.pdf (Accessed 2 March 2015).
Pearl, J. (1988). Probabilistic Reasoning in Intelligent
Systems: Networks of Plausible Inference. Morgan
Kauffman.
Peterson, D. (2013). Why Crain / Sistrunk vulns are a big
deal. Digital Bond. Available at: http://www.digitalb
ond.com/blog/2013/10/16/why-crain-sistrunk-vulns-a
re-a-big-deal/ (Accessed 2 March 2015).
Reeves, J. and Smith, S. W. (2014). Tamper event detec-
tion on distributed devices in critical infrastructure. In
ICMC 2014: The Second International Cryptographic
Module Conference.
Roblee, C., Berk, V., and Cybenko, G. (2005). Large-scale
autonomic server monitoring using process query sys-
tems. In IEEE International Conference on Autonomic
Computing.
Smith, R. (2014). U.S. risks national blackout from small-
scale attack. Wall Street Journal. Available at: http:
//online.wsj.com/news/articles/SB100014240527023
04020104579433670284061220 (Accessed 2 March
2015).
Smith, S. W., Palmer, E., and Weingart, S. (1998). Using
a high-performance, programmable secure coproces-
sor. In Second International Conference on Financial
Cryptography.
Smith, S. W. and Weingart, S. (1999). Building a
high-performance, programmable secure coprocessor.
Computer Networks, 31(1999):831–860.
Solomakhin, R. V. (2010). Predictive YASIR: High security
with lower latency in legacy SCADA. Master’s thesis,
Dartmouth College.
Sousan, W. L., Zhu, Q., Gandhi, R., and Mahoney, W.
(2013). Smart grid tamper detection using learned
event patterns. In Pappu, V., Carvalho, M., and Parda-
los, P., editors, Optimization and Security Challenges
in Smart Power Grids, Energy Systems, pages 99–
115. Springer Berlin Heidelberg.
Tygar, J. D. and Yee, B. (1994). Dyad: A system for us-
ing physically secure coprocessors. In Technological
Strategies for the Protection of Intellectual Property
in the Networked Multimedia Environment.
Valdes, A. and Skinner, K. (2001). Probabilistic alert corre-
lation. In Recent Advances in Intrusion Detection.
Wang, Y. and Hauser, C. (2011). An evidence-based
Bayesian trust assessment framework for critical-
infrastructure decision processing. In Fifth Annual
IFIP Working Group 11.10 International Conference
on Critical Infrastructure Protection.
Zonouz, S., Khurana, H., Sanders, W., and Yardley, T.
(2014). RRE: A game-theoretic intrusion response
and recovery engine. IEEE Transactions on Parallel
and Distributed Systems, 25(2):395–406.
Zonouz, S., Rogers, K., Berthier, R., Bobba, R., Sanders,
W., and Overbye, T. (2012). SCPSE: Security-
oriented cyber-physical state estimation for power
grid critical infrastructures. IEEE Transactions on
Smart Grid, 3(4):1790–1799.
SECRYPT2015-InternationalConferenceonSecurityandCryptography
316
