
Parallel Applications and On-chip Traffic Distributions: Observation,
Implication and Modelling
Thomas Canhao Xu, Jonne Pohjankukka, Paavo Nevalainen, Tapio Pahikkala and Ville Lepp
¨
anen
Department of Information Technology, University of Turku, Joukahaisenkatu 3-5 B, 20520, Turku, Finland
Keywords:
Distributed Architectures, Parallel Computing, High Performance Computing, Communication Networks,
Performance Evaluation, Multicore Systems.
Abstract:
We study the traffic characteristics of parallel and high performance computing applications in this paper. Ap-
plications that utilize multiple cores are more and more common nowadays due to the emergence of multicore
processors. However the design nature of single-threaded applications and multi-threaded applications can
vary significantly. Furthermore the on-chip communication profile of multicore systems should be analysed
and modelled for characterization and simulation purposes. We investigate several applications running on a
full system simulation environment. The on-chip communication traces are gathered and analysed. We study
the detailed low-level profiles of these applications. The applications are categorized into different groups
according to various parallel programming paradigms. We discover that the trace data follow different param-
eters of power-law model. The problem is solved by applying least-squares linear regression. We propose a
generic synthetic traffic model based on the analysis results.
1 INTRODUCTION
Fast developing semiconductor manufacturing tech-
nology has provided the industry with billions of tran-
sistors on a single chip. At the same time, the number
of cores integrated on a chip is increasing rapidly for
multicore processors. It is difficult to imagine multi-
core smart phones a decade ago, however nowadays
more and more phones and tablets are equipped with
multicore processors with 4 or even 8 cores (Medi-
atek, 2015). Multicore processors are penetrating into
the smart electronics as well, smart homes with smart
devices such as television, washing machine, refriger-
ator and even light bulb. Besides embedded devices,
multicore concept is expanding in the traditional field
of desktop and server: We can purchase commercial
general-purpose server processors with tens of cores
(Intel, 2015). It can be expected that in the future,
multicore processors will integrate tens or even hun-
dreds of cores on a single chip. On-chip interconnec-
tion networks, such as tree, mesh and torus are pro-
posed for massive high scalable multicore processors
(Dally and Towles, 2003) ((Xu et al., 2012b). Paral-
lel and high performance computing applications are
more common nowadays thanks to the widespread
multicore processors.
A simulation environment is usually used to evalu-
ate the performance of on-chip networks, and experi-
ments are usually conducted with different traffic pro-
files. The traffic pattern can be synthetic which rep-
resents an abstract model of transmitted data packets
among nodes, or realistic which takes actual applica-
tions running on the system. Synthetic traffic models
include uniform random, transpose, bit-complement,
bit-reverse and hotspot etc. (Dally and Towles, 2003).
The uniform random traffic, for example, generates
packets from each node in equally random possibility
with random destinations. Therefore the source and
destination nodes in a packet are random and uniform.
It is obvious that the number of packets injected to the
network for all 64 nodes are basically the same, which
should be around 1.5625% (
1
/64). Previous studies
show that the traffic pattern for different applications
can vary significantly ((Xu et al., 2013) (Xu et al.,
2012a), making the evaluation process more challeng-
ing. Several traffic models are proposed by various
research groups (Pekkarinen et al., 2011) (Liu et al.,
2011). Specific task graph data are extracted from
multimedia and signal processing tasks. However it
can be difficult to reflect the performance of the multi-
core processor since applications are usually executed
with processes and threads, and thus have different
communication pattern compared with task graph.
Traffic models based on empirical application data
443
Xu T., Pohjankukka J., Nevalainen P., Leppänen V. and Pahikkala T..
Parallel Applications and On-chip Traffic Distributions: Observation, Implication and Modelling.
DOI: 10.5220/0005553604430449
In Proceedings of the 10th International Conference on Software Engineering and Applications (ICSOFT-EA-2015), pages 443-449
ISBN: 978-989-758-114-4
Copyright
c
2015 SCITEPRESS (Science and Technology Publications, Lda.)
0
10
20
30
40
50
60
70
80
90
Time
0
10
20
30
40
50
60
Node ID
0
20000
40000
60000
80000
100000
120000
140000
160000
180000
Packets
(a) Barnes-Hut
0
10
20
30
40
50
60
70
80
90
Time
0
10
20
30
40
50
60
Node ID
0
20000
40000
60000
80000
100000
120000
140000
Packets
(b) Radix Sort
0
10
20
30
40
50
60
70
80
90
Time
0
10
20
30
40
50
60
Node ID
0
10000
20000
30000
40000
50000
60000
Packets
(c) Raytrace
0
10
20
30
40
50
60
70
80
90
Time
0
10
20
30
40
50
60
Node ID
0
10000
20000
30000
40000
50000
60000
70000
Packets
(d) Fast Multipole Method (FMM)
0
10
20
30
40
50
60
70
80
90
Time
0
10
20
30
40
50
60
Node ID
0
5000
10000
15000
20000
25000
30000
Packets
(e) LU Matrix Decomposition (LU)
0
10
20
30
40
50
60
70
80
90
Time
0
10
20
30
40
50
60
Node ID
0
10000
20000
30000
40000
50000
60000
70000
80000
Packets
(f) Swaptions
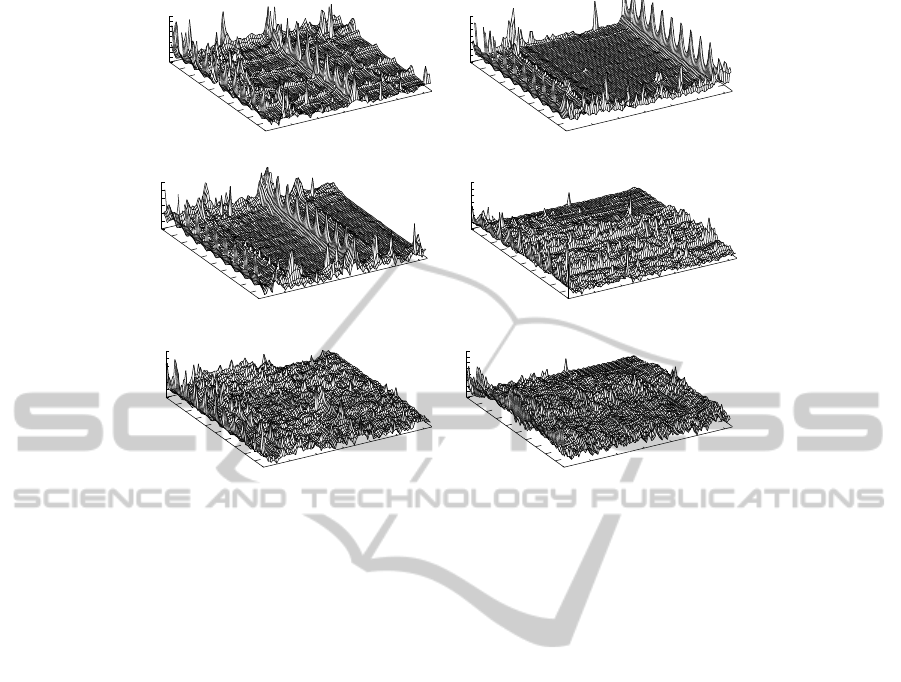
Figure 1: Injected packets (Z-axis) for 64 nodes (X-axis) of several applications. The percentage of executed cycles/times is
shown in Y-axis.
were analysed in (Soteriou et al., 2006), (Bahn and
Bagherzadeh, 2008), (Bogdan et al., 2010) and (Badr
and Jerger, 2014). In (Soteriou et al., 2006), full sys-
tem simulation is used to gather traffic traces. The
model considers both spatial and temporal character-
istic of the traffic. They also proposed a process of
generating synthetic traces based on the application
traffic. Experiments were conducted based on three
system configurations: 4-core TRIPS processor, 16-
core traditional processor and 16-core cache coherent
processor (4×4 mesh). Jun Ho Bahn et al. extended
the previous research with 7×7 mesh network (Bahn
and Bagherzadeh, 2008). Both cache coherent pro-
cessors in the two researches were based on the MSI
coherence protocol. On the other hand, authors in
(Badr and Jerger, 2014) extended the aforementioned
research with emphasis on more advanced MOESI
coherence protocol, despite the fact that a 16-core
processor is simulated. A statistical model based on
quantum-leap was proposed by (Bogdan et al., 2010),
which can account for non-stationarity observed in
packet arrival processes. The multi-fractal approach
is shown to have advantages in estimating the proba-
bility of missing deadlines in packets. In this paper,
we proposed a synthetic traffic model based on analyt-
ical results of real applications. We investigate several
applications which are widely used in parallel bench-
marks. The traffic patterns of these applications are
discussed by using 64-core cache-coherent processor
with MOESI protocol. Mathematical models are pro-
posed based on the analysis of trace results.
2 DATA ANALYSIS
METHODOLOGY
We collect realistic traffic patterns based on trace
data of applications running on a full system simula-
tion platform (Magnusson et al., 2002) (Martin et al.,
2005). We simulate a multicore processor with 64 Ul-
traSPARC III+ cores running at 2GHz (8×8 mesh).
Each node in the mesh consists of a processor core
and shared caches. The private L1 cache is split into
instruction and data cache, each 16KB with 3-cycle
access delay. The unified shared L2 cache is split into
64 banks (1 bank per node), each 256KB with 6-cycle
access delay. The simulated memory/cache architec-
ture mimics Static Non-Uniform Cache Architecture
(SNUCA) (Kim et al., 2002), where MOESI cache
coherence protocol is implemented (Patel and Ghose,
2008). The applications from SPLASH-2 (Woo et al.,
1995) and PARSEC (Bienia et al., 2008) with 64
threads are running on Solaris 9 operating system
with 4GB memory.
The detailed traffic results in terms of injected
packets from different nodes over the execution pe-
riod are illustrated in Figure 1. The application de-
scription, executed cycles and transmitted packets are
ICSOFT-EA2015-10thInternationalConferenceonSoftwareEngineeringandApplications
444
0
2
4
6
8
10
12
14
10 20 30 40 50 60
0
20
40
60
80
100
Node injection percentage
Cumulative
(a) Barnes-Hut
0
5
10
15
20
25
10 20 30 40 50 60
0
20
40
60
80
100
Node injection percentage
Cumulative
(b) Radix Sort
0
2
4
6
8
10
12
14
16
18
10 20 30 40 50 60
0
20
40
60
80
100
Node injection percentage
Cumulative
(c) Raytrace
0
2
4
6
8
10
10 20 30 40 50 60
0
20
40
60
80
100
Node injection percentage
Cumulative
(d) Fast Multipole Method
0
1
2
3
4
5
6
7
10 20 30 40 50 60
0
20
40
60
80
100
Node injection percentage
Cumulative
(e) LU Matrix Decomposition
0
1
2
3
4
5
6
7
10 20 30 40 50 60
0
20
40
60
80
100
Node injection percentage
Cumulative
(f) Swaptions
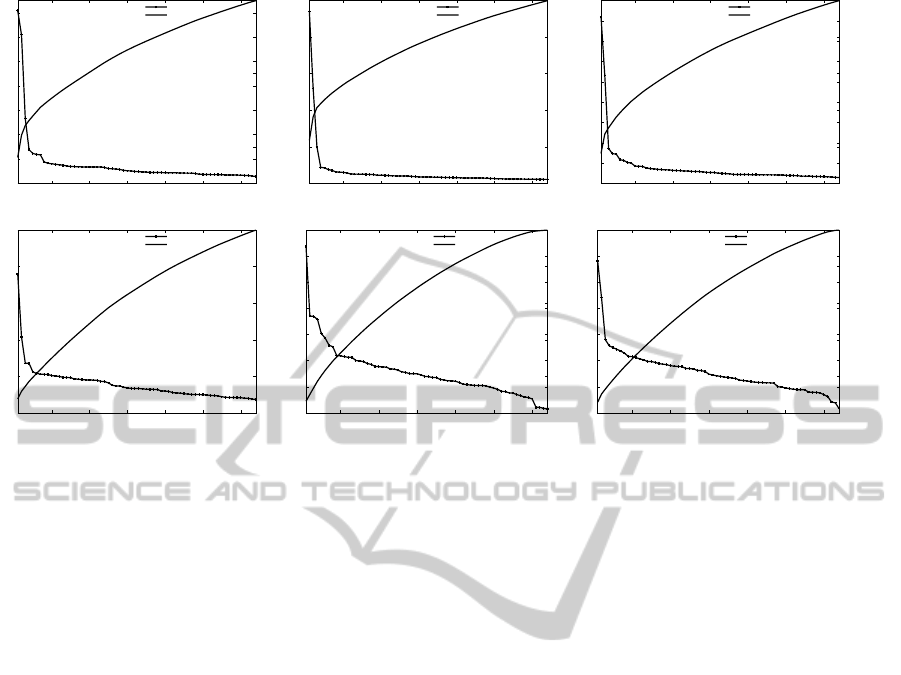
Figure 2: Sorted packet injection percentage (left Y-axis) and accumulated percentage (right Y-axis) for 64 nodes (X-axis) of
several applications.
shown in Table 1. It is obvious that the traffic of
realistic applications are significantly different than
uniform random traffic. We can get the impression
that a small amount of nodes generated considerable
amount of traffic. In addition, there are certain pat-
terns for the traffic. For instance, applications such as
Barnes − Hut, Radix Sort and Raytrace have several
nodes with significant higher amount of traffic than
other nodes. Regular traffic spikes can be observed
for these hot-spot nodes, as well as other nodes. Sev-
eral phases can be discovered with regular time inter-
vals. On the other hand, the other applications did
not shown significant regular and hot-spot traffic. In
terms of packet per cycle (Table 1), the applications
with significant hot-spot and regular traffic have lower
injection rates (0.1024 to 0.1561) than the remaining
applications (0.2197 to 0.5850). The difference can
be explained by different programming model used
by applications. We will analyse typical models and
their relations to the on-chip traffic in the next section.
Figure 2 demonstrated the percentages of injected
packets by different nodes for several applications.
For example, one node in Radix Sort generated 23.5%
of all traffic, where the top 4 nodes out of 64 injected
43.7% of all packets. This phenomenon is similar for
other applications as well: a major portion of traffic
are concentrated in a few nodes, while the remain-
ing nodes injected relatively small amount of traffic.
We notice that the phenomena is similar as referred
by the power laws, Pareto distribution and zipf’s law
(Newman, 2005), in which most of the effects come
from a small portion of the causes. The traffic patterns
are similar to the hot-spot traffic. However it is note-
worthy that some applications, e.g. Barnes − Hut,
Radix Sort and Raytrace have more significant hot-
spot nodes, while other applications show less signif-
icant hot-spot traffic. Table 1 shows the traffic injec-
tion percentage of top 4 nodes. Applications such as
FMM, LU and Swaptions have relatively lower hot-
spot traffic: accumulated traffic by top 4 nodes con-
tributed 15% to 25% of all traffic, where the node
with the highest injection rate generated 5.8% to 9.8%
packets. For other applications, higher hot-spot traffic
can be observed: top 4 nodes contributed 33% to 43%
of all packets, while the top sender injected 14.1% to
23.5% traffic.
3 PARALLEL PROGRAMMING
PARADIGMS AND ON-CHIP
TRAFFIC
The on-chip traffic pattern of different applications
suggested that there are huge difference among ap-
plications. Indeed, the difference can be affected by
hardware such as cache coherence protocol, cache
size, instruction set architecture and cache/memory
architecture. However the software aspect can play a
more important role here. For example, parallel ap-
plications can be categorized into several program-
ming paradigms, where each paradigm is a class of
ParallelApplicationsandOn-chipTrafficDistributions:Observation,ImplicationandModelling
445

Table 1: Profiles of different applications. TI%/4 and TI%/60 mean total injection percentage of top 4 and 60 nodes respec-
tively. PPC (Packet Per Cycle).
Application
Cycles Packets
PPC Category
Injection % of Top 4 nodes TI%/4, TI%/60
Barnes-Hut
1146.7M 160.5M
0.1399 1
14.1%, 12.1%, 5.3%, 2.8% 34.3%, 65.7%
Radix Sort
1064.9M 109.1M
0.1024 1
23.5%, 13.0%, 5.0%, 2.2% 43.7%, 56.3%
Raytrace
399.5M 62.4M
0.1561 1
16.4%, 10.6%, 3.4%, 2.9% 33.3%, 66.7%
Fast Multipole Method
168.7M 57.4M
0.3402 2
7.6%, 4.2%, 2.7%, 2.7% 17.2%, 82.8%
LU Matrix Decomposition
98.1M 35.0M
0.3569 2
6.3%, 3.7%, 3.7%, 3.6% 17.3%, 82.7%
Swaptions
184.6M 108.0M
0.5850 2
5.8%, 4.4%, 2.8%, 2.6% 15.6%, 84.4%
methods/algorithms that have similar control struc-
tures (Rauber and Rnger, 2010). The detailed analy-
sis of the paradigms are not in the scope of this paper.
We only study the relationship of different paradigms
and the impact of on-chip traffic. Common paradigms
that are used in parallel programming include: Single
Program Multiple Data (SPMD), Master-Slave (Pro-
cess Farm), Divide and Conquer, Phase Parallel, Data
Pipelining and Hybrid Models
The choice of paradigm is determined by the given
problem, as well as the limitations of hardware re-
sources. Furthermore the boundaries between dif-
ferent paradigms can be fuzzy, in some applications
several paradigms could be used together in a hy-
brid way. For example, the Master − Slave model
consists of a master and several slaves (Mostaghim
et al., 2008). Usually the master is responsible in
splitting the problem into smaller tasks, and allocate
tasks to slave processes. The result or partially of
the results are gathered by the master periodically. In
case the results are gathered in an interval, the traffic
can show in several phases (Perelman et al., 2006).
Divide and Conquer is a special case of Master −
Slave, where problem decomposition is performed
dynamically. Many applications such as image pro-
cessing, signal processing and graphic rendering uti-
lize Master − Slave, Divide and Conquer and Phase
Parallel models. SPMD is another commonly used
paradigm to achieve data parallelism, where each pro-
cess executes basically the same code but on differ-
ent data (Lee et al., 2014). It usually involves split-
ting the application data to different processor cores.
Many physical and mathematical problems have reg-
ular data structure which allows the data to be dis-
tributed to processors uniformly. As a result, the traf-
fic hot-spot is less common in SPMD compared with
other paradigms such as Master − Slave. Based on
the analysis, we classify the applications into two cat-
egories:
1. Master-Slave, Divide and Conquer, Phase Parallel
paradigms; relatively significant hot-spot and/or
phase (bursty) traffic; relatively low packet per cy-
cle; higher average MD than UR traffic and cat-
egory 2; distance between packets is generally
shorter than category 2
2. SPMD paradigm; relatively insignificant hot-
spot and/or phase (bursty) traffic; relatively high
packet per cycle; higher average MD than UR
traffic, but lower than category 1; distance be-
tween packets is longer than category 1
It is noteworthy that the classification is general
and non-specific since the border between two cate-
gories can be fuzzy. Furthermore the categorization
cannot cover all applications.
4 GENERIC SYNTHETIC
TRAFFIC MODEL
4.1 Power Law
We now give a short introduction into power law dis-
tribution and show that some of our data sets tend to
follow the power law distribution. Mathematically, a
quantity x obeys a power law if it is drawn from a
probability distribution
p(x) ∝ x
−α
, (1)
where α is a constant called the scaling parameter
of the power law distribution. The process of fitting
empirical distributions into power law distribution in-
volves solving the scaling parameter α and some nor-
malization constant. The tool most often used for this
task is the simple frequency histogram of the random
variable X. The common way to probe for power-law
behavior is to construct the frequency histogram of
the random variable X, and plot that histogram into
doubly logarithmic axes. If in doing so one discov-
ers a distribution that approximately falls on a straight
line, then we can say that the distribution of the ran-
dom variable X tends to follow a power law distribu-
tion.
4.2 Least Squares Fitting
In our case, the quantity of interest X is a discrete
random variable for which we have
p(x) = Pr(X = x) = Cx
−α
n
∑
i=1
p(x
i
) =
n
∑
i=1
Pr(X = x
i
) =
n
∑
i=1
Cx
−α
i
= 1,
(2)
ICSOFT-EA2015-10thInternationalConferenceonSoftwareEngineeringandApplications
446
0 0.5 1 1.5 2 2.5 3 3.5 4 4.5
−1
−0.5
0
0.5
1
1.5
2
2.5
3
ln X
ln P(X)
Log−log plot of: Category 1, A = −0.66751, b = 2.2432 , R
2
= 0.93343
Log−log values of empirical distribution
Linear regression fit
(a)
0 10 20 30 40 50 60 70
0
2
4
6
8
10
12
14
16
18
20
X
P(X)
Category 1, α = 0.66751, C = 9.4236 , R
2
= 0.93343
Empirical distribution
Power−law fit
(b)
0 0.5 1 1.5 2 2.5 3 3.5 4 4.5
−1.5
−1
−0.5
0
0.5
1
1.5
2
ln X
ln P(X)
Log−log plot of: Category 2, A = −0.52276, b = 1.9869 , R
2
= 0.83119
Log−log values of empirical distribution
Linear regression fit
(c)
0 10 20 30 40 50 60 70
0
1
2
3
4
5
6
7
8
X
P(X)
Category 2, α = 0.52276, C = 7.2926 , R
2
= 0.83119
Empirical distribution
Power−law fit
(d)
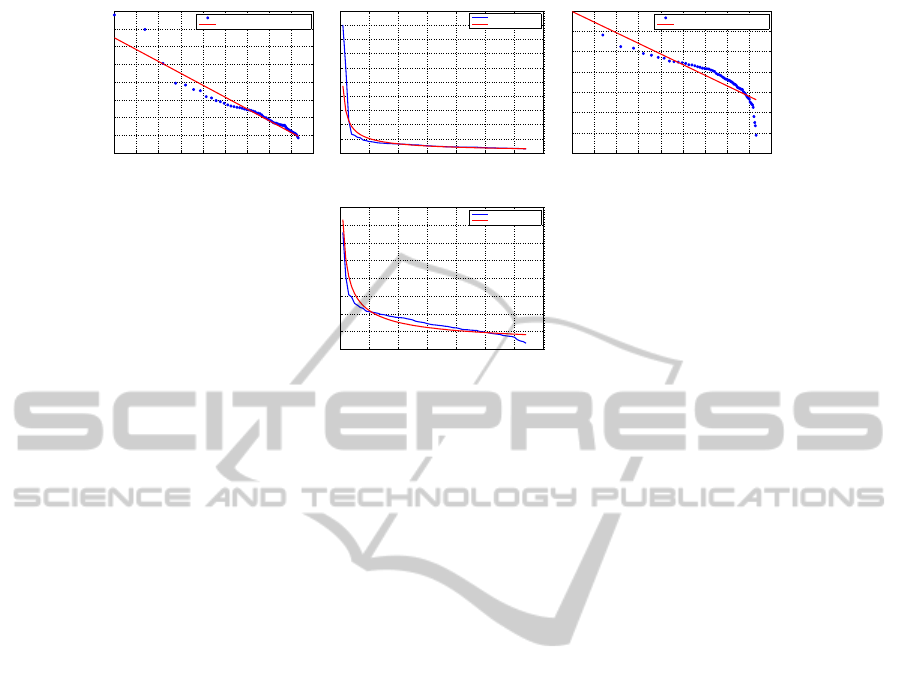
Figure 3: The log-log plot and power law fit for two categories of applications.
where C is the normalization constant. Our fitting pro-
cess now involves solving the values of α and C for
Equation 2. By taking the logarithm from both sides
of the first part of Equation 2 we get
ln p(x) = −α ln x + lnC.
Now if we set ln p(x) = Z, lnx = Y, −α =
A, lnC = b we get
Z = AY + b. (3)
We notice that Z is a linear function of Y so our
problem has been converted into solving the slope
A and bias term b that satisfy the Equation 3. In
case there is no true linear dependency between the
variables Y and Z which are functions of the ob-
served values x
1
,...,x
n
and corresponding probabil-
ities p(x
1
),..., p(x
n
), we can not get correct fitting.
Fortunately, this is not necessary for our purposes
since we are only interested in making an estimation
of the power law behaviour of the data set. For this
estimation we can use the least-squares linear regres-
sion for solving A and b and for these we have
Z ≈ AY + b,
for all our observed data points x
1
,...,x
n
, which
is good enough for our purposes. Let us now
introduce some new notation we need for solv-
ing A and b in Equation 3. Let 1
1×n
=
(1,1,..., 1), z = (ln p(x
1
),...,ln p(x
n
)) ∈ R
n
, y =
(lnx
1
,ln x
2
,...,ln x
n
) ∈ R
n
and w = (b, A). Now we
define the n × 2 matrix
X
a
=
1
T
1×n
y
T
n×2
,
where x
T
denotes the transpose of vector x. We can
now write the Equation 3 in the matrix form for our n
observations as
z
T
= X
a
w
T
. (4)
Our solution by using least-squares linear regres-
sion for the weights w in 4 is given by the equation
w = X
†
a
z
T
,
where X
†
a
=
X
T
a
X
a
−1
X
T
a
is the pseudo-inverse of the
matrix X
a
. We can now obtain α and C straightfor-
wardly from w = (b,A), by noting that α = −A and
C = e
b
. Hence we have now solved the needed pa-
rameters for Equations 2.
We can summarize the implemented procedure
for the trace data in the following main three steps:
First, calculate the vectors z = (ln p(x
1
),...,ln p(x
n
))
and y = (lnx
1
,...,ln x
n
). Second, construct the ma-
trix X
a
=
1
T
1×n
y
T
and the pseudo-inverse X
†
a
=
X
T
a
X
a
−1
X
T
a
. Third, solve the weight vector w =
(b,A) by w = X
†
a
z
T
and set C = e
b
and α = −A. The
results for the two categories of applications are illus-
trated in Figure 3.
Based on the fitting results of the traffic traces,
we propose a generic traffic modelling algorithm for
the on-chip parallel applications. The application cat-
egory and simulated cycles are determined before-
hand, then node injection rates are allocated to dif-
ferent nodes corresponding to the fitting function ran-
domly. In case of category 1 applications, two nodes
with highest injection rates are assigned with bursty
traffic patterns with Gaussian function repeating for
ten times (see Figure 1(a) to 1(c)), while other nodes
maintain a uniform injection rate according to the
ParallelApplicationsandOn-chipTrafficDistributions:Observation,ImplicationandModelling
447

packet per cycle metric and simulated cycles. In case
of category 2 applications, light bursty traffic, i.e.
peak traffic rate less than three times of the average,
are added to nodes randomly.
5 FUTURE WORK
We plan to try different alternative distributions for
the data sets, especially for the category 2 data sets,
because power law distribution was less suitable for
them than for the category 1 data sets. One possibil-
ity is to use piecewise functions so that we fit different
power law distributions for different regions of values
of X. This corresponds to fitting a piecewise linear
function in the log-log domain of the data sets. We
also note that most of the data points in the log-log
domains in our tests gathered around higher values of
the ln X-axis with some outliers in the low-end of the
axis. This means that the high-end points dominate
the fitting process of least-squares method. We could
give more importance to the low-end points by weigh-
ing the low-end points more than high-end points.
This approach will also be tried in future work.
We also intent to analyse the distances between
source nodes and destination nodes in packets. Pre-
liminary results show that the data follow Gamma or
log-normal distribution, and a polynomial fitting can
be a viable solution. Moreover for real applications,
the average distance of all source-destination pairs in
packets seems to be higher than uniform random traf-
fic. The interval of packets is another possible topic,
however more applications are needed to be analysed
in the future. To show the effectiveness of the pro-
posed model, we aim to compare the generated traffic
with real application traffic with different metrics.
6 CONCLUSION
In this paper we investigated the detailed traffic pro-
files of different parallel and high performance com-
puting applications. We proposed a generic traffic
model based on the mathematical analysis of the traf-
fic traces. It is discovered that parallel applications
show different traffic patterns, however the patterns
can be categorized into groups, each with specific
parallel programming paradigms. Simulation results
show that both hot-spot and bursty traffic can be ob-
served. Several metrics concerning the applications
were studied. In addition we found the packet injec-
tion amount of nodes followed the power-law distri-
bution. Least squares fitting method was applied to
gather the parameters of the distribution of injected
packets by different nodes.
REFERENCES
Badr, M. and Jerger, N. (2014). Synfull: Synthetic traffic
models capturing cache coherent behaviour. In Com-
puter Architecture (ISCA), 2014 ACM/IEEE 41st In-
ternational Symposium on, pages 109–120.
Bahn, J. H. and Bagherzadeh, N. (2008). A generic traffic
model for on-chip interconnection networks. Network
on Chip Architectures, page 22.
Bienia, C., Kumar, S., Singh, J. P., and Li, K. (2008). The
parsec benchmark suite: characterization and archi-
tectural implications. In Proceedings of the 17th in-
ternational conference on Parallel architectures and
compilation techniques, PACT ’08, pages 72–81, New
York, NY, USA. ACM.
Bogdan, P., Kas, M., Marculescu, R., and Mutlu, O.
(2010). Quale: A quantum-leap inspired model
for non-stationary analysis of noc traffic in chip
multi-processors. In Networks-on-Chip (NOCS),
2010 Fourth ACM/IEEE International Symposium on,
pages 241–248.
Dally, W. J. and Towles, B. (2003). Principles and Practices
of Interconnection Networks. Morgan Kaufmann.
Intel (2015). Intel xeon processor e5-2699 v3.
http://ark.intel.com/products/81061/.
Kim, C., Burger, D., and Keckler, S. W. (2002). An adap-
tive, non-uniform cache structure for wire-delay dom-
inated on-chip caches. SIGARCH Comput. Archit.
News, 30(5):211–222.
Lee, Y., Grover, V., Krashinsky, R., Stephenson, M., Keck-
ler, S., and Asanovic, K. (2014). Exploring the de-
sign space of spmd divergence management on data-
parallel architectures. In Microarchitecture (MICRO),
2014 47th Annual IEEE/ACM International Sympo-
sium on, pages 101–113.
Liu, W., Xu, J., Wu, X., Ye, Y., Wang, X., Zhang, W.,
Nikdast, M., and Wang, Z. (2011). A noc traffic suite
based on real applications. In VLSI (ISVLSI), 2011
IEEE Computer Society Annual Symposium on, pages
66–71.
Magnusson, P., Christensson, M., Eskilson, J., Forsgren, D.,
Hallberg, G., Hogberg, J., Larsson, F., Moestedt, A.,
and Werner, B. (2002). Simics: A full system simula-
tion platform. Computer, 35(2):50–58.
Martin, M. M., Sorin, D. J., Beckmann, B. M., Marty,
M. R., Xu, M., Alameldeen, A. R., Moore, K. E., Hill,
M. D., and Wood, D. A. (2005). Multifacet’s gen-
eral execution-driven multiprocessor simulator (gems)
toolset. Computer Architecture News.
Mediatek (2015). Mediatek - true octa-core.
http://event.mediatek.com/ en octacore/.
Mostaghim, S., Branke, J., Lewis, A., and Schmeck,
H. (2008). Parallel multi-objective optimization us-
ing master-slave model on heterogeneous resources.
In Evolutionary Computation, 2008. CEC 2008.
(IEEE World Congress on Computational Intelli-
gence). IEEE Congress on, pages 1981–1987.
ICSOFT-EA2015-10thInternationalConferenceonSoftwareEngineeringandApplications
448

Newman, M. (2005). Power laws, pareto distributions and
zipf’s law. Contemporary Physics, 46(5):323–351.
Patel, A. and Ghose, K. (2008). Energy-efficient mesi cache
coherence with pro-active snoop filtering for multi-
core microprocessors. In Proceeding of the thirteenth
international symposium on Low power electronics
and design, pages 247–252.
Pekkarinen, E., Lehtonen, L., Salminen, E., and
Hamalainen, T. (2011). A set of traffic models for
network-on-chip benchmarking. In System on Chip
(SoC), 2011 International Symposium on, pages 78–
81.
Perelman, E., Polito, M., Bouguet, J.-Y., Sampson, J.,
Calder, B., and Dulong, C. (2006). Detecting phases
in parallel applications on shared memory architec-
tures. In Parallel and Distributed Processing Sympo-
sium, 2006. IPDPS 2006. 20th International, pages 10
pp.–.
Rauber, T. and Rnger, G. (2010). Parallel Programming -
for Multicore and Cluster Systems. Springer.
Soteriou, V., Wang, H., and Peh, L.-S. (2006). A statistical
traffic model for on-chip interconnection networks. In
Modeling, Analysis, and Simulation of Computer and
Telecommunication Systems, 2006. MASCOTS 2006.
14th IEEE International Symposium on, pages 104–
116.
Woo, S., Ohara, M., Torrie, E., Singh, J., and Gupta, A.
(1995). The splash-2 programs: characterization and
methodological considerations. In Computer Archi-
tecture, 1995. Proceedings., 22nd Annual Interna-
tional Symposium on, pages 24–36.
Xu, T., Liljeberg, P., Plosila, J., and Tenhunen, H. (2013).
Evaluate and optimize parallel barnes-hut algorithm
for emerging many-core architectures. In High Per-
formance Computing and Simulation (HPCS), 2013
International Conference on, pages 421–428.
Xu, T., Pahikkala, T., Airola, A., Liljeberg, P., Plosila, J.,
Salakoski, T., and Tenhunen, H. (2012a). Implemen-
tation and analysis of block dense matrix decomposi-
tion on network-on-chips. In High Performance Com-
puting and Communication 2012 IEEE 9th Interna-
tional Conference on Embedded Software and Systems
(HPCC-ICESS), 2012 IEEE 14th International Con-
ference on, pages 516–523.
Xu, T. C., Liljeberg, P., Plosila, J., and Tenhunen, H.
(2012b). A high-efficiency low-cost heterogeneous 3d
network-on-chip design. In Proceedings of the Fifth
International Workshop on Network on Chip Archi-
tectures, NoCArc ’12, pages 37–42, New York, NY,
USA. ACM.
ParallelApplicationsandOn-chipTrafficDistributions:Observation,ImplicationandModelling
449
