
Towards a Context-aware Framework for Assessing and Optimizing
Data Quality Projects
Meryam Belhiah, Mohammed Salim Benqatla, Bouchaïb Bounabat and Saïd Achchab
Laboratoire AL QualSADI, ENSIAS, Mohammed V University of Rabat, Rabat, Morocco
Keywords: Data Quality Assessment and Improvement, Data Accuracy, Cost/Benefit Analysis, Business Process
Performance.
Abstract: This paper presents an approach to clearly identify the opportunities for increased monetary and non-monetary
benefits from improved Data Quality, within an Enterprise Architecture context. The aim is to measure, in a
quantitative manner, how key business processes help to execute an organization’s strategy, and then to
qualify the benefits as well as the complexity of improving data, that are consumed and produced by these
processes. These findings will allow to clearly identify data quality improvement projects, based on the latter’s
benefits to the organization and their costs of implementation. To facilitate the understanding of this approach,
a Java EE Web application is developed and presented here.
1 INTRODUCTION
As business processes have become increasingly
automated, data quality becomes the limiting and
penalizing factor for business processes’ performance
and overall quality, and thus impacts daily operations,
financial and business objectives, downstream
analysis for effective decision making, and end-user
satisfaction (Wang and Strong, 1996), whether it is a
customer, a citizen, an institutional partner or a
regulatory authority. The problem of identification
and classification of costs inflicted by poor data
quality, has been given great attention in literature
(Eppler et al, 2004), (Haug et al, 2011), as well as the
definition of approaches to measure Return On
Investment (ROI) of data quality initiatives in both
research (Otto, 2009) and industrial areas (Gartner,
2011).
Even though the work cited above establishes the
overall methodology for measuring the business
value of data quality initiatives, it lacks generic and
concrete metrics, based on cost/benefit analysis, that
can be used by different organizations, in order to
facilitate the identification of opportunities for
increased benefits, before launching further analysis
using additional KPI that are specific to each
organization.
The overall goal is not to improve data quality by
any means, but to carefully plan data quality
initiatives that are cost-effective and that will have
the most positive impact. This guidance is
particularly crucial for organizations with no or a
little experience in data quality projects.
While it is difficult to develop a generic
calculation framework to evaluate costs and benefits
of data quality projects in money terms, the purpose
of this paper is to find a suitable way to assess the
positive impact of the improvement of quality of a
data object used by a key business process alongside
the implementation complexity. This is relevant,
because the positive impact and implantation
complexity could be transformed to quantitative
measures of monetary benefits and costs.
The organization of this paper is addressed as
follows: section 2 explains the assessment approach
of business processes’ overall quality impact on
organizations’ objectives and results. Factors that
summarize the implementation complexity of data
quality initiatives are detailed in section 3. Sections 4
and 5 provide an insight into our application. In
section 6, the conclusions and future work are
summarized.
2 BUSINESS PROCESSES’
POSITIVE IMPACT
ASSESSMENT
The first part of our approach to track ROI of data
189
Belhiah M., Benqatla M., Bounabat B. and Achchab S..
Towards a Context-aware Framework for Assessing and Optimizing Data Quality Projects.
DOI: 10.5220/0005557001890194
In Proceedings of 4th International Conference on Data Management Technologies and Applications (DATA-2015), pages 189-194
ISBN: 978-989-758-103-8
Copyright
c
2015 SCITEPRESS (Science and Technology Publications, Lda.)

quality projects consists of understanding how an
organization’s business/financial objectives and
results are linked to key business processes’
performance and overall quality. The following steps
summarize the process of measuring the positive
impact of the performance and overall quality of
business processes on the strategy execution of an
organization:
1. Identify leading factors that contribute to
achieving short-term business/financial
objectives of an organization;
2. Configure the importance of these factors
according to the specifications of each
organization;
3. Measure the impact of key business processes’
performance and overall quality on these
factors;
4. Order business processes by positive impact.
2.1 Leading Factors That Help
Achieving Business/Financial
Objectives of an Organization
To understand how business processes’ performance
and overall quality affect the success of an
organization, financial/business objectives and
results are detailed as follows:
Positive impact on daily operations;
Increasing revenues;
Increasing productivity;
Reducing costs;
Meeting regulatory driven compliance;
Positive impact on effective decision making;
Positive impact on downstream analysis.
2.2 Configuration of Importance of
the above Factors According to the
Specifications of each Organization
Due to organizations’ specific aspects and sets of
success factors, and in order to provide a generic
approach that can be implemented without any
adjustment, the second step of our approach
introduces the context-aware and configurable
weighting coefficients, illustrated in Table 1.
The purpose behind using a weighing coefficient
is to allow each organization to express the
importance of a success factor, depending of its
context and strategy.
To cite few examples where using different
weighting coefficients is relevant:
Public organizations may have more concerns
about increasing end-users satisfaction (citizens
in this particular case), than
Table 1: Configuration canvas for positive impact
calculation.
Factor Values
Rating
(R)
Weighting
coefficient
(I)
Impact on daily
operations
true 1
false 0
Impact on short-
term
business/financial
objectives
increasing
revenues
0.15
increasing
productivity
0.15
reducing
costs
0.15
increasing
end-user
satisfaction
0.15
meeting
regulatory
driven
compliance
0.15
other 0.15
Impact on
decision making
true 1
false 0
Impact on
downstream
analysis
true 1
false 0
Is the process
cross-functional?
true 1
false 0
increasing revenues;
Healthcare actors may give more attention to
meeting regulatory driven compliance than to
the other factors, while still important, owing to
the fact that norms and standards are mandatory
in the field of healthcare;
Industrial companies may give the same
importance to all the factors above.
2.3 Measurement of the Impact of Key
Business Processes’ Performance
on Overall Quality
Business and IT leaders in charge of data quality
initiatives should:
1. List all the key business processes;
2. Configure the importance of each factor by
acting on the associated weighting coefficient.
The sum of all weighing coefficient must be
equal to 100;
3. Answer the questions in the first column of
Table 1.
DATA2015-4thInternationalConferenceonDataManagementTechnologiesandApplications
190

In the case of an organization with many key
business processes, the positive impact of each
business process will be calculated as follow:
∗
/100
(1)
Where R
i
is the rating for the factor “i” and I
i
is the
weighing coefficient that is associated with the factor
“i”, that was previously defined by both business and
IT leaders. The obtained score ranges between 0 and
5, where “0” refers to “no significant impact” and “5”
refers to “high positive impact”.
2.4 Order Business Processes by
Positive Impact
After iterating over all key business processes and
calculating the associated positive impact score,
business processes are automatically classified by
priority, in order to spot the point of departure to
identify opportunities for increased benefits from
improved data quality.
As business processes consume and produce data,
classifying key business processes by positive impact
on an organization’s short-term objectives and
results, should be followed by the identification of
data quality options with the greatest business value
at least-cost.
In addition to the positive impact score, other
leading indicators may be assessed using the same
approach, including: agile transformation of business
processes and potential risks that are associated with
data quality initiatives. These aspects will be explored
in a future work.
Because business processes access data objects in
reading and/or writing modes, it is normal that the
quality of the data has an impact on the result of
business processes’ execution and vice-versa.
3 DATA QUALITY PROJECTS
ASSESSMENT
While the first part of our approach deals with
understanding and assessing how business processes’
performance and overall quality positively impact an
organization’s objectives and results, the second part
of our approach focuses on data that are consumed
and used by these processes.
Data quality may be defined as “The degree to
which information consistently meets the
requirements and expectations of all knowledge
workers who require it to perform their processes”
(IAIDQ, 2015), what can be summarized by the
expression “fitness for use” (Wang et al, 1996).
Many researchers tried to establish a classification
for data quality dimensions. Below, Pipino et al have
identified 15 dimensions (Pipino et al, 2002):
Intrinsic: accuracy, believability, reputation
and objectivity;
Contextual: value-added, relevance,
completeness, timeliness and appropriate
amount;
Representational and accessibility:
understandability, interpretability, concise
representation, accessibility, ease of
operations, security.
All case studies that aimed at assessing and
improving data quality have chosen a subset of data
quality dimensions, depending on the objectives of
the study (Batini et al, 2012), (Narman et al, 2009),
(Aladwani et al, 2002), and (Haug et al, 2011).
Measurable metrics were then defined to score each
dimension.
We are particularly interested in assessing data
quality initiatives that are related to specific
dimensions of data quality: accuracy, completeness,
availability, validity and restricted access.
The remainder of this paper will focus on the
accuracy dimension.
The following steps detail the process of scoring
the implementation complexity of data accuracy
improvement:
1. Identify leading factors that contribute to the
calculation of the implementation
complexity of data accuracy improvement ;
2. Configure the importance of these factors
according to the specifications of each
organization;
3. Measure the positive impact and the
implementation complexity ;
4. Prioritize data to improve according to the
scores obtained in the previous step.
3.1 Leading Factors that Help
Calculating the Implementation
Complexity of Data Accuracy
Improvement
In this part, the weighting coefficient plays the same
role as in the previous part, as it allows taking into
consideration the particularities of each organization.
TowardsaContext-awareFrameworkforAssessingandOptimizingDataQualityProjects
191
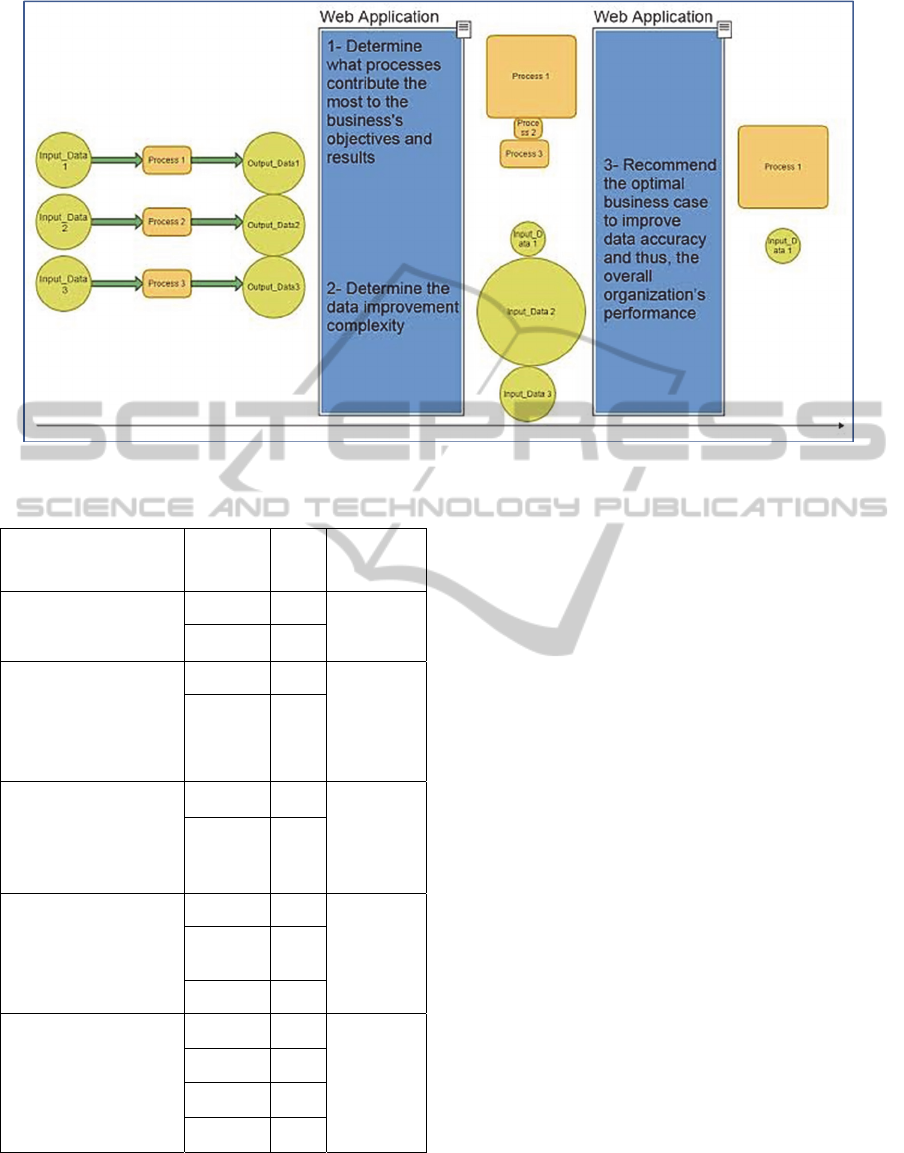
Figure 1: General steps.
Table 2: Configuration canvas.
Factor Values
Rating
(R)
Weighting
coefficient
(C)
Are there standards to
restructure and validate
the data?
false 1
true 0
Is there an authentic
source of data
(repository) that allows
to complement or
contradict the data?
false 1
true
0
Does the data object
have attributes with
great weight
identification in relation
to another data source?
false 1
true 0
Is the data processing:
manual 1
semi-
automatic
0.5
automatic 0.25
What is the size of the
data to process?
very high 1
high 0.75
medium 0.5
low 0.25
3.2 Measurement of the
Implementation Complexity of
Data Accuracy Improvement
Project
Data profiling activities should allow answering the
previous questions (see Table 2). For a given data
used by a key business process, the implementation
complexity will be calculated as follows:
∗
/100
(2)
Where R
i
is the rating for the factor “i” and C
i
is
the weighing coefficient that is associated with the
factor “i”, that was defined previously by both
business and IT leaders. The obtained score ranges
between 0 and 5, here where “0” refers to “minimal
complexity” and “5” refers to “severe complexity”.
The figure above (see figure 1) depicts our
approach.
4 EXPERIMENTAL SETUP
After completing this research, and in order to
validate the approach presented in this paper, we are
planning to do at least two case studies. We are
particularly interested in open-data and e-government
fields. Meanwhile, the figures presented
DATA2015-4thInternationalConferenceonDataManagementTechnologiesandApplications
192
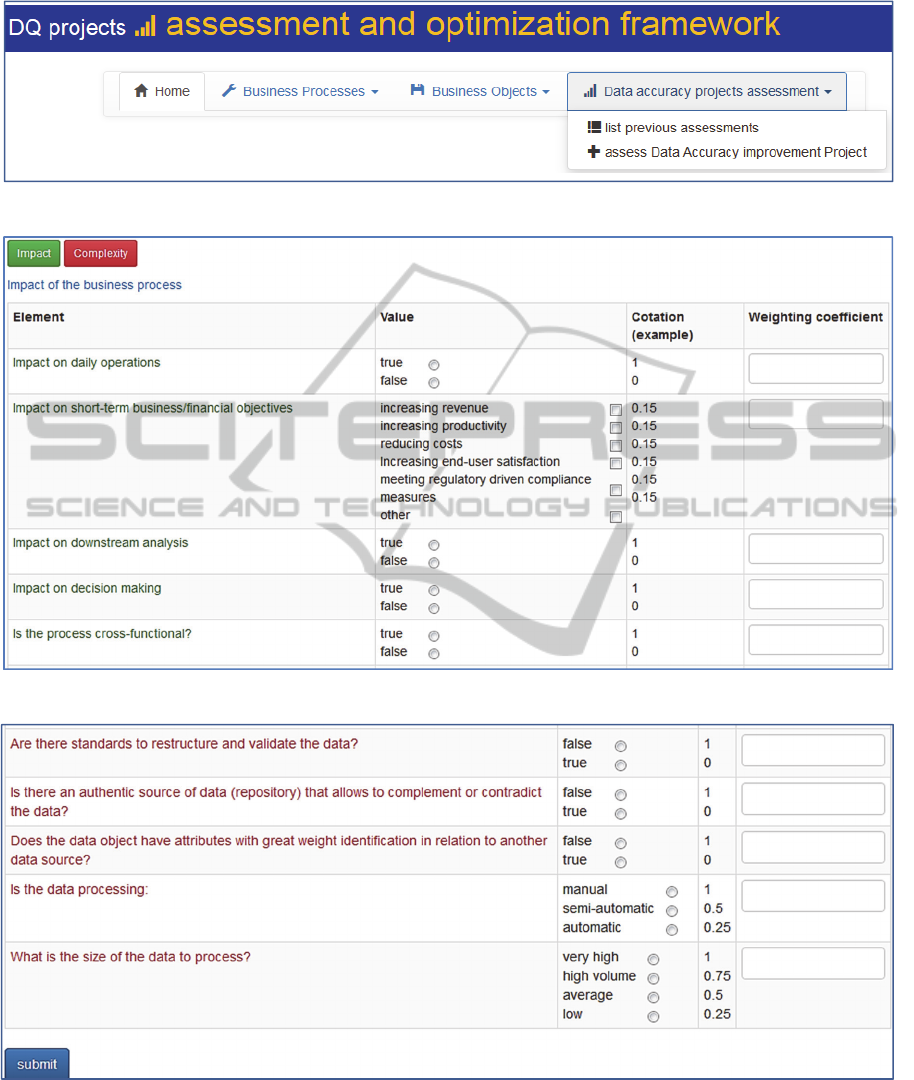
Figure 2: Main menu.
Figure 3: Calculation framework for positive impact.
Figure 4: Calculation framework for implementation complexity.
above (see figures 2, 3, and 4) summarize our
solution’s most important functionalities including:
Adding a new business process;
Listing all business processes;
Adding a new business object (physically
implemented by a data object), that is used by
a registered business process;
Listing all business objects;
Assessing data accuracy improvement projects;
Listing all previous assessments.
TowardsaContext-awareFrameworkforAssessingandOptimizingDataQualityProjects
193

5 RECOMMENDATIONS
We have established two global indicators of positive
impact and implementation complexity, to measure
the business value of data accuracy improvement
projects.
According to the values of these indicators and to
the targeted accuracy level (to-be), two business cases
may be considered:
The first one is to improve the processes
(reengineering, control, etc.), by enhancing
their execution accuracy. This is a short term
option that is generally less expensive, but
requires change management because it affects
the working methods;
The second one is based on the improvement of
data accuracy by determining and analyzing the
sources of low quality, such as uncontrolled
data acquisition, update problems, etc.
Since the automation of business processes
guarantees, in a way, the quality of their execution,
actions must be directed towards the improvement of
the accuracy of the data used by these processes. Our
approach highlights the most cost-effective data
accuracy improvement projects.
6 CONCLUSIONS AND FUTURE
WORK
The result of the work accomplished thus far shows
how to measure in a quantitative manner, the business
value of data quality improvement projects, by
establishing two global indicators of positive impact
and implementation complexity.
In this paper, only the assessment of data accuracy
projects was covered. One or more case studies’
validation is necessary.
Furthermore, and in order to recommend the
optimal business case to improve data accuracy and
thus, the overall organization’s performance, an
optimization algorithm is under development to
identify the optimal data accuracy level, taking
account of: 1) – the initial data accuracy level (as-is),
2) – the positive impact of the key process that uses
the data, 3) – the implementation complexity of data
accuracy improvement initiative, and 4) - the targeted
data accuracy (to-be).
REFERENCES
Aladwani, A. M., & Palvia, P. C., 2002. Developing and
validating an instrument for measuring user-perceived
web quality. Information & management, 39(6), 467-
476.
Batini, C., Comerio, M., & Viscusi, G., 2012. Managing
quality of large set of conceptual schemas in public
administration: Methods and experiences. In Model and
Data Engineering (pp. 31-42). Springer Berlin
Heidelberg.
Eppler, M., & Helfert, M.,2004. A classification and
analysis of data quality costs. In International
Conference on Information Quality.
Gartner, Oct 2011. Measuring the Business Value of Data
Quality. https://www.data.com/export/sites/data/com
mon/ assets/pdf/DS_Gartner.pdf.
Haug, A., Zachariassen, F., & Van Liempd, D.,2011. The
costs of poor data quality. Journal of Industrial
Engineering and Management, 4(2), 168-193.
International Association for Information and Data Quality,
2015. IQ/DQ glossary.
http://iaidq.org/main/glossary.shtml.
Narman, P., Johnson, P., Ekstedt, M., Chenine, M., &
Konig, J., 2009. Enterprise architecture analysis for
data accuracy assessments. In Enterprise Distributed
Object Computing Conference, 2009. EDOC'09. IEEE
International (pp. 24-33). IEEE.
Otto, B., Hüner, K. M., & Österle, H. (2009). Identification
of Business Oriented Data Quality Metrics. In ICIQ
(pp. 122-134).
Wang, R. Y., & Strong, D. M.,1996. Beyond accuracy:
What data quality means to data consumers. Journal of
management information systems, 5-33.
Pipino, L. L., Lee, Y. W., & Wang, R. Y., 2002. Data
quality assessment. Communications of the ACM,
45(4), 211-218.
DATA2015-4thInternationalConferenceonDataManagementTechnologiesandApplications
194
