
Automated Exploit Detection using Path Profiling
The Disposition Should Matter, Not the Position
George Stergiopoulos
1
, Panagiotis Petsanas
1
, Panagiotis Katsaros
2
and Dimitris Gritzalis
1
1
Information Security & Critical Infrastructure Protection (INFOSEC) Laboratory, Dept. of Informatics,
Athens University of Economics & Business (AUEB), Athens, Greece
2
Dept. of Informatics, Aristotle University of Thessaloniki, Thessaloniki, Greece
Keywords: Code Exploits, Software Vulnerabilities, Source Code Classification, Fuzzy Logic, Tainted Object Propaga-
tion.
Abstract: Recent advances in static and dynamic program analysis resulted in tools capable to detect various types of
security bugs in the Applications under Test (AUT). However, any such analysis is designed for a priori
specified types of bugs and it is characterized by some rate of false positives or even false negatives and
certain scalability limitations. We present a new analysis and source code classification technique, and a pro-
totype tool aiming to aid code reviews in the detection of general information flow dependent bugs. Our
approach is based on classifying the criticality of likely exploits in the source code using two measuring
functions, namely Severity and Vulnerability. For an AUT, we analyse every single pair of input vector and
program sink in an execution path, which we call an Information Block (IB). A classification technique is
introduced for quantifying the Severity (danger level) of an IB by static analysis and computation of its En-
tropy Loss. An IB’s Vulnerability is quantified using a tainted object propagation analysis along with a Fuzzy
Logic system. Possible exploits are then characterized with respect to their Risk by combining the computed
Severity and Vulnerability measurements through an aggregation operation over two fuzzy sets. An IB is
characterized of a high risk, when both its Severity and Vulnerability rankings have been found to be above
the low zone. In this case, a detected code exploit is reported by our prototype tool, called Entroine. The
effectiveness of the approach has been tested by analysing 45 Java programs of NIST’s Juliet Test Suite,
which implement 3 different common weakness exploits. All existing code exploits were detected without
any false positive.
1 INTRODUCTION
Vulnerabilities of an Application under Test (AUT)
can be detected using advanced techniques of static
and dynamic analysis. These techniques have been
proven effective in analysing code for a priori speci-
fied flaws (e.g. Time Of Check, Time Of Use errors,
widely known as TOCTOUs), but they do not go far
enough in the detection of a previously unspecified
form of information flow dependent flaws. Moreover,
the National Institute of Software and Technology
(NIST) published a report (Okun et al., 2013), which
indicates that most tools still generate relatively high
numbers of false negatives and false positives,
whereas their analysis scalability to very big pro-
grams is questionable. There are though many tools
that shine on specific types of vulnerabilities, but it is
clear that there is no overall “best” tool with a high
detection rate in multiple exploit categories (National
Security Agency (NSA), 2011) (Rutar et al., 2004).
We elaborate on an analysis approach based on
the classification and the criticality assessment of the
program’s execution paths, with each path represent-
ing a sequence of program points from one location
to another location of the program’s control flow
graph. Our technique has been implemented in En-
troine, a prototype tool for the analysis of Java code.
Entroine analyses the AUT code for possible flaws by
classifying the execution paths based on their Entropy
Loss, thus producing data, which are processed by a
mathematical fuzzy logic system. More precisely, En-
troine processes structures called information blocks
(IBs), with each of them containing information for
execution paths, variables and program instructions
on the paths. Only a subset of all possible execution
paths is examined: the paths from locations associated
100
Stergiopoulos G., Petsanas P., Katsaros P. and Gritzalis D..
Automated Exploit Detection using Path Profiling - The Disposition Should Matter, Not the Position.
DOI: 10.5220/0005561101000111
In Proceedings of the 12th International Conference on Security and Cryptography (SECRYPT-2015), pages 100-111
ISBN: 978-989-758-117-5
Copyright
c
2015 SCITEPRESS (Science and Technology Publications, Lda.)

with input vectors to locations corresponding to infor-
mation flow sinks. IBs are classified in two different
groups of sets as follows:
the Severity sets that quantify the danger level for
the execution paths (the impact that an exploit
would have, if it would be manifested in the path);
the Vulnerability sets that quantify detected vul-
nerabilities based on a variable usage analysis
(tainted object propagation and validation of san-
itization checks, in which the data context of var-
iables is checked).
The method consists of the following components:
i. A static analysis, based on the BCEL library
(BCEL, 2003) (Dahm et al., 2003), creates the
control flow graph that is then parsed to get infor-
mation about variable usages. It is thus possible to
detect input data vectors, control-flow locations
and instructions that enforce context checks on
variable data. Entroine then maps the execution
paths for the AUT variables and, more specifi-
cally, only those locations, where the program ex-
ecution can follow different paths (execution flow
branching points).
ii. A classification approach that combines output
from (a) to create IBs. Each IB is classified using
statistical Entropy Loss and the two fuzzy mem-
bership sets, namely Severity and Vulnerability.
iii. A Fuzzy Logic system for quantifying the overall
Risk for each IB, based on linguistic variables,
and Severity and Vulnerability classification rat-
ings.
The main contributions of this paper are summarized
as follows:
1. We introduce a program analysis technique for
our classification system. Based on the control
flow graph and our Fuzzy Logic ranking system
only a limited number of execution paths and
statements have to be analysed.
2. We propose a Risk classification of program loca-
tions using two membership functions, one for the
identified Severity (Entropy Loss) and another
one for the Vulnerability level.
3. We present our prototype tool. By using the Vul-
nerability and Severity classifications, we realized
that the number of false positives for our detection
technique is lowered. In addition, Entroine
warned for elevated danger levels in program lo-
cations where a false negative could have oc-
curred.
4. We provide test results from applying Entroine to
the Juliet Test Suite (Boland and Black, 2012) that
has been proposed by NIST to study the effective-
ness of code analysis tools (National Security
Agency (NSA), 2011). Entroine detected all com-
mon weaknesses used upon, without having re-
ported any false positive.
In Section 2, we report recent results in related re-
search. In Section 3, we expose the theoretical under-
pinnings of our method. Section 4 provides technical
details for the implementation of our method in En-
troine and section 5 presents our experiments and re-
ports metrics and detection coverage in all tests.
2 RELATED WORK
Previously proposed analysis techniques based on
tainted object propagation such as the one in (Livshits
and Lam, 2005) mostly focus on how to formulate
various classes of security vulnerabilities as instances
of the general taint analysis problem. These ap-
proaches do not explicitly model the program’s con-
trol flow and it is therefore possible to miss-flag san-
itized input, thus resulting in false positives. Further-
more, there is no easy general approach to avoid the
possibility of false negatives. This type of analysis
does not suffer a potential state space explosion, but
its scalability is directly connected to the analysis sen-
sitivity characteristics (path and context sensitivity)
and there is an inherent trade-off between the analysis
scalability and the resulting precision/recall.
Regarding well-known static analysis tools, it is
worth to mention FindBugs (Hovemeyer and Pugh,
2004), which is used to detect more than 300 code de-
fects that are usually classified in diverse categories,
including those analysed by tainted object propaga-
tion. The principle of most of the FindBug’s bug de-
tectors is to identifying low-hanging fruits, i.e. to
cheaply detect likely defects or program points where
the programmer’s attention should be focused
(Ayewah et al., 2008).
Other tools, such as (CodePro, 2015), (UCDetec-
tor, 2015), (Pmd, 2015) and (Coverity, 2015) are
well-known for their capability to detect numerous
bugs, but related research in (Tripathi, 2014) has
shown that their main focus is centred around specific
bug types like null pointer exceptions, explicit im-
port-export and not those, for which a taint analysis is
required (XSS, OS executions etc.). In (Tripathi and
Gupta, 2014), a relatively low detection rate is re-
ported for many of the above mentioned tools for
some variants of important bug types (null pointer ex-
ception, user injections and non-black final instance).
To the best of our knowledge, none of the above men-
tioned tools implements a mechanism to cope with
the possibility of false negatives.
AutomatedExploitDetectionusingPathProfiling-TheDispositionShouldMatter,NotthePosition
101

Pixy (Jovanovic et al., 2010), a prototype imple-
menting a flow-sensitive, inter-procedural and con-
text-sensitive dataflow, alias and literal analysis, is a
new tool that further develops pre-existing analyses.
It mainly aims to detect cross-site scripting vulnera-
bilities in PHP scripts, but a false positive rate is at
around 50% (i.e., one false positive for each detected
vulnerability) has been reported and no mechanism
has been implemented to mitigate the problem.
Other researchers try to detect code flaws using
program slicing. (Weiser, 1981) introduced a pro-
gram slicing technique and applied it to debugging.
The main drawback is that the slice set often contains
too many program entities, which in some cases can
correspond to the whole program.
(Zhang et al., 2006) presents a technique that uses
a threshold to prune the computed backward slice. A
limitation is that this technique does not account for
the strength of the dependences between program en-
tities, nor the likelihood for each program entity to be
a failure cause. Another limitation is that the slice sets
can be sometimes very large. Finally, no information
is provided by any of these techniques for how to start
searching for a code flaw.
Researchers in (Doupe et al., 2011), focus exclu-
sively on specific flaws found in web applications as
in (Balzarotti et al., 2007), where various analysis
techniques are combined to identify multi-module
vulnerabilities.
Figure 1: NIST’s command injection example.
None of these techniques attempts to profile the
danger level in the program’s behaviour. In (Ster-
giopoulos et al., 2012); (Stergiopoulos et al., 2013)
and (Stergiopoulos et al., 2014), we have presented
the APP_LogGIC tool for source case analysis, but
we focused on logical errors instead of program ex-
ploits. and our ranking method was not based on a
statistical classification of the source code.
3 METHODOLOGY
Let us consider the example shown in Figure 1 from
the Juliet Test Suite, a collection of programs for test-
ing source code analyzers (Boland and Black, 2012).
Example 1. Variable data in Figure 1 is assigned data
originated from the source properties.
GetProperty. Then, it is used in the sink instruc-
tion getRuntime().exec without being checked
previously or having sanitized the variable’s contents,
as it should have happened. Our method will detect
and analyze the execution path starting from the in-
vocation of getProperty(“data”) and ending
with the exec()call, thus revealing the exploit pre-
sent in the source code.
Definition 1. Given the set T of all transitions in the
control flow graph of an AUT, an information block
IB is a structure, containing a set of instructions I and
a set of transitions Ti T enabled at the correspond-
ing program points, along with information about
data assignments on variables used in sets I and Ti.
Our method outputs a Risk value (ranging from
one to five) that denotes the overall danger level of an
IB. The Risk is quantified by means of a source code
classification system using Fuzzy Logic to flag ex-
ploits (Cingolani and Alcala-Fdez, 2012). This clas-
sification technique aims to confront two important
problems: the large data sets of the AUT analysis and
the possible false positives and false negatives when
trying to detect specific vulnerabilities. Regarding the
first mentioned problem, the Entroine tool can help
auditors to focus only to those instructions and paths
that appear having a relatively high rating in its clas-
sification system. The second mentioned problem can
be alleviated through Entroine’s ratings that imple-
ment general criteria, which take into account the pos-
sibility of an exploit in execution paths (Vulnerabil-
ity) and a path’s danger level (Severity). Two meas-
uring functions, namely Severity and Vulnerability
create fuzzy sets reflecting gradually varying danger
levels. Each IB gets a membership degree in these
sets, which represents its danger level and it is thus
classified within a broad taxonomy of exploits which
is based on a wide variety of publications (Gosling et
al., 2013);(Harold, 2006); (Mell et al., 2006). Mem-
bership sets act as code filters for the IBs.
Example 2. Figure 2 below depicts the Entroine’s out-
put for the program of Figure 1. Our tool detected data
entry points (input vectors) and the relevant execution
path, stored in the “Lines Executed” field (line num-
bers correspond to lines inside the source code Class
file, depicting the execution path’s instructions).
public void bad() throws Throwable {
String data = "", test = “”;
/* FLAW: data from .properties */
data = properties.getProperty("data");
if(System.getProperty("os.name").in-
dexOf("win") >= 0) {
String osCommand = "c:\\WINDOWS\\SYS-
TEM32\\cmd.exe /c dir ";}
/*POTENTIAL FLAW: command injection */
Process proc =
Runtime.getRuntime().exec(osCommand +
data);}
SECRYPT2015-InternationalConferenceonSecurityandCryptography
102

Then, the IB has been classified in relevant Severity
and Vulnerability ranks by analyzing checks and re-
lations between variables. Fig. 2’s Input Ranking de-
picts the rank assigned based on the input vector clas-
sification, in this case, the readLine()instruction.
Similar, Sink ranking depicts the rank assigned in the
sink instruction where the exploit manifests: a rank 5
OS Injection exec() instruction.
Figure 2: Information block example (from Entroine).
In the following section, we describe in detail the
way that the Severity and Vulnerability classification
ranks are computed.
3.1 Source Code Profiling for Exploit
Detection
Entroine classifies source code using two different
classification mechanisms: Severity and Vulnerabil-
ity. Entroine aggregates results from both to produce
an distinct, overall Risk value for dangerous code
points.
3.1.1 Severity
For an information block IB, Severity(IB)
measures the membership degree of its path π in a Se-
verity fuzzy set. Severity(IB) reflects the rela-
tive impact on an IB’s execution path π, if an exploit
were to manifest on π. According to (Stoneburner and
Goguen, 2002) by the National Institute of Software
and Technology (NIST), the impact of an exploit on
a program’s execution can be captured by syntactical
characteristics that determine the program’s execu-
tion flow, i.e. the input vectors and branch conditions
(e.g. conditional statements). Variables used in each
transition of the execution path are weighted based on
how they affect the control flow. Thus, variables that
directly affect the control flow or are known to mani-
fest exploits (e.g. they input data, used in branch con-
ditions or affect the system) are considered danger-
ous.
Definition 2. Given the information block IB, with a
set of variables and their execution paths, we define
Severity as
Severity(IB) = v ∈[0,5]
measuring the severity of IB on a Likert-type scale
from 1 to 5.
Likert scales are a convenient way to quantify
facts (Albaum, 1997) that in our case refer to a pro-
gram’s control flow. If an exploit were to manifest on
an execution path within an IB, the scale-range cap-
tures the intensity of its impact in the AUT’s execu-
tion flow. Statistical Entropy Loss classifies execu-
tion paths and their information blocks in one of five
Severity categories, one (1) through five (5). Catego-
ries are then grouped into Fuzzy Logic sets using la-
bels: high Severity (4-5), medium (3) or low (1 or 2).
3.1.2 Entropy Loss as a Statistical Function
for Severity Measurement
Evaluation of the membership degree of each execu-
tion path in the Severity set can be based on a well -
defined statistical measure. To assign Severity ranks,
continuous weights are estimated using Prior Entropy
and Entropy Loss. Finally, a fuzzy relational classifier
uses these estimations to establish correlations be-
tween Severity ranks and execution paths.
Expected Entropy Loss, which is also called Infor-
mation Gain, is a statistical measure (Abramson,
1963) that has been successfully applied to the prob-
lem of feature selection for information retrieval (Etz-
korn and Davis, 1997). Feature selection increases
both effectiveness and efficiency, since it removes
non-informative terms according to corpus statistics
(Yang and Pederson, 1997).
Our method is based on selected features, i.e.
source code instructions, which are tied to specific
types of vulnerabilities (section 4.2). For example, the
exec() instruction is known to be tied to OS injec-
tion vulnerabilities. Thus, Entroine uses exec() as
a feature to classify vulnerable IBs as a detected type
of OS Injection. Expected entropy loss is computed
separately for each information block. It ranks fea-
tures common in both positive and negative variable
execution paths with lower values, but ranks features
higher if they are effective discriminators of an ex-
ploit (Ugurel et al., 2002).
Input Ranking: 4
Sink Ranking: 5
Starting at line: 54
Source: getProperty
Input into variable: data bad, test bad
Sink method: exec
Execution arguments: osCommand, data,
Severity Rank#: 5
Lines executed: 106 83 82 81 80 79 78 77 76 75
73 62 60 57 56 54
Dangerous variables: proc , test , data,
Connections between the dangerous variables:
proc <-- data
Vulnerability Rank#: 4
AutomatedExploitDetectionusingPathProfiling-TheDispositionShouldMatter,NotthePosition
103

This technique was also used for source code clas-
sification in (Glover et al., 2001) and (Ugurel et al.,
2002). Here, we use the same technique, in order to
classify source code into danger levels.
In the following paragraphs, we provide a brief
description of the theory (Abramson, 1963). Let C be
the event that indicates whether an execution path
must be considered dangerous, depending on the
path’s transitions, and let f be the event that the path
does indeed contain a specific feature f (e.g. the exec()
instruction). Let
̅
and
̅
be their negations and Pr( )
their probability (computed as in section 4.3.1). The
prior entropy is the probability distribution that ex-
presses how certain we are that an execution path be-
longs to a specific category, before feature f is taken
into account:
where lg is the binary logarithm (logarithm to the base
2). The posterior entropy, when feature f has been de-
tected in the path is
Pr
C
|
lgPr
C
|
Pr
̅
|lgPr
̅
|
whereas the posterior entropy, when the feature is ab-
sent is
Pr
C
|
̅
lgPr
C
|
̅
Pr
̅
|
̅
lgPr
̅
|
̅
Thus the expected overall posterior entropy is given
by
Pr
Pr
̅
and the expected entropy loss for a given feature f is
Pr
Pr
̅
The expected entropy loss is always non-negative and
higher scores indicate more discriminatory features.
Example 3. Let us compute the expected Entropy
Loss used for the Severity classification of the pro-
gram in Example 1. Our Severity function will clas-
sify the path’s features (input vectors, sinks, branch
statements like exec() and getProperty()) ac-
cording to a taxonomy of features (Section 4.2). Five
probabilities Pr(C) were computed, one for each of
the five Severity ranks and the IB was classified at the
Severity rank 4 (maximum of the 5 Pr(C)s). The
IB’s prior entropy e was then calculated for the same
ranks. Prior entropy represents the current classifica-
tion certainty of Entroine, i.e. the level of confidence
that it has assigned the correct Severity rank. Finally,
the entropy loss (information gain) was calculated for
each one of the detected input vectors and sinks in the
execution path, for the variable data. We are inter-
ested in the highest and the lowest observed Entropy
Loss (Information Gain) values:
1. The higher value of information gain is observed,
the more the uncertainty for a dangerous security
characteristic is lowered and the classification to
a specific Rank category is therefore more robust.
Also, a relatively high information gain coupled
with a high probability Pr(C|f) for sanitization
provides information about features within paths
that lower the Vulnerability level.
2. The lowest value of information gain (highest en-
tropy) provides information on the most wide-
spread and distributed security methods by show-
ing the level of danger diffused in the AUT’s ex-
ecution paths.
Figure 3 below depicts the Entropy Loss output for
the example path. The conclusion drawn from this
output is the following:
The highest entropy loss (information gain) is de-
tected in method getProperty. This shows
that getProperty is a defining characteristic
for this Rank 5 exploit.
The lowest entropy loss in method exec() has
highest probability of appearance, Pr(C)=1, which
basically means that exec() is being used in all
execution paths analyzed as potentially danger-
ous. This elevates the Severity level of the de-
tected exploit significantly, because exec() is
prone to OS injection.
Figure 3: OS injection – Entropy for Rank 5 category.
3.1.3 Vulnerability
Vulnerability sets define categories based on the type
of detection and the method’s propagation rules and
each category reveals the extent to which variable
values are sanitized by conditional checks (Stone-
burner and Goguen, 2002). As a measuring function,
Vulnerability assigns IBs into vulnerability sets thus
quantifying how certain the tool is about an exploit
manifesting in a specific variable usage.
Prior path Entropy = 0.8112781
Source code Severity rank: 5
Calculation exec. time: 2 seconds
Entropy Loss for getInputStream – Rank 5:
0.31127812
Entropy Loss for getProperty - Rank 5:
0.81127812
Entropy Loss for exec in Rank 5: 0.0
SECRYPT2015-InternationalConferenceonSecurityandCryptography
104

Definition 3. Given the information block IB, with a
set of variables and their execution paths, we define
Severity as
Vulnerability(IB) = v ∈[0,5]
Ratings here also use a Likert scale (Albaum, 1997)
from 1 to 5. Similarly to the Severity(IB) func-
tion, our fuzzy logic system classifies IBs in similar
categories: “high” vulnerability, “medium” or “low”.
3.1.4 Vulnerability Function - Object
Propagation and Control Flow
Heuristics
Our control flow based heuristics for assigning Vul-
nerability ratings to information blocks are comple-
mented by a tainted object propagation analysis.
Tainted object propagation can reveal various types
of attacks that are possible due to user input that has
not been (properly) validated (Livshits and Lam,
2005). Variables holding input data (sources) are con-
sidered tainted. If a tainted object (or any other object
derived from it) is passed as a parameter to an exploit-
able instruction (a sink) like the instructions executing
OS commands we have a vulnerability case (Livshits
and Lam, 2005).
Variables and checks enforced upon them are an-
alysed for the following correctness criterion: all in-
put data should be sanitized before their use (Stone-
burner and Goguen, 2002). Appropriate checks show:
(i) whether a tainted variable is used in sinks without
having previously checked its values, (ii) if data from
a tainted variable is passed along and (iii) if there are
instances of the input that have never been sanitized
in any way.
Entroine checks tainted variable usage by analys-
ing its corresponding execution paths and conditions
enforced on them (if any) for data propagation. The
tool uses explicit taint object propagation rules for the
most common Java methods, such as System.
exec(). These rules are outlined in Section 4.3.2,
where the technical implementation details are dis-
cussed.
Example 4. Again, as an example, we will show how
our method analyzes the program of Figure 1 to de-
cide in which Vulnerability rank to classify the IB of
Example 2. Our tainted object analysis detects that (i)
an input vector assigns data to variable data and, then,
(ii) data is never checked by a conditional statement
like an if-statement or any other instruction
known to sanitize variable data. Then (iii) variable
data is used in a sink (exec()) without further sani-
tization of its contents. Thus, our method will not de-
tect any transition that lowers the Vulnerability level
of the execution path in Figure 1 and will therefore
assign a high rating (4) on the Vulnerability scale for
the IB containing this variable-execution path pair.
Using Severity and Vulnerability thresholds, En-
troine can focus only on a subset of paths for exploit
detection, thus limiting the number of paths needed to
traverse during its tainted propagation analysis. The
execution path set is pruned twice: (i) once based on
Severity measurements and the type of instruction
used (“safe” paths are discarded), and (ii) again when
possible exploits have been detected by using a Vul-
nerability rank as threshold.
3.2 Risk
According to OWASP, the standard risk formulation
is an operation over the likelihood and the impact of
a finding (OWASP, 2015):
Risk = Likelihood × Impact
We adopt this notion of risk into our framework for
exploit detection. In our approach, for each IB an es-
timate of the associated risk can be computed by com-
bining Severity(IB) and Vulnerability
(IB) into a single value called Risk. We opt for an
aggregation function that allows taking into account
membership degrees in a Fuzzy Logic system (Cin-
golani and Alcala-Fdez, 2012):
Definition 3. Given an AUT and an information
block IB with specific input vectors, corresponding
variables and their execution paths π ∈ P, function
Risk(IB) is the aggregation
Risk(IB)=aggreg(Severity(IB),
Vulnerability(IB))
with a fuzzy set valuation
Risk(IB) = {Severity(IB)} ∩ {Vulner-
ability(IB)}
Aggregation operations on fuzzy sets are operations
by which several fuzzy sets are combined to produce
a single fuzzy set. Entroine applies defuzzification
(Leekwijck, and Kerre 1999) on the resulting set, us-
ing the Center of Gravity technique. Defuzzification
is the computation of a single value from two given
fuzzy sets and their corresponding membership de-
grees, i.e. the involvedness of each fuzzy set pre-
sented in Likert values.
Risk ratings have the following interpretation: for
two information blocks IB1 and IB2, if Risk(IB1)
> Risk(IB2), then IB1 is more dangerous than IB2,
in terms of how respective paths π1 and π2 affect the
execution of the AUT and if the variable analysis de-
tects possible exploits. In the next section, we provide
AutomatedExploitDetectionusingPathProfiling-TheDispositionShouldMatter,NotthePosition
105
technical details for the techniques used to implement
the discussed analysis.
The risk of each information block is plotted sep-
arately, producing a numerical and a fuzzy result. It is
calculated by the Center of Gravity technique
(Leekwijck and Kerre, 1999) via its Severity and Crit-
icality assigned values. Aggregating both member-
ship sets, produces a new membership set and, by tak-
ing the “center” (sort of an “average”), Entroine pro-
duces a discrete, numerical output.
4 DESIGN AND
IMPLEMENTATION
In this section, the technical details on how Entroine
was developed will be presented. The tools architec-
ture, workflow along with technical details on how
Severity and Vulnerability are calculated.
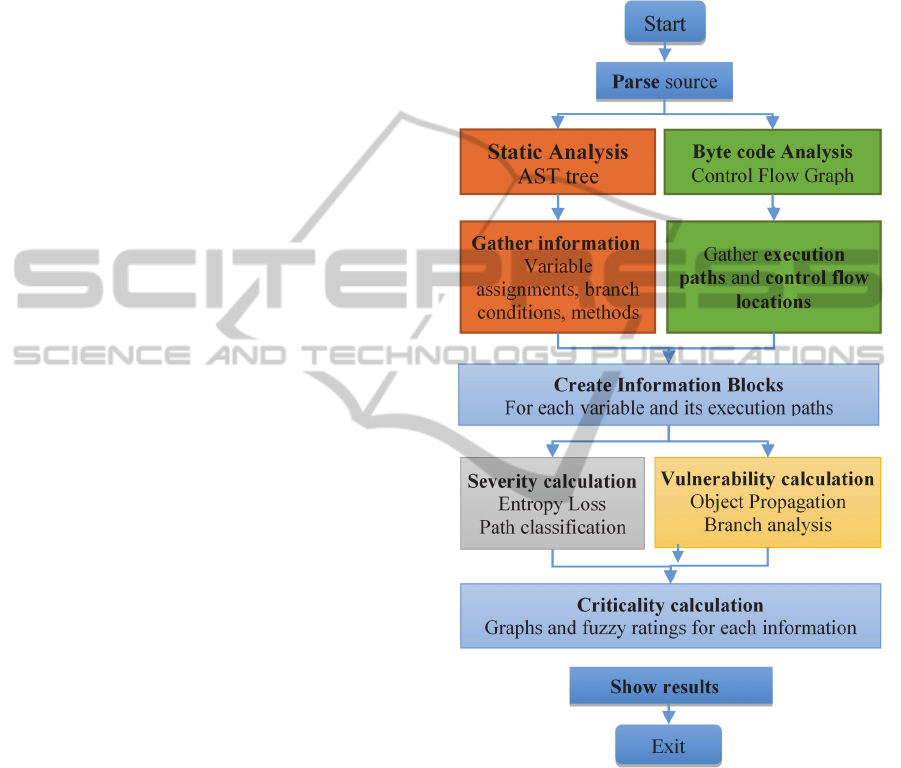
4.1 Entroine’s Architecture and
Workflow
Entroine consists of three main components: a static
source code analyzer (depicted with the colours or-
ange and green in Figure 4), an Information Block
constructor and, finally, the fuzzy logic system to
compute the Risk (grey and yellow colours).
Static Analysis: Static code analysis uses the Java
compiler to create Abstract Syntax Trees for the
AUT. It provides information concerning every single
method invocation, branch statements and variable
assignments or declarations found in the AUT. Com-
piler methods (visitIf(), visitMethodIn-
vocation(), etc.) were overridden, in order to an-
alyze branch conditions and sanitization checks of
variables. The following sample output shows the
AST meta-data gathered for variable sig_3 in a class
named Sub-system114:
DECLARE::12::double::sig_3::0::
Main22::Subsystem114.java
The ByteCode Engineering Library (Apache BCEL)
(Dahm et al., 2003) is used to build the AUT’s control
flow graph and to extract the program’s execution
paths. BCEL is a library that analyzes, creates, and
manipulates class files.
Information Block Creator: This component com-
bines information obtained from the static analysis to
create IBs that contain pairs of execution path – input
vector. Information blocks are then assigned Severity
and Vulnerability ranks.
Fuzzy Logic System: The Fuzzy Logic system is im-
plemented using the jFuzzyLogic library (Cingolani
and Alcala-Fdez, 2012). We use it to aggregate Se-
verity and Vulnerability sets to quantify the danger
level for each IB. This aggregation classifies each IB
to an overall Risk rank.
Figure 4: Entroine's processing flowchart.
4.2 Taxonomy of Dangerous
Instructions
Following Oracle’s JAVA API and documentation
(Java API, 2013) (Gosling et al., 2013) and (Harold,
2006), three categories of Java instructions were used
to classify execution paths in IBs. (i) Control Flow
instructions, (ii) Input Vector instructions and (iii)
potentially exploitable methods (sinks). 159 Java
methods were reviewed and gathered from formal
publications and organizations that specifically clas-
sify exploits and, consequently, any instructions used
SECRYPT2015-InternationalConferenceonSecurityandCryptography
106

in them (Mell et al., 2006); (Gosling et al., 2013);
(Harold, 2006).
The taxonomy’s methods were grouped into 5 cat-
egories of Severity corresponding to the taxonomy’s
Severity ranks. We based the Severity classification
ranks for ranking instructions on the well-known in-
ternational Common Vulnerability Scoring System
(CVSS) scoring system (Mell et al., 2006) and the
Common Weakness Enumeration system (The Com-
mon Weakness Enumeration (CWE), 2015). CVSS
classifies potential vulnerabilities into danger levels
and is used by NIST’s National Vulnerability Data-
base (NVD) to manage an entire database of vulnera-
bilities found in deployed software. The NVD is also
using the CWE system as a classification mechanism
that differentiates CVEs by the type of vulnerability
they represent. The Common Weakness Scoring Sys-
tem (CWSS) provides a mechanism for prioritizing
software weaknesses. It applies scores into vulnera-
bilities based on a mathematical formula of character-
istics.
Entroine uses all three of these systems, NVD-
CVSS, CWE and CWSS ranking to assign source
code instructions to specific danger levels, according
the type of vulnerability, in which they participate, its
general SWSS score and corresponding ranking value
in similar CVSS vulnerabilities that we found.
Example: The Runtime.exec()instruction is
widely-known to be used in many OS command in-
jection exploits. CWE and NIST provide a multitude
of critical vulnerabilities based in this instruction (e.g.
the CWE-78 category). Also the CWSS 3.0 scoring
system ranked the use of exec() to execute code
with application level privileges very high in its scale
(9.3 out of 10). Thus, Entroine’s taxonomy classifies
the exec() instruction into its very high (5) danger
level category. Similar notion has been followed in
organizing the rest of Entroine’s taxonomy instruc-
tions into Severity levels. This way, we limit our per-
sonal intuition, in an effort to support that Entroine’s
ranking system is justified.
Due to space limitations, only two small Java
Class group examples are given. The complete clas-
sification system can be found in the provided link at
the end of the article. The symbol § corresponds to
chapters in Java documentation (Gosling et al., 2013):
1. Control Flow Statements
According to a report (National Security Agency
(NSA), 2011), Boolean expressions determine the
control flow. Such expressions are found in the fol-
lowing statements:
(1) if-statements (§14.9)
(2) switch-statements (§14.11)
(3) while-statements (§14.12)
(4) do-statements (§14.13)
(5) for-statements (§14.14)
2. Input Vector Methods
Java has numerous methods and classes that accept
data from users, streams or files (Harold, 2006). Most
of them concern byte, character and stream input/out-
put. Entroine takes into account 69 different ways of
entering data into an AUT. A small example is given
below in Table 1.
Table 1: Example group: Input Vector methods taxonomy.
java.io.BufferedReader
java.io.
BufferedInputStream
java.io.ByteArrayIn-
putStream
java.io.
DataInputStream
java.lang.System javax.servlet.http.
java.io.ObjectInputStream java.io.StringReader
Based on (Harold, 2006) and common program-
ming experience, monitoring specific Java objects
seems to be an adequate, albeit not entirely thorough,
way of tracing user data inside Java applications.
3. Exploitable Methods (sinks)
Based on CWE, NVD (Mell et al., 2006) and common
knowledge, we know that specific methods are used
in exploits. We consider them as potential sinks and
thus, Entroine examines them carefully. As men-
tioned earlier, Entroine’s taxonomy of exploitable
methods was based on the exploit classification and
relevant source code by NIST’s NVD in their CWE
taxo-nomy (Mell et al., 2006). Entroine takes into ac-
count 90 methods known to be exploitable as sinks,
according to NIST CWEs. It then classifies them ac-
cording to CWE’s rank and its corresponding CVSS-
CWE and CWSS rank. A small example is given at
Table 2.
Table 2: Example group - Sink methods taxonomy.
java.lang.Runtime java.net.URLClassLoader
java.lang.System java.sql.Statement
javax.servlet.
http.HttpServlet
javax.script
java.io. File java.net.Socket
4.3 Classification and Ranking System
As explained in Section 3, the Fuzzy Logic system
from (Cingolani and Alcala-Fdez, 2012) is used in
Entroine, which provides a means to rank possible
logical errors. In order to aid the end-user, Severity
AutomatedExploitDetectionusingPathProfiling-TheDispositionShouldMatter,NotthePosition
107
and Vulnerability values are grouped into 3 sets
(Low, Medium, High), with an approximate width of
each group of 5/3 = 1,66~1,5 (final ranges: Low in
[0…2], Medium in (2…3,5] and High in (3,5…5]).
4.3.1 Calculating Severity using Entropy
Loss and Feature Selection
Entroine’s classification system for execution path in-
structions and transitions uses Entropy Loss to cap-
ture the danger level in AUT’s execution paths. It
takes into consideration specific instruction appear-
ances against the total number of instructions in a
given set of transitions and applies Severity ranks to
execution paths and the corresponding information
blocks.
Entroine detects, evaluates and classifies instruc-
tions found in execution. Severity ratings are applied
by classifying each information block into one of five
Severity levels, according to the Prior Entropy and
Entropy Loss of features in every execution path.
Since each information block refers to a specific
execution path and its variables, the necessary metrics
are calculated based on a ratio between path instruc-
tions considered dangerous (e.g. command execution
instructions like exec()) and the total number of in-
structions involved in the transitions of each path.
Similarly to (Ugurel et al., 2002), probabilities for the
expected entropy loss of each feature are calculated
as follows:
Pr
numberOfPositiveInstructions
Instructions
Pr
̅
1Pr
Pr
numberOfInstructionsWithFeatureF
Instructions
Pr
1 Pr
Pr
|
numberOfInstructionsWithFeatureF
Instructions
Pr
̅
|
1Pr|
Pr|
̅
numberOfInstructionsWithoutFeatureF
Instructions
Pr
̅
|
1 Pr|
̅
numberOfPositiveInstructions denotes to the sum of
instructions in a given path that belong to all danger
levels regardless of category (low, medium or high),
while numberOfInstructionsWithFeatureF represents
the sum of instructions which belong to a specific
danger level category (e.g. Severity rank 3), based on
feature ranks.
Entropy Loss is computed separately for each
source code feature characterized by a specific token.
Only tokens that are part of a variable’s execution
paths are analyzed. For example, in the expression
"data = properties.getProperty
("data");" the tokens will be: "data”,
"getProperty" and "properties".
The taxonomy of Java instructions in section 4.2
defines various features used in place of f in the above
equations. An example of Entroine’s features classi-
fication is given in Table 3. For a complete list, the
reader is referred to the link at the end of the article.
Table 3: Severity classification examples.
Rank
Example of classified methods
Category
Low
javax.servlet.http.Cookie
java.lang.reflection.Field
1
Low 2
Medium java.io.PipedInputStream 3
High java.io.FileInputStream 4
High java.sql.ResultSet:: getString 5
4.3.2 Calculating Vulnerability using
Control Flow Analysis and Tainted
Object Propagation
To calculate Vulnerability, Entroine runs a Tainted
Propagation algorithm that classifies the likelihood of
an exploit happening in an execution path. Entroine
uses BCEL (BCEL, 2003); (Dahm et al., 2003) to
traverse the program’s Control Flow Graph bottom-
to-top, in order to gather variable execution paths. En-
troine’s propagation rules are the following:
The highest entropy loss (information gain) is de-
tected Variables assigned data from expressions
(e.g. +, -, method return) whose output depends on
tainted data, are tainted.
Literals (e.g. hardcoded strings, true declarations)
are never tainted.
If an object’s variable gets tainted, only data re-
ferred by that variable are considered tainted, not
all object properties.
Methods that accept tainted variables as parame-
ters are considered tainted.
The return value of a tainted function is always
tainted, even for functions with implicit return
statements (e.g. constructors).
Table 4 depicts the check rules for exploit detection.
SECRYPT2015-InternationalConferenceonSecurityandCryptography
108

Table 4: Vulnerability check rules and their categories.
Rank Example of classified methods Category
Low No improper checks of variables 1
Low
Sinks NOT linked to input
vectors
2
Medium Propagation to methods 3
High
Improper checks on variables
with input data – Variables used
in sinks
4
High
No checks - variables used in
sinks
5
4.3.3 Risk
Risk represents a calculated value assigned to each
information block IB and its corresponding variables,
by aggregating the above mentioned Severity and
Vulnerability ratings. Membership of an IB in Risk
sets is calculated using Fuzzy Logic’s IF-THEN rules
(Fig. 2). For clarity, all scales (Severity, Vulnerability
and Risk) are divided in the same sets: “Low”, “Me-
dium” and “High”. Fig. 2 provides an example of how
Risk is calculated using Fuzzy Logic linguistic rules:
IF Severity=low AND Vulnerability=low THEN Risk=low
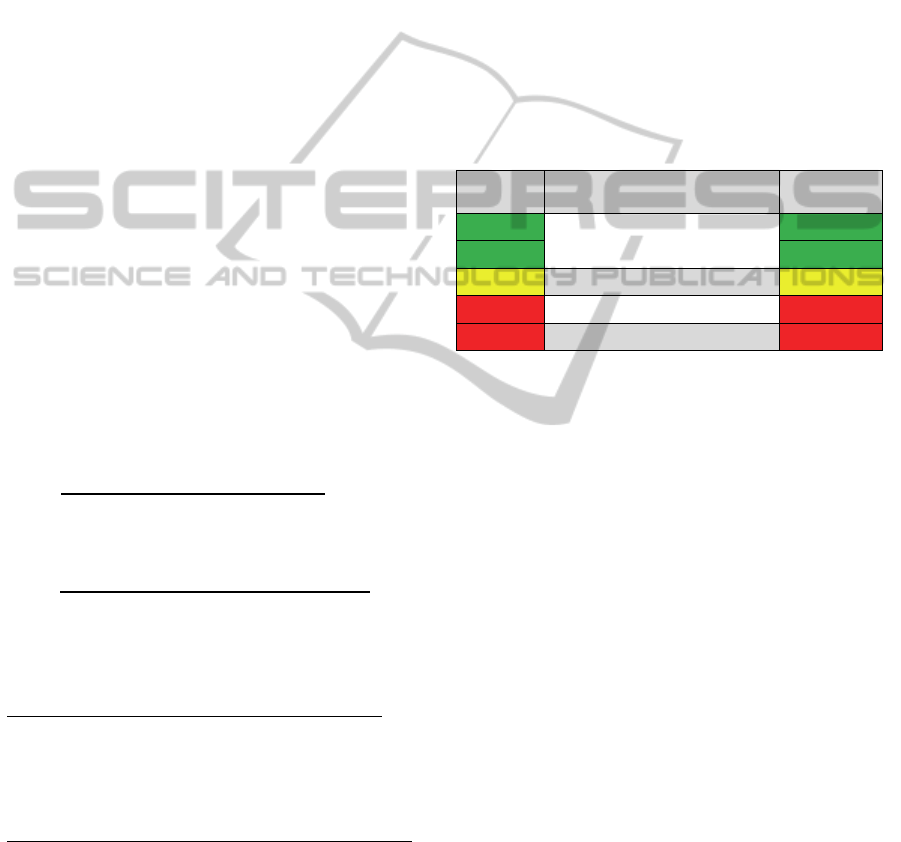
Table 5 shows the fuzzy logic output for Risk, based
on the aggregation of Severity and Vulnerability.
Table 5: Severity x Vulnerability = R - Risk sets.
Severity
V
ulnerability
Low Medium High
Low Low Low Medium
Medium Low Medium High
High Medium High High
5 EXPERIMENTS AND RESULTS
5.1 Entroine’s Architecture and
Workflow
In order to test our profiling approach implemented in
Entroine, we needed appropriate AUTs to analyze.
We considered whether we should use open-source
software or “artificially made” programs, such as
those usually used for benchmarking program analy-
sis tools. Both options are characterized by various
positive characteristics and limitations.
In choosing between real AUTs and artificial code
for our purpose, we endorsed NSA’s principles from
(National Security Agency (NSA), 2011) (National
Security Agency (NSA), 2012) were it states that “the
benefits of using artificial code outweigh the associ-
ated disadvantages”. Therefore, for preliminary ex-
perimentation with Entroine we have opted using the
Juliet Test Case suite, a formal collection of artifi-
cially-made programs packed with exploits (Boland
and Black, 2012).
The Juliet Test Suite is a collection of over 81.000
synthetic C/C++ and Java programs with a priori
known flaws. The suite’s Java tests contain cases for
112 different CWEs (exploits). Each test case focuses
on one type of flaw, but other flaws may randomly
manifest. A bad() method in each test-program
manifests an exploit. A good() method implements
a safe way of coding and has to be classified as a true
negative. Since Juliet is a synthetic test suite, we mark
results as true positive, if there is an appropriate warn-
ing in flawed (bad) code or false positive, if there is
an appropriate warning in non-flawed (good) code,
similarly to (Okun et al., 2013).
This testing methodology is developed by NIST.
We focus on exploits from user input, whereas other
categories are not examined (e.g. race conditions).
Table 6 below provides a list of all Weakness Class
Types used in the study. The middle column depicts
the categories of exploits on which Entroine is tested
(e.g. HTTP Response/Req Header-Servlet (add): ex-
ploits that manifest on servlets when adding HTTP
headers in responses and requests):
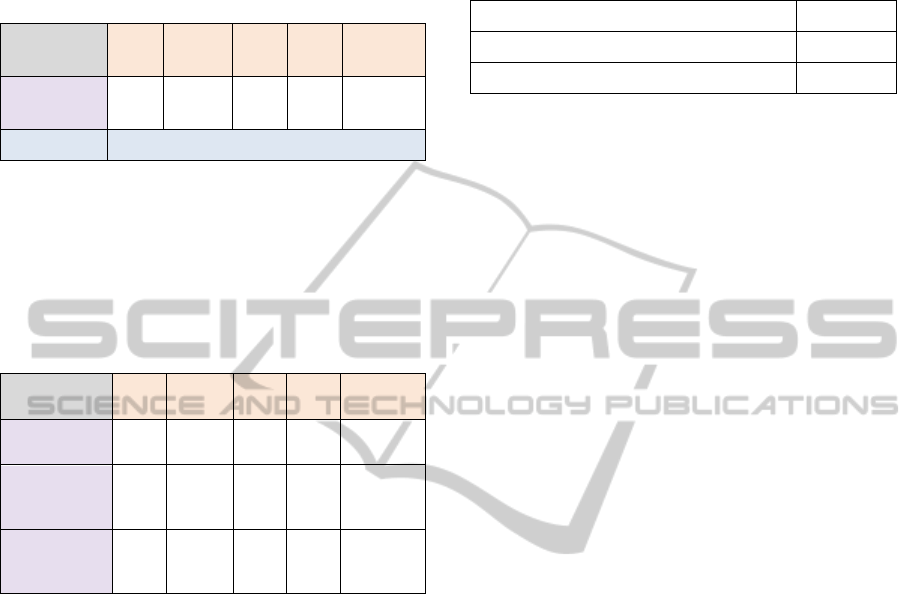
Table 6: Weakness Classes – CWE.
Weakness -
CWE
Types of weaknesses analyzed
No. of
tests
CWE-113
HTTP Response/Req HeaderServlet
(add)
HTTP Response/Req Cookie Servlet
HTTP Response/Req HeaderServlet
(set)
15
CWE-78
Operating System Command_
Injection
15
CWE-89
SQL Injection_connect_tcp
SQL Injection_Environment_
execute
SQL Injection_Servlet_execute
15
We ran Entroine on a set of vulnerable sample
programs from the CWE categories depicted in Table
6. Our test data set consists of 45 total Juliet pro-
grams, 15 cases from each CWE category depicted in
Table 6. Each bad method with an exploit will have
to produce a True Positive (TP), whereas all good
methods will have to represent True Negatives (TN).
Overall 178 tests (TP+TN) were included in all pro-
grams: 45 exploits and 133 cases of safe implementa-
tions (TNs). Entroine flags detections when both Se-
verity and Vulnerability ranks for an IB are ranked
AutomatedExploitDetectionusingPathProfiling-TheDispositionShouldMatter,NotthePosition
109
above the Low zone (Risk >=3). Table 7 shows the
overall results of our tests and, consequently, the ac-
curacy of the tool:
Table 7: TP, TN, FP detection rate (80 samples).
Weakness
Class - CWE
TP
Rate
TN
Rate
T
P +TN
All
tests
No. of
programs
CWE
samples
45/ 45 133/ 133 178 178 45
Accuracy TP = 100% , FP = 0%
Table 8 provides a more detailed view of the re-
sults shown in Table 7. Table 8 depicts all tests per
category of Juliet programs whereas Table 7 is an
overall look on the results. 15 differentiated tests from
each category where chosen for Entroine’s prelimi-
nary proof-of-concept:
Table 8: Detection rates for each Weakness Type.
Weakness Class
- CWE
TP TN
TP +
TN
All
tests
No. of
programs
CWE-89: SQL
Injection
15/15 51/51 66 66 15
CWE-78: OS
Command
Injection
15/15 28/28 43 43 15
CWE-113:
HTTP
Response Split
15/15 54/54 69 69 15
6 CONCLUSIONS
Entroine is in pre-alpha stage. Tests act as proof-of-
concept statistics, as testing real-world, big applica-
tions is not yet feasible due to package complexity,
external libraries, etc.
State explosion remains an issue, a problem inher-
ited by the used analysis techniques. Yet, state explo-
sion seems manageable using source code classifica-
tion to focus on specific variable paths. Severity rank-
ing helps this.
Another limitation of Entroine is that it cannot de-
tect errors based on variables’ context. This needs se-
mantic constructs to analyze information behind input
data. A formal comparison with known tools is, there-
fore, needed.
We plan on using this technique to test real-world
code used in cyber-physical systems (e.g. high level
code that manipulates devices through SCADA sys-
tems). This will work as an adequate extension to pre-
vious work of ours (Stergiopoulos et al., 2015).
Entroine runs relatively fast in comparison to what
it has to do. Table 9 depicts execution times.
Table 9: Entroine's execution times.
Execution time (per 15 tests) 129 sec
Entropy Loss calculation (per test) 1 msec
Static analysis (per test) ~5 sec
All tests were ran on an Intel Core i5 4570 PC (3.2
GHz, 8GB RAM). A link to Entroine’s taxonomy and
example files can be found at: http://www.in-
fosec.aueb.gr/Publications/Entroine_files.zip
REFERENCES
Boland T., Black P., 2012. Juliet 1.1 C/C++ and Java Test
Suite”. In Computer, vol. 45, no. 10, pp. 88-90.
Rutar N., Almazan, C., Foster, S., 2004. A Comparison of
Bug Finding Tools for Java. In Proc. of the 15
th
Inter-
national Symposium on Software Reliability Engineer-
ing. IEEE Computer Society, USA.
Livshits V., Lam M., 2005. Finding security vulnerabilities
in Java applications with static analysis. In Proc. of the
14
th
Usenix Security Symposium.
Ayewah, N. Hovemeyer, D. Morgenthaler, J., Penix, J.,
Pugh, W. 2008. Using Static Analysis to Find Bugs. In
Software, IEEE , vol.25, no.5, pp.22,29.
CodePro, 2015. CodePro, https://develop-
ers.google.com/java-dev-tools/codepro/doc/
UCDetector 2015. UCDetector, http://www.ucdetector.org/
Pmd, 2015. Pmd, http://pmd.sourceforge.net/
Tripathi A., Gupta A., 2014. A controlled experiment to
evaluate the effectiveness and the efficiency of four
static program analysis tools for Java programs. In
Proc. of the 18
th
International Conference on Evalua-
tion & Assessment in Software Engineering. ACM.
Hovemeyer D., Pugh W., 2004. Finding bugs is easy. In
SIGPLAN Not. 39, 12, pp. 92-106.
Jovanovic N., Kruegel C., Kirda E., 2010. Static analysis
for detecting taint-style vulnerabilities in web applica-
tions. In Journal of Computer Security, No. 5, IOS
Press.
Weiser M., 1981. Program Slicing. In Proc. of the Interna-
tional Conference on Software Engineering, pp. 439–
449,
Stergiopoulos G., Tsoumas V., Gritzalis D., 2013. On Busi-
ness Logic Vulnerabilities Hunting: The APP_LogGIC
Framework. In Proc. of the 7
th
International Confer-
ence on Network and System Security. Springer, 236-
249.
Zhang X., Gupta N., Gupta R., 2006. Pruning Dynamic
Slices with Confidence. In Proc. of the Conference on
Programming Language Design and Implementation,
pp. 169–180.
Cingolani P., Alcala-Fdez J., 2012. jFuzzyLogic: A robust
and flexible Fuzzy-Logic inference system language
SECRYPT2015-InternationalConferenceonSecurityandCryptography
110

implementation”. In Proc. of the IEEE International
Conference on Fuzzy Systems, 1-8.
Doupe A., Boe B. Vigna G., 2011. Fear the EAR: Discov-
ering and Mitigating Execution after Redirect Vulnera-
bilities. In Proc. of the 18
th
ACM Conference on Com-
puter and Communications Security. ACM, USA, pp.
251-262.
Balzarotti D., Cova M., Felmetsger V., Vigna G., 2007.
Multi-module vulnerability analysis of web-based ap-
plications. In: Proc. of the 14
th
ACM Conference on
Computer and Communications security. ACM, USA,
25-35.
Albaum G., “The Likert scale revisited”. In Market Re-
search Society Journal, vol. 39, pp. 331-348, 1997.
Ugurel S., Krovetz R., Giles C., Pennock D., Glover E., Zha
H., 2002. What's the code?: automatic classification of
source code archives. In Proc.of the 8
th
ACM SIGKDD
International Conference on Knowledge Discovery and
Data Mining, ACM, USA pp. 632-638.
Abramson N., 1963 "Information Theory and Coding."
McGraw-Hill, USA.
Etzkorn L., Davis, C., 1997. Automatically identifying re-
usable OO legacy code. In IEEE Computer, pp. 66-71.
Glover E., Flake G., Lawrence S., Birmingham W., Kruger
A., Giles L., Pennoek D., 2001. Improving category
specific web search by learning query modification. In
Proc. of the IEEE Symposium on Applications and the
Internet, IEEE Press, USA, pp. 23-31.
Stoneburner G., Goguen A., 2002. SP 800-30. Risk Man-
agement Guide for Information Technology Systems.
Technical Report. NIST, USA.
OWASP, 2015. The OWASP Risk Rating Methodology,
www.owasp.org/ index.php/OWASP_Risk_Rat-
ing_Methodology.
Leekwijck W., Kerre E., 1999. Defuzzification: Criteria and
classification. In Fuzzy Sets and Systems, vol. 108, issue
2, 159-178.
Java API, 2013. Java Standard Edition 7 API Specification,
http://docs.oracle.com/javase/7/docs/api/
Gosling J., Joy B., Steele G., Bracha G., Buckley A., 2013.
The Java Language Specification, Java SE 8 Edition,
http://docs.oracle.com/javase/specs/jls/se8/ html/in-
dex.html
Harold E., 2006. Java I/O, Tips and Techniques for Putting
I/O to Work. O’Reilly.
National Security Agency (NSA), 2011. On Analyzing
Static Analysis Tools. Center for Assured Software, Na-
tional Security Agency.
National Security Agency (NSA), 2012. Static Analysis
Tool Study-Methodology. Center for Assured Software.
Yang Y., Pederson J., 1997. A comparative study on feature
selection in text categorization. In Proc. of the 14
th
In-
ternational Conference on Machine Learning
(ICML'97), 412-420
BCEL, 2003. Apache Commons BCEL project page.
http://commons. apache.org/proper/commons-bcel/
Dahm, Markus, J. van Zyl, and E. Haase. 2003. The
bytecode engineering library (BCEL).
Okun V., Delaitre O., Black P., 2013. Report on the Static
Analysis Tool Exposition (SATE) IV, NIST Special Pu-
blication 500-297.
Stergiopoulos, G., Tsoumas, B., Gritzalis, D., 2012. Hunt-
ing application-level logical errors. In Proc. of the En-
gineering Secure Software and Systems Conference.
Springer (LNCS 7159), 135-142.
Stergiopoulos G., Katsaros P., Gritzalis D., 2014. Auto-
mated detection of logical errors in programs”. In: Proc.
of the 9
th
International Conference on Risks and Secu-
rity of Internet and Systems, Springer.
Coverity, 2015. Coverity SAVE audit tool,
http://www.coverity.com
Mell P., Scarfone, K., Romanosky S., 2006. Common Vul-
nerability Scoring System. In Security & Privacy,
IEEE, vol.4, no.6, pp.85-89.
The Common Weakness Enumeration (CWE), 2015. Office
of Cybersecurity and Communications, US Dept. of
Homeland Security, http://cwe.mitre.org
Stergiopoulos G., Theoharidou M., Gritzalis D., 2015. Us-
ing logical error detection in Remote-Terminal Units to
predict initiating events of Critical Infrastructures fail-
ures. In Proc. of the 3
rd
International Conference on
Human Aspects of Information Security, Privacy and
Trust, Springer, USA.
AutomatedExploitDetectionusingPathProfiling-TheDispositionShouldMatter,NotthePosition
111
