
On the Instability of Sensor Orientation in Gait Verification on Mobile
Phone
Thang Hoang
1
, Deokjai Choi
2
and Thuc Nguyen
3
1
Faculty of Information Technology, Saigon Technology University, Ho Chi Minh City, Vietnam
2
Department of Electronics and Computer Engineering, Chonnam National University, Gwangju, South Korea
3
Faculty of Information Technology, University of Science VNU-HCMC, Ho Chi Minh City, Vietnam
thang.hoangminh@stu.edu.vn, dchoi@jnu.ac.kr, ndthuc@fit.hcmus.edu.vn
Keywords:
Gait Recognition, Pattern Recognition, Behavioural Biometrics, Implicit Authentication, Accelerometer,
Mobile Security.
Abstract:
Authentication schemes using tokens or biometric modalities have been proposed to ameliorate the security
strength on mobile devices. However, the existing approaches are obtrusive since the user is required to
perform explicit gestures in order to be authenticated. While the gait signal captured by inertial sensors is
understood to be a reliable profile for effective implicit authentication, recent studies have been conducted
in ideal conditions and might therefore be inapplicable in the real mobile context. Particularly, the acquiring
sensor is always fixed to a specific position and orientation. This paper mainly focuses on addressing the
instability of sensor’s orientation which mostly happens in the reality. A flexible solution taking advantages
of available sensors on mobile devices which can help to handle this problem is presented. Moreover, a novel
gait recognition method utilizes statistical analysis and supervised learning to adapt itself to the instability of
the biometric gait under various circumstances is also proposed. By adopting PCA+SVM to construct the gait
model, the proposed method outperformed other state-of-the-art studies, with an equal error rate of 2.45% and
accuracy rate of 99.14% in terms of the verification and identification aspects being achieved, respectively.
1 INTRODUCTION
Over recent years, mobile devices have greatly
evolved from primitive machines for voice and text
communication to personal intelligent assistants and
are becoming more familiar to everybody. A survey
of the mobile market forecasted that mobile subscrip-
tions will reach 9.3 billion by 2019, 5.6 billion of
which will be for smart phones. Mobile facilities in-
clude not only making calls or sending text messages,
but also cover a variety of utilities such as data stor-
age, entertainment and Internet transactions. Since
such devices are likely to be portable personal com-
puters, sensitive personal data is accumulated in them,
which might lead to supplemental security demands.
Additionally, mobile devices tend to become increas-
ingly miniaturized and light, which makes them a lot
easier to lose. A huge amount of personal data could
become exposed to criminals. The most popular au-
thentication technique currently used in mobiles still
relies on the traditional method of using a secret code,
such as a PIN, visual pattern or password (Breitinger
and Nickel, 2010). These techniques are not highly
effective considering the problems of memory and se-
curity (Breitinger and Nickel, 2010). Alternatives us-
ing biometric traits, such as the face, fingerprint or
on-line signature, have been introduced recently on
mobiles, which have helped to mitigate the limitations
of password-based methods (Jain et al., 2004). How-
ever, all of these methods strongly rely on user coop-
eration and might therefore be annoying and obtrusive
in frequent use. Users are forced to pay attention and
perform explicit gestures in order to be authenticated.
Besides, the number of mobile applications is
exploding these days and these various applications
might require different levels of security. Indeed, a
trade-off between usability and security needs to be
taken into consideration. For instance, retrieving the
user’s daily schedule does not require the same level
of security as making an Internet banking transaction.
Applying the same verification scheme to all appli-
cations requiring different levels of security would
be somewhat cumbersome. Thus, it is necessary to
provide miscellaneous authentication mechanisms on
the mobile adapting to different security level require-
ments to optimize the user-device interaction. Ac-
Hoang T., Choi D. and Nguyen T..
On the Instability of Sensor Orientation in Gait Verification on Mobile Phone.
DOI: 10.5220/0005572001480159
In Proceedings of the 12th International Conference on Security and Cryptography (SECRYPT-2015), pages 148-159
ISBN: 978-989-758-117-5
Copyright
c
2015 SCITEPRESS (Science and Technology Publications, Lda.)

cordingly, an implicit authentication technique needs
to be investigated, which aims to enhance the user ex-
perience and ameliorate mobile security. Human gait
has been studied for a long time and shown to be as an
effective behavioral biometric trait (Jain et al., 2004;
Fish and Nielsen, 1993; Whitle, 2003). Identification
using gait signals captured by wearable sensors has
been introduced recently and has achieved positive re-
sults (Ailisto, 2005; Gafurov and Snekkenes, 2009).
Verification on mobiles leveraging gait characteristic
of individuals has significant advantages in terms of
user friendliness and security, in comparison to other
biometric modalities (Mjaaland et al., 2011; Derawi
and Bours, 2013). Specifically, gait signals can be
implicitly captured while the user is walking without
his or her intervention. From the security perspective,
it is difficult to counterfeit authentic gait patterns even
if the impostor could record the walking style of the
genuine user (Mjaaland et al., 2011). Conversely, a
copy of a fingerprint or face could be easily obtained
and the system security fully depends on the resis-
tance of the sensor. However, in most existing gait
recognition systems using wearable sensors, the ac-
quiring sensors are likely to be fixed in a specific ori-
entation and position, such as the waist, ankle or hip,
to ensure that the shape of the acquired gait signals is
similar (Derawi and Bours, 2013; Ailisto, 2005; Ga-
furov and Snekkenes, 2009; Derawi et al., 2010b; Ga-
furov et al., 2010). It can be seen that these positions
might be inappropriate, especially in the mobile con-
text. Moreover, fixing the orientation of the device
seems impossible in practice.
In this paper, we propose a novel gait recogni-
tion scheme which can be used for user verification
or identification on mobile device that can adapt to
the actual usage in reality. We pay attention to the
context that the mobile is placed in the front pocket,
which is the most appropriate location for the device
in daily use (Breitinger and Nickel, 2010). This study
mainly focuses on addressing the instability problem
of sensor’s orientation that frequently arises when the
device is flexibly attached with its owner in practice.
Furthermore, gait is likely to be considered as a be-
havioral biometric which is not as robust as other
physiological traits since it is affected by many physi-
cal and environmental conditions, such as the cloth-
ing, footwear, ground material, mood, health, age,
weight, etc. Therefore, applying pattern matching,
as in recent studies (Derawi et al., 2010b; Derawi
et al., 2010a; Derawi and Bours, 2013; Gafurov and
Snekkenes, 2009; Gafurov et al., 2010; Rong et al.,
2007), to deal with all these circumstances could be
inefficient. What is more, since the mobile is gen-
erally carried and accessed by its owner, gait signals
can be captured frequently and continuously. We pre-
fer to leverage machine learning techniques to adapt
to the variation of the gait characteristics over time.
Any change in the gait patterns can be implicitly la-
beled and notified to the system to update the outdated
model when the system frequently fails to verify the
user.
In summary, our main contributions are:
– Addressing the instability of sensor’s orientation
when gait signal of individual is captured. A sim-
ple but effective solution for this issue taking ad-
vantage of the available sensors in mobile devices
is presented (Section 3).
– Proposing a gait recognition model using statis-
tical analysis and supervised machine learning
(Section 4). The results achieved in our exper-
iment show that the proposed system has lower
error rates, in comparison to other state-of-the-art
methods (Section 5).
2 RELATED WORKS
Human gait data are considered to represent the par-
ticular style and manner in which human feet move
and, hence, contain information of identification. On
a more detailed level, the mechanism of human gait
involves synchronization between the skeletal, neu-
rological and muscular systems of the human body
(Fish and Nielsen, 1993). In 2005, H. Ailisto et al.
were the first to propose gait verification using wear-
able sensors (Ailisto, 2005) and this area was further
expanded by Gafurov et al. (Gafurov and Snekkenes,
2009). In general, sensors are attached to a particular
position such as the ankle (Gafurov and Snekkenes,
2009; Gafurov et al., 2010; Li et al., 2011; Terada
et al., 2011), hip (Gafurov and Snekkenes, 2009; De-
rawi et al., 2010b; Sprager and Zazula, 2009), waist
(Ailisto, 2005; Ngo et al., 2014), arm (Gafurov and
Snekkenes, 2009), or multiple positions (Pan et al.,
2009; Mondal et al., 2012) on the body to record lo-
comotion signals. The acquiring sensors can be gy-
roscopes or rotation sensors, but an accelerometer is
most commonly used to capture gait signals. The
most popular approach in this field is based on pattern
matching, in which the gait signals are captured, pre-
processed and then split into separate patterns. Vari-
ous distance metrics such as the Dynamic Time Warp-
ing (DTW) (Derawi et al., 2010b; Gafurov et al.,
2010; Rong et al., 2007; Derawi et al., 2010a), Eu-
clidean distance (Terada et al., 2011), auto-correlation
(Ailisto, 2005), and nearest neighbors (Pan et al.,
2009) are used to calculate similarity scores between

the given patterns and the stored templates. The sec-
ond approach is based on machine learning. Fea-
ture vectors are extracted and supervised learning is
adopted to construct general gait verification or iden-
tification models (Lu et al., 2014; Mondal et al., 2012;
Hoang et al., 2013; Frank et al., 2010)
Although wearable sensors have been imple-
mented with a variety of success rates, they have some
limitations. For example, those sensors are relatively
expensive and cumbersome, due to their size and
weight. The sensor interface is still under develop-
ment. Recently, the improvement of micro electrome-
chanical (MEM) technology has helped to miniatur-
ize such sensors, thus allowing them to be integrated
in mobile devices. Gait identification has thus been
implemented on mobile devices (Derawi and Bours,
2013; Lu et al., 2014) for the past few years. In com-
parison to wearable sensors, mobile sensors are de-
signed to be cheaper, simpler and, as a result, their
quality is not guaranteed. For instance, since the sam-
pling rate is low and unstable, the noise level is rather
high. Derawi et al. (Derawi et al., 2010b) demon-
strated these deficiencies by re-implementing Holien
et al.’s work (Holien, 2008). The authors achieved an
EER of 20.1%, in comparison to the original EER of
12.9%.
3 THE INSTABILITY OF SENSOR
ORIENTATION
Figure 1: (a) Mobile coordinate system, (b) misplacement
error, (c) disorientation error and (d) disorientation errors
and misplacement errors.
3.1 Problem Statement
Figures 1b–d illustrate the instability of the mobile
in terms of its orientation and position when it is put
freely in the pocket. Because walking is a slow ac-
tivity with a moderate fluctuation, any strong acceler-
ation is likely to last no longer than a few tenths of
a second. Consequently, the impact of different posi-
tions in the pocket is not significant and is considered
as noise. This can be mitigated by applying an effec-
tive noise filtering algorithm which will be described
in Section 4.1.2.
Meanwhile, the instability of the mobile’s orien-
tation (namely the disorientation for short) signifi-
cantly affects the quality of the acquired gait sig-
nals. Due to the design of the mobile accelerome-
ter, wherein the gait signals are captured in 3 separate
dimensions, the shape of the acquired signals fully
depends on the relative orientation between the mo-
bile and its carrier. So, the instability of the mobile
orientation would make the gait signals in each sep-
arate dimension dissimilar. This obstacle could ruin
the effectiveness of gait verification or identification
systems. For instance, the accuracy rate of pattern
matching approaches can be reduced when dealing
with dissimilar gait signals. This circumstance will
be illustrated in Section 5.5. Furthermore, based on
our observations, gait cycle-based segmentation can
be easily performed on the gait signal in the dimen-
sion which represents the vertical walking direction
(viz. the Y −dimension as in Figure 1a). Due to the
disorientation problem, it is difficult to determine the
correct dimension which reflects the vertical walk-
ing direction. Errors in the segmentation phase might
propagate to subsequent processing phases, so that the
effectiveness of the system can be compromised. Fi-
nally, extracting reliable features from dissimilar gait
signals could be a problematic issue.
Generally, the main objective of resolving the dis-
orientation problem is to maintain the accuracy rate
of the mobile gait verification or identification sys-
tems under practical conditions. A small part of this
problem was solved in (Hoang et al., 2013). How-
ever, there are unrealistic assumptions and constraints
which could make the authors’ proposed method dif-
ficult to apply in practice. We present a more flexible
solution to this problem in the following section.
3.2 Proposed Solution
A simple but effective strategy to handle the disorien-
tation is making gait signals always be represented in
a fixed coordinate system which is insensitive to the
device’s orientation. In other words, acceleration vec-
tors representing gait signals should be transformed
from the instable mobile coordinate system to a sta-
ble one. Based on the availability of sensors in the
mobile, the Earth coordinate is likely to be consid-
ered as the effective fixed system to represent the col-
lected acceleration samples. To do that, it is manda-
tory to collect various kinds of sensor data during the
gait sensing period. The following section describes
all necessary sensors need to be activated to collect
enough data used in this study.

3.2.1 Data Acquisition
Obviously, the first sensor needs to be activated to
capture gait signal is the mobile accelerometer. The
accelerometer senses forces acting on the mobile
in the three orthogonal axes of X,Y, Z (Figure 1a).
A sequence of acceleration samples output by the
accelerometer during walking is recognized as the
gait signal. Each sample is a 3-dimensional vec-
tor, wherein each component is a combination of the
forces of gravity and user motion acting on each di-
mension.
a = (a
(X)
, a
(Y )
, a
(Z)
), (1)
where a
(D)
is the acceleration value sensed on the
D−axis of the mobile.
Due to the characteristics of the accelerometer,
the raw acceleration samples always comprise grav-
itational acceleration components. In order to obtain
samples which only involve pure gait signals of indi-
viduals, we eliminate the impact of gravity by addi-
tionally activating a virtual sensor of gravity to deter-
mine the gravitational acceleration components on the
3 axes of the mobile during the gait capture process.
The output of the gravity sensor is a 3-component vec-
tor
g = (g
(X)
, g
(Y )
, g
(Z)
), (2)
where g
(D)
is the gravitational acceleration on the
D−axis of the mobile.
Furthermore to resolve the disorientation problem,
we activate a synthetic sensor of orientation, along
with the two sensors above to monitor the orientation
states of the mobile. As in the case of the accelerom-
eter and gravity sensor, the output of the orientation
sensor is a 3-component vector
o = (α, β , γ), (3)
where α, β , γ represent the degrees of rotation around
the Z−, X −,Y − axes of the mobile respectively.
Note that both orientation sensor and gravity sen-
sor are all virtual sensors whose outputs are nor-
mally synthesized from two physical sensors: the ac-
celerometer and the geomagnetic field sensor. These
sensors are getting more and more popular, appear-
ing in most modern smartphones so that all mandatory
sensor data needed in this study can be easily obtained
in practice.
3.2.2 Gait Signal Transformation
Let us assume that after a gait sensing period, we ob-
tain n vectors of acceleration a
i
, orientation o
i
and
gravity g
i
A =
a
1
. . . a
i
. . . a
n
>
∈ R
n×3
,
G =
g
1
. . . g
i
. . . g
n
>
∈ R
n×3
,
O =
o
1
. . . o
i
. . . o
n
>
=
α
1
β
1
γ
1
.
.
.
.
.
.
.
.
.
α
i
β
i
γ
i
.
.
.
.
.
.
.
.
.
α
n
β
n
γ
n
∈ R
n×3
.
(4)
First, the influence of gravity on the acquired ac-
celeration samples is eliminated to obtain the pure
gait signal.
A ← A − G. (5)
For each rotation vector o
i
in O, we calculate a
rotation matrix R
i
which will be used to transform the
acceleration vector in the mobile coordinate system to
the Earth coordinate system.
R
i
=
cosα
i
cosγ
i
− sinα
i
sinβ
i
sinγ
i
sinα
i
cosβ
i
cosα
i
sinγ
i
+ sinα
i
sinβ
i
cosγ
i
−sin α
i
cosγ
i
− cosα
i
sinβ
i
sinγ
i
cosγ
i
cosβ
i
−sin γ
i
sinγ
i
+ cosα
i
sinβ
i
cosγ
i
−cos β
i
sinγ
i
−sin β
i
cosβ
i
cosγ
i
(6)
Finally, we transform the gravity-free acceleration
vector representing in the mobile coordinate system to
the new fixed system by multiplying the vector with
the corresponding rotation matrix.
a
i
← a
i
R
i
. (7)
The gait signal after transformation is denoted as
A =
a
1
.
.
.
a
i
.
.
.
a
n
=
a
1
(X)
a
1
(Y )
a
1
(Z)
.
.
.
.
.
.
.
.
.
a
i
(X)
a
i
(Y )
a
i
(Z)
.
.
.
.
.
.
.
.
.
a
(X)
n
a
n
(Y )
a
n
(Z)
=
a
(X)
a
(Y )
a
(Z)
. (8)
The acceleration vectors after transformation are
presented in the Earth coordinate system, wherein
the new Z−dimension represents the vertical direc-
tion which is perpendicular to the ground, whereas the
new X− and Y − dimensions represent the horizontal
plane which is parallel to the ground. These trans-
formed X − and Y −dimensions always point towards
the East and the magnetic North Pole respectively re-
gardless of the walking direction. However, due to the
fact that the user can walk in any direction in the hor-
izontal plane, gait signals in the transformed X − and
Y − dimensions which are captured from a session can
be dissimilar to those captured from other sessions re-
spectively. Therefore, instead of using the signals in

each separate dimension of X and Y , we utilize the
combined signal of X −Y
a
(XY )
= (a
(XY )
1
, . . . , a
(XY )
i
, . . . , a
(XY )
n
), (9)
where a
(XY )
i
=
q
(a
(X)
i
)
2
+ (a
(Y )
i
)
2
.
In other words, the gait signals will be finally rep-
resented in the 2 dimensions of the Earth, wherein the
transformed Z− and XY − axes represent the verti-
cal and horizontal directions of walking, respectively.
Moreover, the magnitude of the gait signal is addi-
tionally utilized as an additional dimension for gait
representation.
a
(M)
= (a
(M)
1
, . . . , a
(M)
i
, . . . , a
(M)
n
), (10)
where a
(M)
i
=
q
(a
(X)
i
)
2
+ (a
(Y )
i
)
2
+ (a
(Z)
i
)
2
.
In summary, the gait signal after transformation
will be presented in 3 dimensions as described above.
A =
a
(Z)
a
(XY )
a
(M)
=
a
(Z)
1
a
(XY )
1
a
(M)
1
.
.
.
.
.
.
.
.
.
a
(Z)
i
a
(XY )
i
a
(M)
i
.
.
.
.
.
.
.
.
.
a
(Z)
n
a
(XY )
n
a
(M)
n
. (11)
Since each acceleration sample is always trans-
formed into the Earth coordinate system according to
the current orientation of the mobile determined as
soon as the acceleration value is returned, it is more
robust than the solution proposed in (Hoang et al.,
2013), in that all of the signals are likely to be trans-
formed according to the initial orientation of the mo-
bile, which is predetermined before the user starts to
walk.
4 GAIT RECOGNITION MODEL
CONSTRUCTION
In this section, we propose a novel gait verifica-
tion system using statistical analysis and a super-
vised learning, working effectively on orientation-
independent gait signals obtained by using the method
presented in the previous section. Our system follows
the traditional pattern recognition process consisting
of mandatory steps such as data preprocessing, seg-
mentation, feature extraction and classification.
4.1 Data Preprocessing
4.1.1 Linear Interpolation
As the mobile sensor is a power saving device which
is simpler than standalone sensors, the sampling rate
is not always stable. The time interval between two
consecutive returned samples is not identical. First,
we apply linear interpolation to the acquired acceler-
ation samples to achieve gait signals at a fixed sam-
pling rate.
Moreover, due to the design of the mobile oper-
ating system (e.g., Android OS), the triplet of accel-
eration sample, orientation sample and gravity sam-
ple is not yielded simultaneously. Meanwhile in the
proposed solution to handle the disorientation issue,
it is required that this triplet need to be yielded con-
currently. Therefore, we additionally apply the same
linear interpolation to the obtained orientation sam-
ples and gravity samples. The timestamp of the inter-
polated acceleration samples is used as the reference
axis to determine the approximate orientation vector
and gravity vector yielded at the same time as the ac-
celeration vector.
4.1.2 Noise Elimination
Gait signals captured by the mobile accelerometer in-
evitably contain much noise. This can be due to the
misplacement error (Figure 1b), the quality of the
sensors or bumps on the ground while walking, the
difference in footwear, etc. We apply a multi-level
wavelet decomposition and reconstruction method to
remove the noise components in the signal. Techni-
cally, the detailed coefficients (obtained by HF filter
as in Figure 2 ) are set to 0s at all decomposition lev-
els. The signal reconstruction process involves com-
bining the detailed coefficients of zero with the coarse
coefficients from the lowest level until the level 0 is
achieved. Specifically, in this study, we apply the
Daubechies orthogonal wavelet (Db6) (Mallat, 1989;
Daubechies, 1992) with the decomposition at level 2
to mitigate the noise caused by the acquisition envi-
ronment.
Figure 2: Multi-level wavelet decomposition.
4.2 Gait Pattern Extraction
4.2.1 Gait Cycle based Segmentation
Segmentation is the most important process which
could directly affect the quality of the extracted gait
patterns. It can be easily seen that walking is a cyclic
activity so that the gait signal should be segmented
into gait cycles instead of fixed-length patterns.
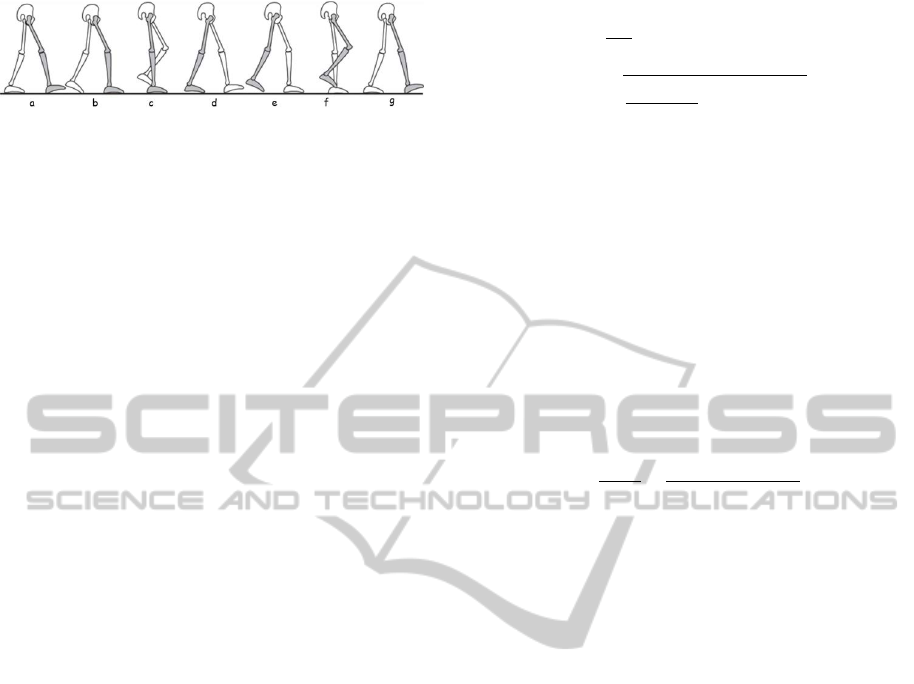
Figure 3: Illustration of a gait cycle.
Gait cycle is commonly defined as the time inter-
val between two successive occurrences of one of the
repetitive events when walking (Whitle, 2003). Par-
ticularly, a gait cycle can start with initial contact of
the heel and continue until the same heel contacts the
ground again. We assume that the mobile device is
placed at the same side with the leg which is going to
contact the ground as in the phase “a” or “g” in the
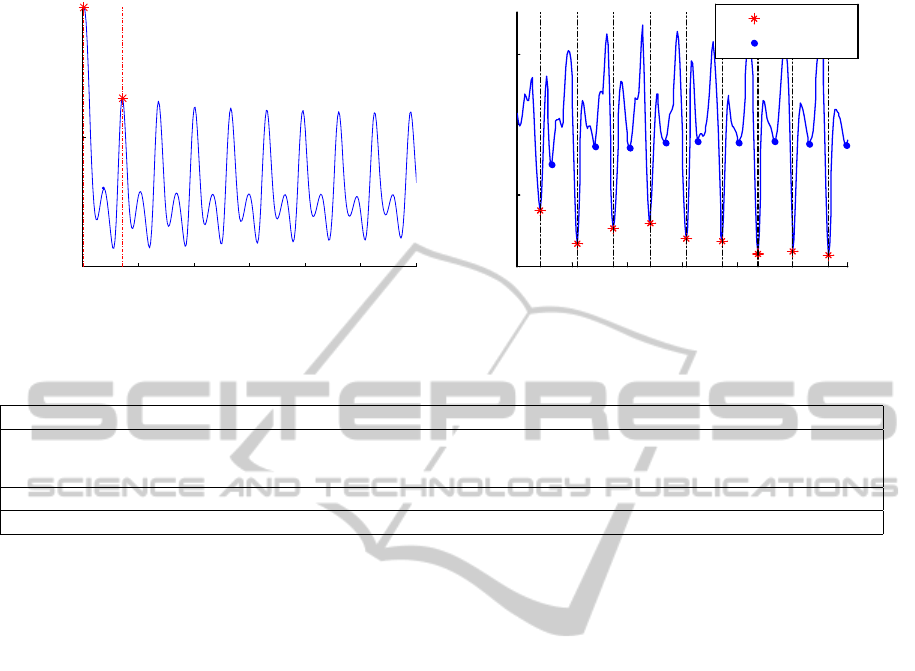
Figure 3, for example the right leg. So, at the time
the heel touches the ground, the association of the
ground reaction force and the inertial force together
will act on the right leg, which makes the acceleration
value of the transformed Z−dimension signal sensed
by the accelerometer strongly change and form nega-
tive peaks (illustrated as star points in the Figure 4b).
They are recognized as the starting points of the gait
cycles. Note that when the event “d” happens (e.g.,
the left heel touches the ground), the accelerometer
also generates negative peaks, similar to the “a” event.
However, since the device is placed at the right leg
which is opposite to the left, the accelerometer only
senses insignificant forces acting on the right leg in
this case. Therefore, the magnitude of peaks gener-
ated by “d” events (Figure 4b, circle points) is not
high as those generated by “a” or “g”. The objective
of the segmentation step is to divide the signal into
separate gait cycles. So, it is required to determine
peaks which are generated by the event of “a” or “g”
in the Figure 3. First of all, we determine the position
of all of the negative peaks in the Z−dimension gait
signal a
(Z)
of length n. Let
Π = {i
j
|a
(Z)
i
j
−1
> a
(Z)
i
j
, a
(Z)
i
j
+1
> a
(Z)
i
j
, i
j
∈ 1. . . n} (12)
be the set of index of these peaks with the order pre-
served. Assuming that |Π| is always larger than 1
given a gait signal of a walking session, we filter the
starting points of the gait cycles in Π based on two
criteria.
The first criterion is based on the magnitude of the
peaks. We eliminate the noisy peaks whose values are
higher than a threshold δ determined by the mean and
standard deviation of all of the peaks in Π.
δ = µ
Π
− τσ
Π
, (13)
where
µ
Π
=
1
|Π|
∑
i∈Π
a
(Z)
i
,
σ
Π
=
s
1
(|Π| − 1)
∑
i∈Π
a
(Z)
i
− µ
Π
,
(14)
τ is a user-defined parameter.
The second is based on the correct positions of the
gait cycle’s starting points. While the distance be-
tween starting points of the gait cycle is assumed to
fluctuate around a constant range in other studies (De-
rawi et al., 2010b; Derawi et al., 2010a), we observed
that such range does not cover all possible cases since
the walking speed of different individuals varies sig-
nificantly. Instead, we estimate the length of the gait
cycle according to the characteristics of each signal.
To determine the periodicity of the gait signal, we
calculate the autocorrelation coefficients c
t
(0 ≤ t < n)
of the Z−dimension signal by
c
t
=
N
N −t
×
∑
N−t
i=1
a
i
(Z)
a
i+t
(Z)
∑
N
i=1
(a
i
(Z)
)
2
. (15)
The moving average algorithm is then applied to
smooth these coefficients. Let us assume that c
i
and c
j
are the 1
st
and 2
nd
peaks autocorrelation coefficients,
respectively, as depicted by two stars in the Figure 4a.
Then, the length of a gait cycle can be approximated
by
∆ = j. (16)
According to the two criteria of magnitude and po-
sition, we determine the peaks representing the start-
ing points of the gait cycles. Let Ω be the set of these
peaks with the order of indices preserved. Then, Ω
will be given by
Ω = {i
j
|a
(Z)
i
j
< δ, (∃i
k
∈ Π, k > j, ∆ − ε ≤ i
k
− i
j
≤ ∆ + ε), i
j
∈ Π},
(17)
where ε > 0 is the user-defined parameter. Assuming
that there are k−1 where k > 1 gait cycles in the given
gait signal, hence, |Ω| = k. We separate the signal into
k − 1 distinct segments, with each S
i
consisting of a
full gait cycle
S
i
=
a
(Z)
Ω
i
a
(XY )
Ω
i
a
(M)
Ω
i
.
.
.
.
.
.
.
.
.
a
(Z)
Ω
i+1
a
(XY )
Ω
i+1
a
(M)
Ω
i+1
. (18)
4.2.2 Pattern Extraction
We form gait patterns by concatenating the separate
one-gait-cycle segments extracted in the previous sec-
tion. Each gait pattern would contain n
s
consecutive
segments and 50% of them overlaps with the previous
0 50 100 150 200 250 300
0.8
0.9
1
Normalized coefficient
c
Time lagged (
t
)
(a)
0
50
100
150
200
250
300
-10
-5
0
5
Acceleration (m/s
2
)
Sample
Event "a"
Event "d"
(b)
Figure 4: (a) Auto-correlation coefficients , (b) Detected marking points in Z−signal.
Table 1: List of gait features extracted in time and frequency domains.
Time domain features
Mean of the max/min value in each s
(D)
u
in p
(D)
where D = Z, XY M; average absolute difference; root mean
square; standard deviation; waveform length; 10-bin histogram distribution; average length of s
(D)
u
in p
(D)
Frequency domain features
Magnitudes of first 40 FFT coefficients; first 40 DCT coefficients.
one. Let
h
s
(Z)
u
s
(XY )
u
s
(M)
u
i
be a segment consisting
of a gait cycle, where s
(Z)
u
=
h
a
(Z)
u1
. . . a
(Z)
un
u
i
>
, s
(XY )
u
=
h
a
(XY )
u1
. . . a
(XY )
un
u
i
>
, s
(M)
u
=
h
a
(M)
u1
. . . a
(M)
un
u
i
>
. Let
p
(Z)
=
h
a
(Z)
11
. . . a
(Z)
1n
1
a
(Z)
21
. . . a
(Z)
2n
2
. . . a
(Z)
u1
. . . a
(Z)
un
u
. . . a
(Z)
s1
. . . a
(Z)
sn
s
i
>
,
p
(XY )
=
h
a
(XY )
11
. . . a
(XY )
1n
1
a
(XY )
21
. . . a
(XY )
2n
2
. . . a
(XY )
u1
. . . a
(XY )
un
u
. . . a
(XY )
s1
. . . a
(XY )
sn
s
i
>
,
p
(M)
=
h
a
M)
11
. . . a
(M)
1n
1
a
(M)
21
. . . a
(M)
2n
2
. . . a
(M)
u1
. . . a
(M)
un
u
. . . a
(M)
s1
. . . a
(M)
sn
s
i
>
.
Then, a gait pattern P is defined by
P =
p
(Z)
p
(XY )
p
(M)
=
a
(Z)
11
a
(XY )
11
a
(M)
11
.
.
.
.
.
.
.
.
.
a
(Z)
un
u
a
(XY )
un
u
a
(M)
un
u
.
.
.
.
.
.
.
.
.
a
(Z)
sn
s
a
(XY )
sn
s
a
(M)
sn
s
. (19)
4.3 Gait Model Construction
4.3.1 Feature Extraction
We extract the features on both time and frequency
domains as used in (Hoang et al., 2013) for each gait
pattern P. The list of extracted features is briefly sum-
marized in the Table 1. Note that all of the features in
the time and frequency domains are extracted for the
3 dimensions of the gait pattern (viz. p
(Z)
, p
(XY )
, p
(M)
in (19)), except for the “average length of s
(D)
u
in p
(D)
”
feature since its value is identical in all 3 dimensions.
All of the extracted features are concatenated to form
the final feature vector for a gait pattern.
4.3.2 Feature Vector Dimension Reduction
Since we expect the system to run directly on the
mobile phone with limited computational resources,
it is necessary to reduce the dimension of the ex-
tracted feature vectors to lighten the complexity of
the gait model built by using the machine learning al-
gorithms. Thus, we adopt the Principle Component
Analysis (PCA) to reduce the number of dimensions
while maintaining the discriminability of the feature
vectors.
Let us assume that the number of users is denoted
as N. The number of feature vectors extracted from all
of the gait patterns for each user is M. According to
the feature extraction phase, the length of each feature
vector is n
f
= 289. The j
th
( j = 1 .. . M) feature vector
of the user i(i = 1. . . N) is denoted as
v
(i)
j
=
h
f
(i)
j,1
, . . . , f
(i)
j,k
, . . . , f
(i)
j,n
f
i
, (20)
where f
(i)
j,k
is the k
th
feature component of v
(i)
j
. The
matrix of feature vectors of all users can be formed as

F
>
=
v
(1)
1
.
.
.
v
(i)
j
.
.
.
v
(N)
M
=
f
(1)
1,1
f
(1)
1,k
f
(1)
1,n
f
.
.
.
.
.
.
.
.
.
f
(i)
j,1
f
(i)
j,k
f
(i)
j,n
f
.
.
.
.
.
.
.
.
.
f
(N)
M,1
f
(N)
M,k
f
(N)
M,n
f
=
v
1
.
.
.
v
t
.
.
.
v
MN
∈ R
MN×n
f
.
(21)
Then, a covariance matrix of F can be calculated by
Σ =
1
MN
MN
∑
i=1
(v
i
−
¯
v)(v
i
−
¯
v)
>
∈ R
n
f
×n
f
. (22)
Let
−→
λ = (λ
1
, . . . , λ
i
, . . . , λ
n
f
) and u
i
be eigenvalues
and eigenvectors obtained from the Σ, respectively.
All eigenvalues λ
i
of Σ are sorted in descending or-
der in which the higher the eigenvalues are, the more
important they are. Assuming that λ
i
< λ
i−1
, to re-
duce the number of dimensions of the original feature
vector from n
f
to k, k eigenvectors are taken accord-
ing to the order of the eigenvalues
U =
u
1
. . . u
i
. . . u
k
∈ R
n
f
×k
. (23)
The dimension-reduced matrix of feature vectors can
be calculated by
ˆ
F
>
= F
>
U. (24)
4.3.3 Gait Recognition Model for Verification
and Identification
We adopt two schemes, namely feature vector match-
ing and supervised learning, for both identification
and verification. In the former scheme, the feature
vectors extracted after using PCA are stored in the
mobile storage, which will be used for user identifi-
cation or verification. In the latter scheme, we ap-
ply Support Vector Machine (SVM) with a linear ker-
nel to build a gait model for each user. An open li-
brary tool, libsvm (Chang and Lin, 2011), is used in
this study for SVM-based gait model construction and
evaluation.
5 Experiments
5.1 Dataset Description
We use the dataset which is an extended version of
the one used in (Hoang et al., 2013) for experimental
evaluation in this study. We would like to briefly de-
scribe the original and extensions of this dataset and
refer the readers to the original work of the authors
for more details. The dataset consists of gait signals
of 38 subjects captured by using a Google Nexus One
mobile phone. The device is put freely inside the front
trouser pocket and the sampling rate of integrated sen-
sors is set to 27Hz. Besides data described in the
original work, the authors further provide other sen-
sor data which are collected along with acceleration
data during gait sensing period in the extended ver-
sion. List of particular sensors activated in this phase
is summarized in the Table 2.
5.2 Experimental Configuration
Since the sampling rate of the sensor is low (27 Hz),
making the number of samples in a one-gait-cycle
segment small, we form each gait pattern extracted
in Section 4.2.2 by concatenating n
s
= 4 consecutive
segments, in order to feasibly extract enough features
in the time and frequency domains. In total, around
10226 gait patterns are extracted from the dataset.
Moreover, the length of the feature vectors after ap-
plying PCA is selected to be equal to n
0
such that the
first n
0
eigenvectors capture at least 99.5% of the total
variance. According to the dataset used in this study,
n
0
is equal to 42.
We re-implement several state-of-the-art gait
recognition systems on the dataset used in this experi-
ment ((Rong et al., 2007; Gafurov et al., 2010; Derawi
et al., 2010a)) in order to not only evaluate the effec-
tiveness of the solution proposed to handle the disori-
entation problem, but also compare with our proposed
recognition schemes. The effectiveness of gait recog-
nition systems is evaluated under two aspects: identi-
fication and verification capabilities. Note that in the
comparison of the verification and identification ca-
pabilities among the studies, the disorientation prob-
lem is not taken into account so that all of the works
will be evaluated on the orientation-independent gait
signals (referred to as the transformed dataset). Fur-
thermore, as Rong et al. used the gait signals of the
X− and Y − dimensions which are not available in
the transformed dataset, we replace them with the gait
signals of the XY − and M− dimensions to make sure
that the number of dimensions is consistent to that in
the original study. In Gafurov et al.’s method, the au-
thors experimented on the gait signals of different di-
Table 2: List of physical and virtual sensors activated during
the gait capture process.
Sensor Name Model name Sampling rate
Magnetic field sensor AK 8973 25 Hz
Accelerometer BMA 150 25 Hz
Orientation sensor Virtual 25 Hz
Gravity sensor Virtual 25 Hz
Linear acceleration sensor Virtual 25 Hz
Rotation vector sensor Virtual 25 Hz

Table 3: The configuration differences in between the original study and this experiment.
Method
Original setup This experiment
Axes # Subject Position SR (%) Axes # Subject Position SR
Rong et al. X,Y, Z 38 Ankle 250 Z, XY, M 38 Front pocket 27
Gafurov et al. Z 30 Ankle 100 Z 38 Front pocket 27
Derawi et al. M 60 Hip 100 M 38 Front pocket 27
mensions and achieved various results. Based on the
availability of dimensions in the transformed dataset,
we select the gait signal of the Z−dimension (referred
to as the up-down direction in the original) as the stan-
dard for evaluation and comparison. Table 3 shows
the difference in the configuration settings in between
the original studies and this experiment.
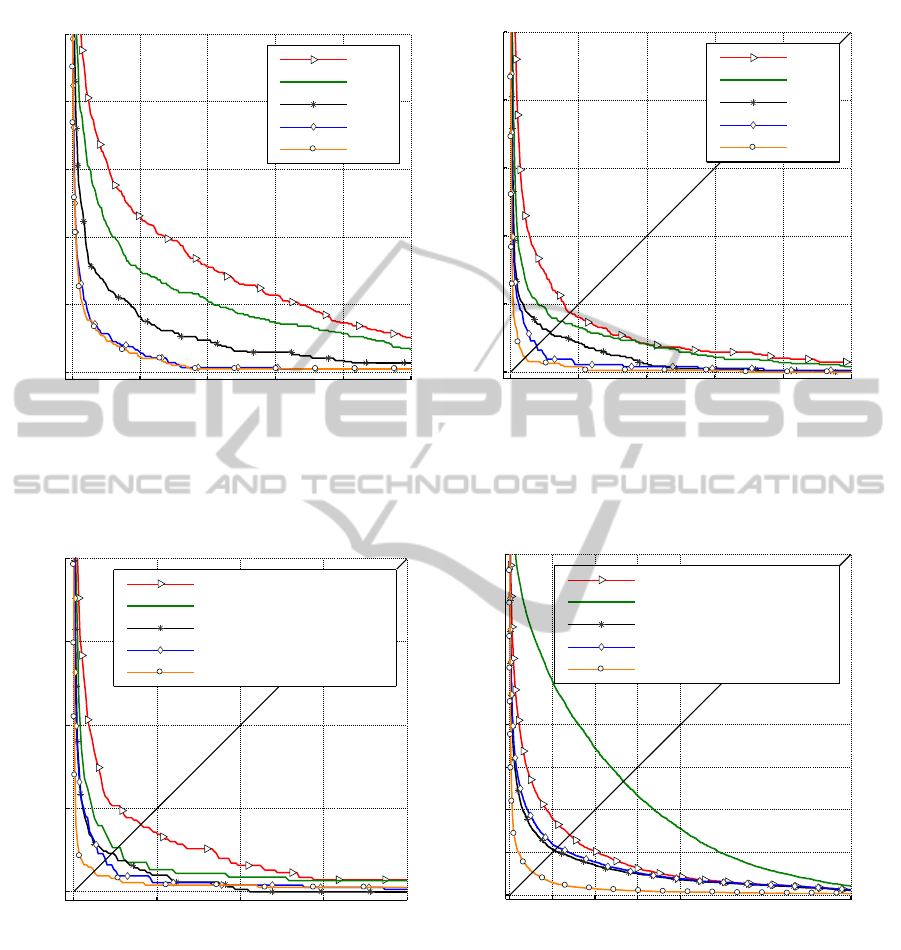
5.3 Verification Results
We utilize Receiver Operating Characteristic (ROC)
curves to illustrate the performance of the proposed
system in the aspect of verification. Firstly, we ex-
periment with different portions of the training data
and testing data, ranging from k = 5% to 50%, in or-
der to determine the influence of the number of train-
ing data on the effectiveness of the proposed schemes.
Note that we apply cross-verification to overall eval-
uate the performance of the proposed method. Partic-
ipants will be considered as the genuine user in turn.
Specifically for each user i, in the PCA approach, we
store randomly k gait patterns of the user i as the train-
ing data. The remaining patterns of the user i will be
utilized for testing the false rejection rate (FRR), and
the patterns of all other users j( j 6= i) will be used
for testing false acceptance rate (FAR). Similarly in
the PCA+SVM approach, k genuine gait patterns of
the user i and k patterns of each other users will be
used to construct the gait model for the user i, while
remaining data will be used for evaluating the error
rates of the constructed model.
Figure 5 depicts the error rates of the proposed
method using the PCA and PCA+SVM schemes with
different proportions of training data and testing data.
As expected, a higher proportion of the training data
yield a lower error rate. Moreover, we can see that
applying a supervised learning (PCA+SVM) tech-
nique can help to enhance the accuracy of the system.
The overall error rate achieved using the PCA+SVM
scheme is lower than that when only using the PCA
scheme. Next, we compare the proposed system with
those of other studies which are re-implemented and
evaluated according to the new configuration settings.
The verification performance of all of these studies is
investigated on two testing scenarios: Firstly, we con-
sider each walking session as a testing trial, which is
commonly used in comparing studies. Unlike in these
studies, we apply majority voting to our schemes to
validate each walking session. That means the user
is verified if a larger portion of the gait patterns ex-
tracted in the session is recognized as being authen-
tic. Figure 6a depicts the error rates of the proposed
methods and other studies in this scenario.
From our viewpoint, session-based verification
might require a lot of time and efforts from the user
since he/she has to continuously walk for a long dis-
tance, in order to collect enough data to be verified.
The verification process can be performed faster and
more constantly if the system can immediately verify
the user only using the gait pattern instead of hav-
ing to wait until the walking session finishes. There-
fore, we additionally investigate the performance of
the methods in all of the studies when the separate
gait patterns are treated as independent testing trials.
As depicted in Figure 6b, we can see that the error
rates of all of the approaches are higher than those
in the session-based scenario. Especially in Rong et
al.’s method, the error rate is significantly increased,
since the method of gait pattern extraction employed
strongly relies on the whole walking session data. The
error rate of our method using the PCA+SVM scheme
in this scenario is approximately 5.35%, which can
help to reduce the time and effort needed to perform
the verification task. Table 4 summarizes the EERs
achieved in all of the studies according to two scenar-
ios. It can be seen that in the session-based scenario,
the achieved EERs with the methods proposed in the
other studies after evaluating them in the transformed
dataset are similar to original values. This reflects that
handling the disorientation problem is mandatory in
order to maintain the effectiveness of gait recognition
systems because this problem might result in a signif-
icant increase of the error rates of the systems. This
impact will be clearly shown in the Section 5.5.
5.4 Identification Results
We also investigate the identification capability of the
proposed method and other studies according to the
two evaluation scenarios described above. The same
1-nearest neighbor algorithm is applied to all meth-
ods, except for the PCA+SVM scheme in order to
measure the performance between studies. The best
accuracy rate belongs to the proposed PCA+SVM
0 0.1 0.2 0.3 0.4 0.5
0
0.1
0.2
0.3
0.4
0.5
False Acceptance Rate
False Rejection Rate
ROC curve
5%
10%
20%
40%
50%
(a) PCA
0
0.1
0.2
0.3
0.4
0.5
0
0.1
0.2
0.3
0.4
0.5
False Acceptance Rate
False Rejection Rate
ROC curve
5%
10%
20%
40%
50%
(b) PCA+SVM
Figure 5: ROC curves of the proposed system using two verification schemes according to different portions of training data.
0
0.1
0.2
0.3
0.4
0
0.1
0.2
0.3
0.4
False Acceptance Rate
False Rejection Rate
ROC curve
Gafurov et al.
Rong et al.
Deraw i et al.
This study (PCA)
This study (PCA+SVM)
(a) Session-based verification
0
0.1
0.2
0.3
0.4
0.8
0
0.1
0.2
0.3
0.4
0.8
False Acceptance Rate
False Rejection Rate
ROC curve
Gafurov et al.
Rong et al.
Deraw i et al.
This study (PCA)
This study (PCA+SVM)
(b) Pattern-based verification
Figure 6: The ROC curves of the proposed method and other studies which are re-implemented and evaluated according to
the configuration in Table 3.
scheme, with an amount of approximately 99.14%
being achieved under session-based identification as-
pect. Table 5 shows the identification performance of
the proposed method and comparing studies. Similar
to the verification results, the accuracy rate of pattern-
based identification is normally lower than that of
session-based identification. Especially in Rong et
al.’s method, the accuracy of the system strongly de-
creases an amount of approximately 30%.
5.5 The Impacts of Disorientation Error
Finally, we illustrate the impact of disorientation er-
rors on the accuracy of the gait verification systems.
As already mentioned, the instability of sensor ori-
entation would cause the gait signals acquired in the
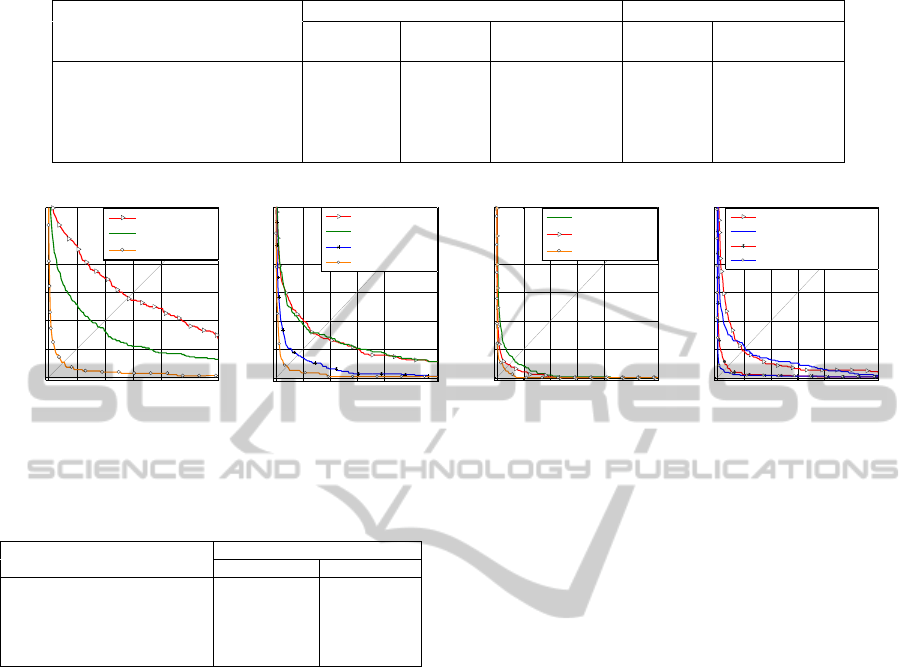
Table 4: The error rates of session-based and pattern-based gait verification methods.
Method
Session-based Pattern-based
EER(%)
(original)
EER (%)
FRR (%)
(at FAR = 1%)
EER (%)
FRR (%)
(at FAR = 1%)
Rong et al. 5.6 5.28 16.47 26.67 84.27
Gafurov et al. 2.2 − 23.6 8.07 28.43 14.11 52.37
Derawi et al. 5.7 4.59 10.71 10.49 31.86
Proposed method (PCA) – 3.83 10.75 11.23 35.03
Proposed method (PCA+SVM) – 2.45 3.75 5.35 14.38
0
0.1
0.2
0.3
0.4
0.6
0
0.1
0.2
0.3
0.4
0.6
False Acceptance Rate
False Rejection Rate
{X,Y,Z}
original
{M}
original
{Z,XY,M}
transformed
(a) Rong et al.
0 0.1 0.2 0.3 0.4 0.6
0
0.1
0.2
0.3
0.4
0.6
False Acceptance Rate
False Rejection Rate
{Z}
original
{M}
original
{Z}
transformed
{Z,XY,M}
transformed
(b) Gafurov et al.
0
0.1
0.2
0.3
0.4
0.6
0
0.1
0.2
0.3
0.4
0.6
False Acceptance Rate
False Rejection Rate
{M}
original
{M}
transformed
{Z,XY,M}
transformed
(c) Derawi et al.
0
0.1
0.2
0.3
0.4
0.6
0
0.1
0.2
0.3
0.4
0.6
False Acceptance Rate
False Rejection Rate
{M}
original
(PCA)
{M}
original
(PCA+SVM)
{Z,XY,M}
transformed
(PCA)
{Z,XY,M}
transformed
(PCA+SVM)
(d) The proposed method
Figure 7: The impacts of the disorientation error on the error rates of the gait verification systems.
Table 5: The error rates of session-based and pattern-based
gait identification methods.
Method
Accuracy rate (%)
Session-based Pattern-based
Rong et al. (+kNN) 93.12 64.82
Gafurov et al. (+kNN) 87.68 76.55
Derawi et al. (+kNN) 93.41 88.09
Proposed method (PCA+kNN) 96.56 85.48
Proposed method (PCA+SVM) 99.14 94.93
3 separate dimensions to be dissimilar. As can be
seen in Figure 7a (the triangle line), since the authors
store the gait patterns of the separate dimensions, in-
cluding the X-Template, Y-Template and Z-Template,
as the reference set for individual matching, the er-
ror rate is significantly increased, because of the dis-
similarity issues. This is similar to Gafurov et al.’s
work (Figure 7b). Looking at both Figures 7a, 7b, it
can be seen that protecting the similarity of the gait
signals from the disorientation problem can help to
maintain the accuracy rate of the system. Based on
our observations, the magnitude of the gait signal is
orientation-independent, so it can be used to construct
the gait verification system in spite of the disorienta-
tion issues. This signal was used in the original study
of Derawi et al. and achieved positive results (Fig-
ure 7c). Therefore, we also modified the methods
of Rong et al. and Gafurov et al. by only using the
magnitude of the signal and found that the error rates
could be enhanced. However, from our perspective,
we are strongly convinced that the gait can be more
distinguishable if the gait signal can be expressed
in higher dimensions. Consequently, additional ex-
periments are conducted according to the hypothesis,
wherein we employ the gait signals of all dimensions,
which can be obtained after overcoming the disorien-
tation problem. As expected, the error rates achieved
with the methods of all of the studies are likely to be
more decreased when the gait signals in the dimen-
sions of Z, XY, M are all used (Figure 7). Therefore,
we believe that overcoming the disorientation prob-
lem, in order to maintain the number of dimensions
of the acquired gait signals, is mandatory to optimize
the performance of gait verification and identification
systems.
6 CONCLUSIONS
In this paper, we addressed the sensor disorientation
problem in gait verification or identification systems
which can frequently arise in reality, especially in
the mobile context. A simple but effective solution
taking advantages of available sensors in mobile de-
vice was proposed. A gait recognition model leverag-
ing statistical analysis and supervised machine learn-
ing which could be used to verify or identify mo-
bile user was also presented. The results achieved
are highly promising, especially with regard to iden-
tification. They reflect the good potential of deploy-
ing a gait-based authentication to ameliorate the se-
curity on portable devices. Note that our proposed
method does not aim to completely replace the exist-
ing explicit authentication schemes on mobiles, since

at this moment it is infeasible to achieve a perfect se-
curity level (e.g., the zero-FAR is always achieved) of
any behavioral biometric-based verification systems.
However, the proposed method can be used as an ad-
ditional authentication scheme, especially for applica-
tions which do not require excessively strict security
levels, to enhance the usability of the device. In a fu-
ture work, we would like to investigate on developing
a unique gait recognition model working effectively
regardless of the relative position of the mobile to its
owner. A protection scheme used to secure gait tem-
plate/ models stored directly in the device will also be
our main further work.
ACKNOWLEDGEMENTS
This research was supported by Basic Science Re-
search Program through the National Research Foun-
dation of Korea (NRF) funded by the Ministry of Edu-
cation (2012R1A1A2007014). The research was also
supported by 2012-18-02TD VNU–HCMC Project.
REFERENCES
Ailisto, H. (2005). Identifying people from gait pattern with
accelerometers. In InDefense and Security. SPIE.
Breitinger, F. and Nickel, C. (2010). User survey on phone
security and usage. In BIOSIG. GI.
Chang, C. and Lin, C. (2011). Libsvm: a library for support
vector machines. In ACM Transactions on Intelligent
Systems and Technology (TIST). ACM.
Daubechies, I. (1992). Ten lectures on wavelets. In
Philadelphia: Society for industrial and applied
mathematics. Society for Industrial and Applied
Mathematics.
Derawi, M. and Bours, P. (2013). Gait and activity recogni-
tion using commercial phones. In Computers & Secu-
rity. Elsevier Advanced Technology Publications.
Derawi, M. et al. (2010a). Improved cycle detection for ac-
celerometer based gait authentication. In In Intelligent
Information Hiding and Multimedia Signal Process-
ing (IIH-MSP). IEEE.
Derawi, M. et al. (2010b). Unobtrusive user-authentication
on mobile phones using biometric gait recognition. In
In Intelligent Information Hiding and Multimedia Sig-
nal Processing (IIH-MSP), 2010 Sixth International
Conference on. IEEE.
Fish, D. and Nielsen, J. (1993). Clinical assessment of hu-
man gait. In Journal of Prosthetics and Orthotics.
JPO.
Frank, J. et al. (2010). Activity and gait recognition with
time-delay embeddings. In AAAI. AAAI Press.
Gafurov, D. et al. (2010). Improved gait recognition per-
formance using cycle matching. In Advanced In-
formation Networking and Applications Workshops
(WAINA), 2010 IEEE 24th International Conference
on. IEEE.
Gafurov, D. and Snekkenes, E. (2009). Gait recognition us-
ing wearable motion recording sensors. In EURASIP
Journal on Advances in Signal Processing. Hindawi
Publishing Corp.
Hoang, T. et al. (2013). A Lightweight Gait Authentica-
tion on Mobile Phone Regardless of Installation Er-
ror. Springer, Berlin.
Holien, K. (2008). Gait recognition under non-standard
circumstances.
Jain, A. et al. (2004). An introduction to biometric recog-
nition. In Circuits and Systems for Video Technology,
IEEE Transactions on. IEEE.
Li, Y. et al. (2011). Gait authentication based on accelera-
tion signals of ankle. In Chinese Journal of Electron-
ics.
Lu, H. et al. (2014). Unobtrusive gait verification for mo-
bile phones. In Proceedings of the 2014 ACM Inter-
national Symposium on Wearable Computers. ACM.
Mallat, S. (1989). A theory for multiresolution signal de-
composition: the wavelet representation. In Pattern
Analysis and Machine Intelligence, IEEE Transac-
tions on. IEEE.
Mjaaland, B. et al. (2011). Paper templates. In Walk
the walk: attacking gait biometrics by imitation.
SPRINGER.
Mondal, S. et al. (2012). Gait based personal identification
system using rotation sensor. In Journal of Emerging
Trends in Computing and Information Sciences.
Ngo, T. et al. (2014). In intelligent information hiding and
multimedia signal processing (iih-msp). In Pattern
Recognition. Elsevier Science Inc.
Pan, G. et al. (2009). Accelerometer-based gait recognition
via voting by signature points. In Electronics letters.
Rong, L. et al. (2007). A wearable acceleration sensor sys-
tem for gait recognition. In Industrial Electronics and
Applications, 2007. ICIEA 2007. 2nd IEEE Confer-
ence on. IEEE.
Sprager, S. and Zazula, D. (2009). A cumulant-based
method for gait identification using accelerometer
data with principal component analysis and support
vector machine. In WSEAS Transactions on Sig-
nal Processing. World Scientific and Engineering
Academy and Society (WSEAS).
Terada, S. et al. (2011). Performance of gait authentication
using an acceleration sensor. In Telecommunications
and Signal Processing (TSP). IEEE.
Whitle, M. (2003). Gait analysis: an introduction.
